Where to go fishing? – Part 1 – Profitablity and Growth

A Day’s Fishing (circa 1923)Edward Henry Potthast

The obvious answer is … where there are fish.

Slack Investor is always on the lookout for growth companies … particularly when he is on the BUY! Since retirement, I haven’t had much chance to be on the Buy side of a transaction lately – as there isn’t that flow of fresh new money coming into the coffers from employment. Pre-retirement, any new money would flow into the cash reserves of my Super (SMSF -Self Managed Super Fund). When a sufficient amount of cash had built up, I would look around for some company shares to buy.

However, with the expected inflow of a bit of cash with the impending sale of Altium, I am starting to look around for suitable receivers of Slack Investor loot. Slack Investor is “Going Fishing”. The first thing I want in my pond is profitable companies – but I also want them to have a record of growth. In the second part of this fishing series, I will try to narrow things down to companies that I would actually like to buy.

Measures of Profitability

Slack Investor likes a company, that he invests in, to not only make a profit – but to use its shareholder funds in the best way to make a profit. There are many ways to look at profitability, but Slack Investor is pretty lazy in this regard and you won’t find him forensically gazing over profit and loss statements from a company report. I prefer couple of simple ratios to get an overview – I am no expert accountant.

Return on Equity (ROE)

ROE = Net Income/Shareholder Equity

I have always used Return on Equity (ROE) as a simple measure to give an idea on how a company is growing. Strictly speaking, the ROE is more a measure of profitability and how well it grows each dollar of company funds.

The higher the ROE, the more efficient a company’s management is at generating income and growth from its equity financing.

Investopedia

This metric is very easy to find in market aggregator sites such as Yahoo.com, Morningstar, or Investing.com. For a deep dive, I prefer Marketscreener.com – which has the advantage of showing Predicted ROE for the next few years on each companies financial page. One of the problems with ROE is that, companies with debt can present an inflated ROE.

Return on Invested Capital (ROIC)

ROIC = Net Profit (After Tax)/Average Invested Capital

The purest way of looking at how good a company is in converting shareholders money into profit is the ROIC. Unfortunately, this figure is harder to come by on the generic financial aggregator sites. This ratio is superior to the ROE as it accounts for the debt levels of a company – as the Average Invested Capital is the Average Equity – Average Debt.

Measure of Growth

Compound annual growth rate (CAGR)

A quick way of determining if a company is growing is the CAGR. It is often constructed from past , data. The “Compound Annual Growth Rate”—is the annualized rate of growth in the value of the Earnings, or Revenue, over a stated period. The maths is a bit complicated and best done on a spreadsheet or a search around the financial sites. I found limited CAGR data for stocks at Morningstar and finbox.com

CAGR is defined as the annualized growth rate in the value of a financial metric – such as revenue and EBITDA – or an investment across a specified period.

Wall Street Prep

Putting together Profitability and Growth

Fortunately there are some really nice blokes in the financial world that share the burden of responsibility to educate people about the share market as well as operating a profitable business. A shout out to Owen Raszkiewicz of the RASK Group. A great place to start your financial education with Owen is his Australian Finance podcast that he co-hosts with Kate Campbell. Slack Investor will often tune in to their discussions.

Below is a table Owen prepared in August 2023 that ranks Australian stocks in terms of their profitability (ROIC – Return on Invested Capital – Column F). He also shows, in the last column, the stock’s historical growth rate for the 5 years 2017-2022.
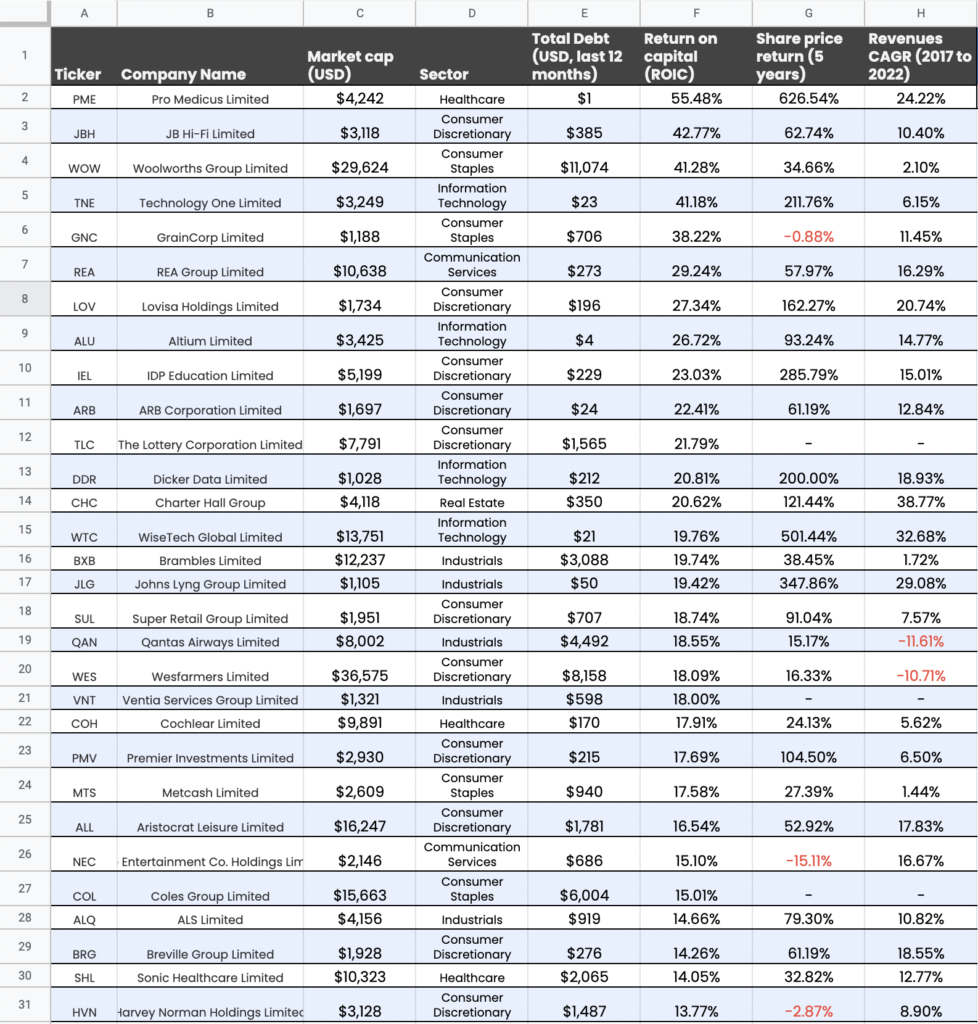
From Rask Media – ASX’s best companies published August 2023 – ranked in order of ROIC- Click on image to enlarge

This is a great place to start fishing, metrics for profitability and growth in one place. Pro Medicus is standing out here – High profitability (ROIC 55.48%) and high historical growth (5-yr CAGR 24.22%). A complete picture needs both of these metrics. For example, Woolworths has a high profitability (ROIC 41.28%) but is laggard in historical growth (5-yr CAGR 2.10%).

The next article in this series will look at how Slack Investor narrows these stocks down and then screens them further with the P/E Ratio to try to make sure that each potential buying stock is not overpriced.

2023 – Hope You Were Strapped In …  and January 2024 – End of Month Update

From Boredpanda.com

Slack Investor usually just assesses stock market returns at the end of the financial year. However, calendar year 2023 was some ride.

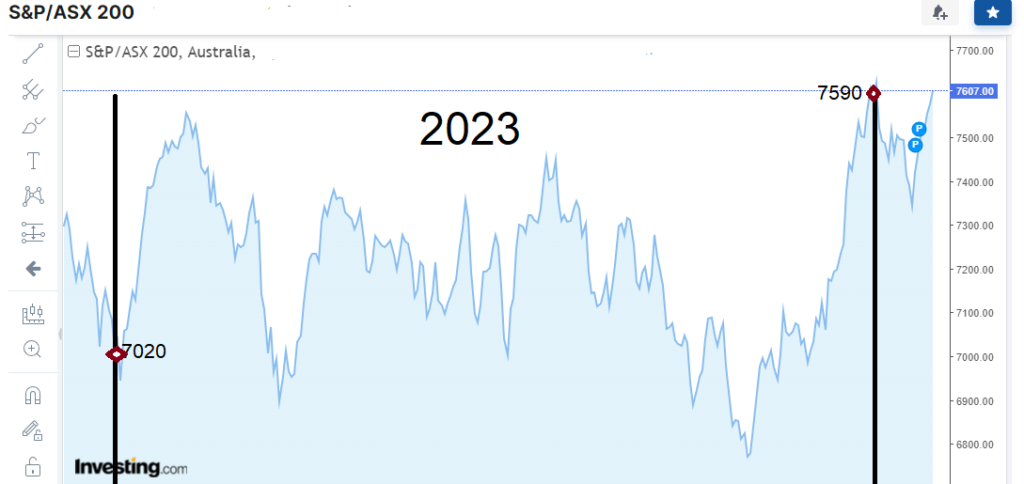
The 2023 ASX 200 Chart

For the 2023 calendar year, the ASX 200 Index started at 7020, and ended up at 7590 – a 12-mth increase of about 8% – but, on the way, it fell to a year low of 6751 – a temporary fall of 3.8%.

Of course, If you did not look at the charts daily, these fluctuations would mean nothing. If you ony looked at the Australian Index at yearly intervals, 2023 would probably bring some joy. As well as the overall 8% gain for the year, when you include dividends, the ASX 200 Index total return for calendar year 2023 was 12.2%. The ASX “All Ordinaries” Index (Tracking Australia’s largest 500 listed companies) had a total return of 13.0%.

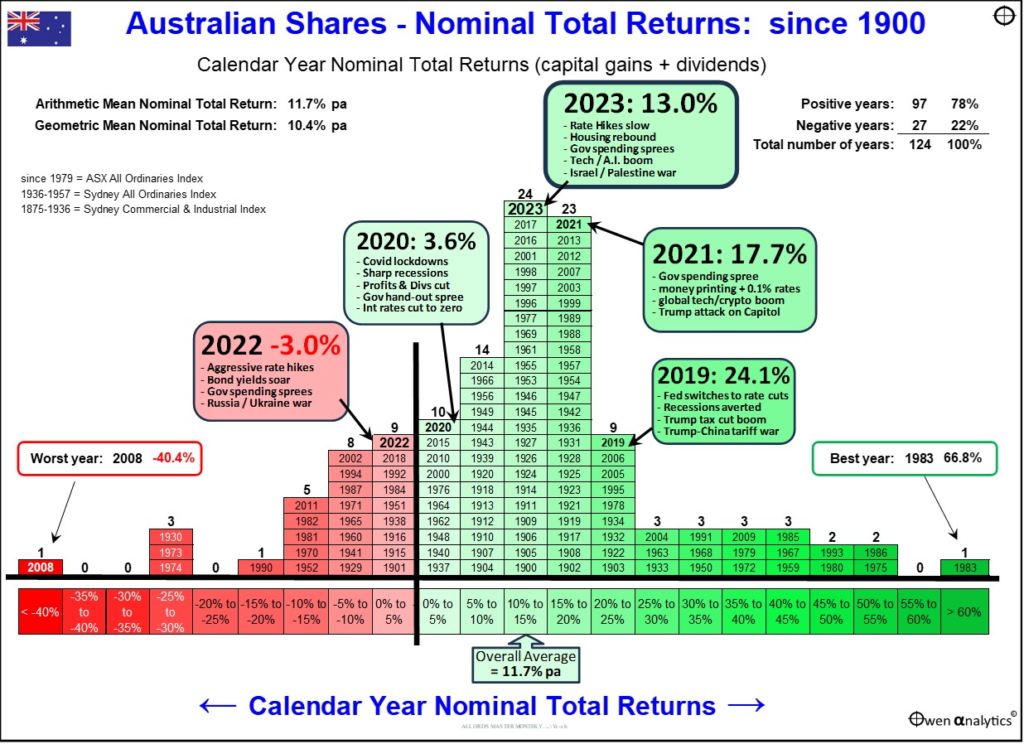
Slack Investor will again emphasize the joy of investing and mostly doing nothing – and trying to focus on longer term returns. One of the best summary charts I have seen for a while that shows calendar year returns has just been updated and published by Ashley Owen. Ashley uses the “All Ordinaries” Index rather than the ASX 200 Index- as there is more historical data available for comparison.

Total ASX “All Ordinaries” calendar year returns – with the the last 5 years highlighted – From Ashley Owen – Owen Analytics – (Click to Enlarge)

The first thing that jumps out in this chart is the amount of “Green” positive years vs the “Red” negative years. In 78% of calendar years, ASX Index returns are positive. The overall average total return since 1900 for the Australian “All Ordinaries” Index is 11.7%.

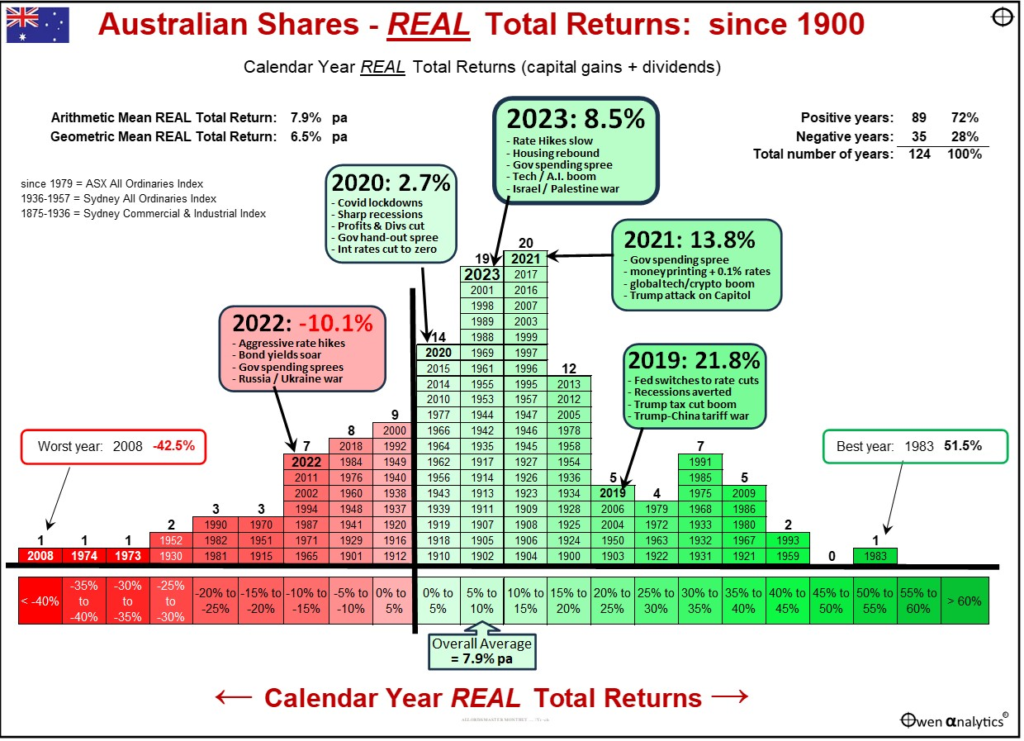
Inflation has been the topic of the day lately and Owen has kindly provided his calendar year chart in terms of Real Returns for the All Ordinaries Index – The total return minus the inflation rate (Consumer Price Index (CPI)). A certain amount of cash is worth holding to for liquidity – so that you can avoid selling stocks in a market downturn. Although cash can iron out some of the stock market fluctuations, being invested in cash is not a protection from inflation.

Total ASX “All Ordinaries” calendar year “Real” (minus inflation) returns – with the the last 5 years highlighted – From Ashley Owen – Owen Analytics – (Click to Enlarge)

Adjusted for cpi increases, the overall average “Real” total return since 1900 for the Australian “All Ordinaries” Index is 7.9%. Slack Investor is willing to put up with the volatility of share markets for an average “after inflation” return like this.

For financial independence and as a hedge against inflation, it is important to own growth assets – such as the Australian Share market. Sure, there will be the occasional negative annual returns ahead … but let’s not worry about this while the Australian stock market is rising. Long-term overall results are the important thing.

January 2024 – End of Month Update

Slack Investor is IN for Australian index shares, the US Index S&P 500 and the FTSE 100.

After a big Christmas Rally, things have settled down a bit with modest gains for the ASX 200 (+1.2%) and the S&P 500(+1.6%). The FTSE 100 had a small fall ( -1.3%)

It was time to adjust the stop loss for the S&P 500 as the current value is over 15% greater than the stop loss. Slack Investor has long believed the US market is overvalued and, while enjoying the journey, is happy to have his stop loss a little tighter. It is difficult to do the adjustment on the monthly chart, so I had a look at the weekly chart for the S&P 500 below. I am looking for a dip in the chart that represents a “Higher low”. The new stop loss now stands at 4682 – only 3% below the current value.

Extract from the S&P 500 weekly chart – From Incrediblecharts.com

All Index pages and charts have been updated to reflect the monthly changes – (ASX IndexUK IndexUS Index).

Looking Forward Looking Back …  and November 2023 – End of Month Update

Usually not much of a country and Western Fan, but Slack Investor is quite taken with this video of Slim Dusty in his rendition of Looking Forward Looking Back – where two Australian Music Legends (Don Walker and Slim Dusty) combine to make this beautiful Australian song. Slim must have been about 73 when this song was recorded in the year 2000.

Making sense of what I’ve seen
All the love we’ve had between
You and I, along the track
Looking forward, looking back

Looking Forward Looking Back – Don Walker (composer) (1951 – ) & Slim Dusty (vocals) (1924 – 2003)

This song is bitter-sweet to me as it was played at a good friend’s funeral … and I always get a little sad .. but then, I think of the good times I shared with my friend. My friend was also a keen investor and, I’m sure he wouldn’t mind me using this song to launch this post. It is a song of reflection … with a reminder to look forward as well.

Slack Five-Year Individual Share Performance

Though Slack Investor reports on his results on a yearly basis, the annual Nuggets and Stinkers post is a constant reminder of how, in successive years, a company can be “a nugget” … or “a stinker”. The market will often go in trends of overvaluation followed by a period of undervaluation – and the true measure of how the stock has performed is lost in these constant tidal changes. For my purposes (Slack!), a 5-yr measure of performance is about right – as this allows for the true performance of a quality stock to shine through.

I trawled through the Slack Portfolio to find stocks that I had owned for 5 years. I was suprised to find that, of my current 22 individual stocks or ETF’s that I own, I had held only 5 of these for 5 years. This is not what I expected from a Slack Investor and I had to drill down into the portfolio to realize that I had given my portfolio a big shake-up about 4-5 years ago. I had retired, injected a large portion of my work super into my SMSF, and also sold a few stocks to make way for a house purchase.

The 5 stocks that I had 5-yr data on were Altium, Macquarie Group. REA Group, CSL and Codan. The 5-yr Internal Rate of Return (IRR) figures give an “average” annual return for the 5-yr period and include dividends as well as any stock price growth. The results below, for the five years up to 30/06/23, are from my financial software – the free “Sunset” international version of Microsoft Money  Australian Version. There are IRR calculators and Compound Annual Growth Rate (CAGR) calculators also available online. I have also included the CAGR Total Return (TR) till 30/06/23 for each of the Slack followed markets (in bold) for reference.

StockSymbol5-yr IRR
Altium LtdALU14.8
Macquarie Group LtdMQG12.7
S&P500 (TR) 12.2
REA Group LtdREA11.3
CSL LtdCSL8.4
ASX200 (TR) 6.3
FTSE100 (TR) 3.8
Codan LtdCDA3.3

Digesting the above table, Slack Investor is generally pleased with the annual IRR over 5 years of the majority of held stocks. The exception is Codan (CDA) which has had a roller coaster ride in the price charts (see below) – and underperformed the ASX 200 index over 5 years. This stock needs further evaluation to see if I should continue to hold it in the Slack Portfolio.

There are strange days
Full of change on the way
But we’ll be fine, unlike some
I’ll be leaning forward, to see what’s coming

Looking Forward Looking Back – Don Walker (composer) (1951 – ) & Slim Dusty (vocals) (1924 – 2003)

I go to Market Screener Financials page for Codan to quickly see that the income for CDA is projected to increase for the next few years and the company is in a solid financial position. The projected Return on Equity (ROE) remains above 15% and, despite the dramatic price fall during 2021/2022 over earnings downgrades, the companies price trend so far in 2023, has been positive. This holding is currently on “watch” – but I remain a holder of CDA for now.

5-yr Price Chart of Codan (CDA) – from Investing.com

November 2023 – End of Month Update

Slack Investor is IN for Australian index shares, the US Index S&P 500 and the FTSE 100.

Due to a strong rebound this month Slack investor has cancelled his SELL Alert for the ASX200 that started at October 31 2023 due to a stop loss breach – and he now remains IN .

All Slack Investor overseas followed markets had a bumper month. The S&P 500 led the way with a massive rise of +8.9 %. More modest rises for the FTSE 100 +1.6% and the Australian stock market – the ASX 200 +4.5%.

All Index pages and charts have been updated to reflect the monthly changes – (ASX IndexUK IndexUS Index).

Corrective Lens and … October 2023 – End of Month Update

From Zeiss.com

Last week, the ASX 200 has moved into correction territory to its lowest point since October 2022. Both the S&P 500 and the NASDAQ Index are already in technical corrections. The FTSE 100 is faring marginally better, down around 9% from its recent peak in February 2023.

In the world of stock markets, a 10% decline from a previous peak is known as a “Correction”. Never a nice time … but Slack Investor recommends that you just put on the big pants and get used to these things. Corrections are just part of the landscape of investing in shares and Slack Investor has often written about them – and the need to roll with them – if you are using stock markets to better your financial position.

On average, the (US) market declined 10% or more every 1.2 years since 1980, so you could even say corrections are common.

For the S&P500 – Covenant Wealth Advisors

In the Australian market, falls of 10% occur (on average) every two years – and can occur even more frequently.

If you can avoid it? – Don’t Sell

Throughout my investing career, I have been a net buyer of stocks. Selling only to raise some cash, or to shift out of one stock into a (hopefully) better performing one. Things are much the same in retirement – Though I seem to be trading less.

I have structured my portfolio into a stable income pile and the more adventurous investment pile. My living expenses are easily covered from the dividends from the investments pile and income from the stable pile. So I never have to sell shares when their value is discounted during a correction (>10% fall) or a crash (>20% fall).

This way I can reap the benefits of long term growth in the sharemarket. The data from 97 years of following the S&P 500 Index with a balanced (60% shares:40% bonds/cash) portfolio shows that, over a 5-yr period, the portfolio will outperform inflation 84% of times by an average annual amount of 5.48%. Holding the portfolio for 15 years, it has been ahead of inflation by 5.33% on 97% of occasions. Slack Investor would take those odds.

Balanced Portfolio – Long-term returns over inflation (US) – From Bob French – Firstlinks

Not for the faint hearted, but you can (historically) get an increase to returns by taking on more risk with a 100% shares portfolio. When calculated over a 15-yr period, The S&P 500 has been ahead of inflation by 7.08% (average p.a.) on 95% of occasions.

S&P 500 Long-term returns over inflation – From Bob French – Firstlinks

In light of the above two tables, Slack Investor shows indifference to these corrections … be patient – you will be rewarded.

October 2023 – End of Month Update

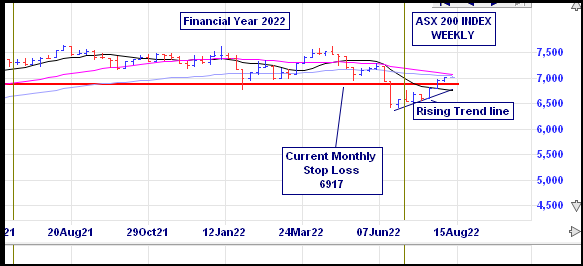
Slack Investor remains IN for the US Index S&P 500 and the FTSE 100. But is on SELL Alert for the Australian index shares – as the end of month stock price (6780) is below its monthly stop loss of 6917.

Slack investor is on SELL Alert for the ASX200 at October 31, 2023 due to a stop loss breach. I have a “soft sell” approach when I gauge that the market is not too overvalued. I will not sell against the overall trend – but monitor my index funds on a weekly basis.
Another negative month for Slack Investor followed markets (S&P 500 -2.2 %, and the FTSE 100 -3.8%, and the Australian stock market did the same (ASX 200 -3.8%).

All Index pages and charts have been updated to reflect the monthly changes – (ASX IndexUK IndexUS Index).

Financial Year 2023 Slack Results

“I believe in evidence. I believe in observation, measurement, and reasoning, confirmed by independent observers. I’ll believe anything, no matter how wild and ridiculous, if there is evidence for it.

Isaac Asimov – US Author and Biochemist

Good fortune has prevailed in FY 2023. After the tough investing year of FY2022, Slack Investor has stuck to his strategy of investing with growing companies that have an established earnings record and forward P/E ratios <50 (Mostly!). As always, there have been a few lapses, but that’s just part of being an investor.

I expect a bit of volatility in my (mostly “growth”) investment portfolio and I try to reassure myself that, despite the odd negative year in the Slack Investment Portfolio the Stable Income portfolio is doing its job and keeping Slack Investor with enough cash to keep things running. In the world markets, the FTSE 100 Total Return Index was up 7.8% (last FY up 5.7%). Dividends helped the Australian Accumulation Index to be up 10.6% for the financial year (last FY -7.5%). The S&P 500 Total Return Index is again full of optimism – and was up 19.7% (last FY -10.7%) for the same period. All of these Total Return Indicies include any accumulated dividends.

Slack Portfolio Results FY 2023

All Performance results are before tax. The Slack Portfolio is Slack Investor’s investment portfolio and, after the first negative year since starting this portfolio in 2010, I am delighted to be “Back in the Black” – with an annual FY 2023 performance of +17.9%. Full yearly results with benchmarks are shown in the table below.

FY2022 was another bumper year in real estate – particularly Brisbane -but there has been a welcome pause in housing prices for FY2023. For property, the actual falls in asset values is greater than that shown as Slack Investor is using the Total Return values supplied by CoreLogic. The Total Return is calculated from value change as well as the gross rental yield. I would have preferred calculations that include the net rental yield, but this will have to do. The Total Return is a more realistic figure when comparing real estate returns to stock market total returns, as it treats both asset classes as investments.

The share market was the place to be for FY 2023, with the Australian Share market Total Return Index (ASX200 Acc) up 10.6% and the Vanguard Diversified Growth ETF (VDGR), comprising mostly (68%) of International and Australian Shares, increasing by 11.2%. Inflation is again coming in big – with the CPI at +6.0% – reinforcing the need to have exposure to “growth assets” such as shares or property.

Yearly Performance (%) results since 2010

YEAR SLACK FUND MEDIAN BAL VGARD GROWTH ASX200Acc RES BRIS RES MELB CASH CPI
2010 6.6 9.8 12.3 13.1 10.8 26.9 4.2 3.1
2011 2.5 8.7 9.1 11.7 -2.4 0.9 4.4 3.7
2012 8.3 0.4 1.3 -6.7 1.3 -0.9 4.3 1.2
2013 26.5 14.7 18.6 22.8 7.7 8.3 3.2 2.4
2014 23.6 12.7 14.5 17.4 11.5 12.8 2.6 3.0
2015 2.4 9.6 11.8 5.7 7.7 15.6 2.5 1.5
2016 14.2 3.1 4.2 0.6 8.4 9.5 2.2 1.3
2017 19.5 8.1 8.8 14.1 6.5 17.7 1.9 1.9
2018 37.6 7.2 10.0 13.0 5.2 3.9 3.9 2.1
2019 19.7 6.2 9.8 11.5 1.7 -6.0 2.0 1.3
2020 9.4 0.3 0.6 -7.7 8.4 13.8 1.1 -0.3
2021 21.7 13.0 20.3 27.8 17.9 10.7 0.2 3.8
2022 -14.3 -2.5 -13.0 -6.5 25.6 3.1 0.3 6.1
2023 17.9 6.9 11.2 10.6 -4.1 -2.6 2.6 6.0

The Slack Fund yearly progress vs BENCHMARKS. The Median Balanced Fund (41-60% Growth Assets)Vanguard Growth FundASX 200 Accumulation IndexCorelogic Residential Property Home Value (Total Return) Index in both Brisbane and Melbourne, and Cash (Australian Super Cash Fund) and Consumer Price Index (CPI)

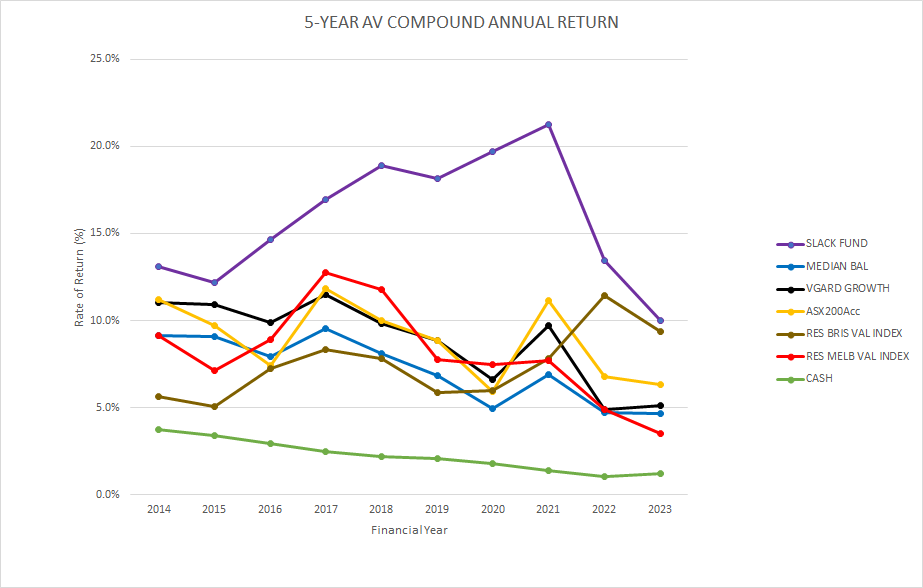
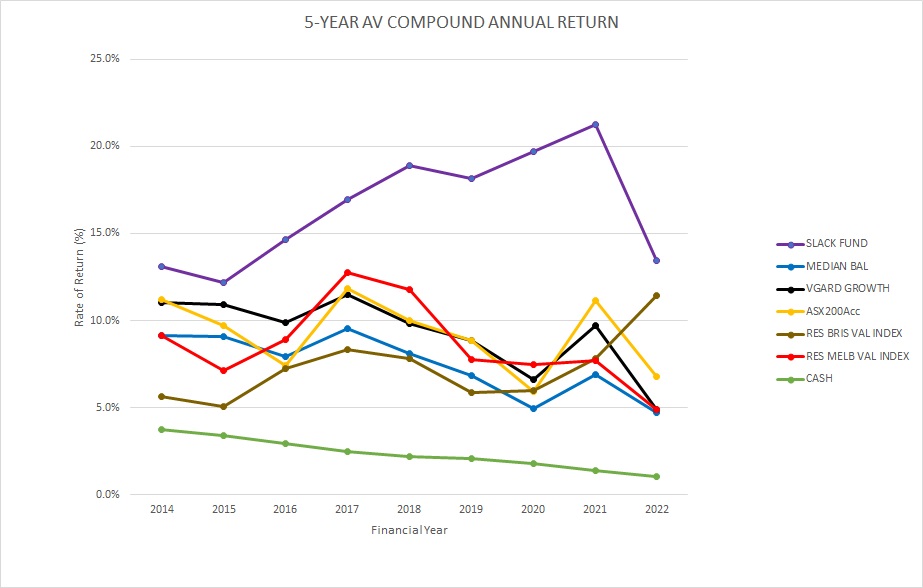
Although I collect yearly figures, the 5 and 10-year compound annual performance gives me a much better idea about how things are going and will smooth out any dud (or remarkable!) results. The Slack Fund is still ahead of Benchmarks – but currently being challenged by Brisbane Residential real estate over a five-year period.

5-yr Average Annual Performance
Slack Investor 5-year compound annual rate of return – compared to benchmarks – Click for better resolution.

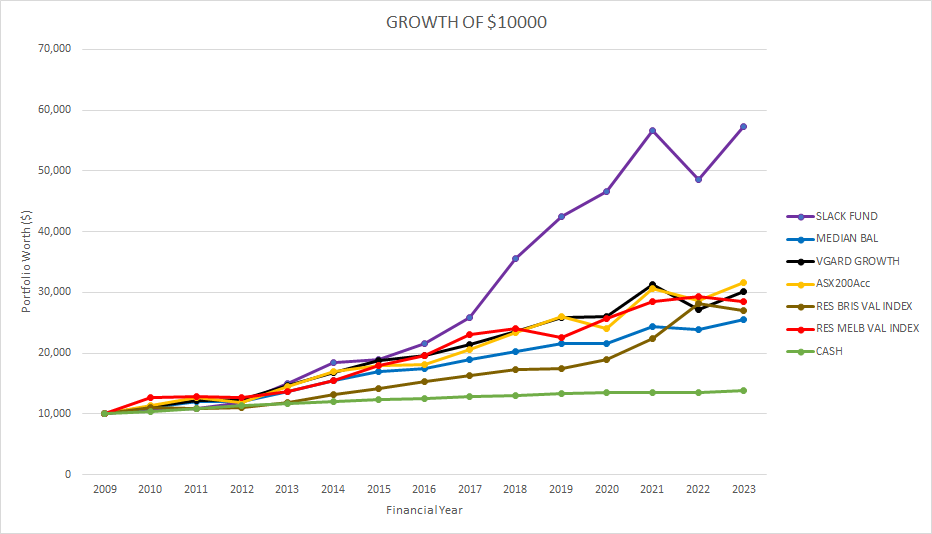
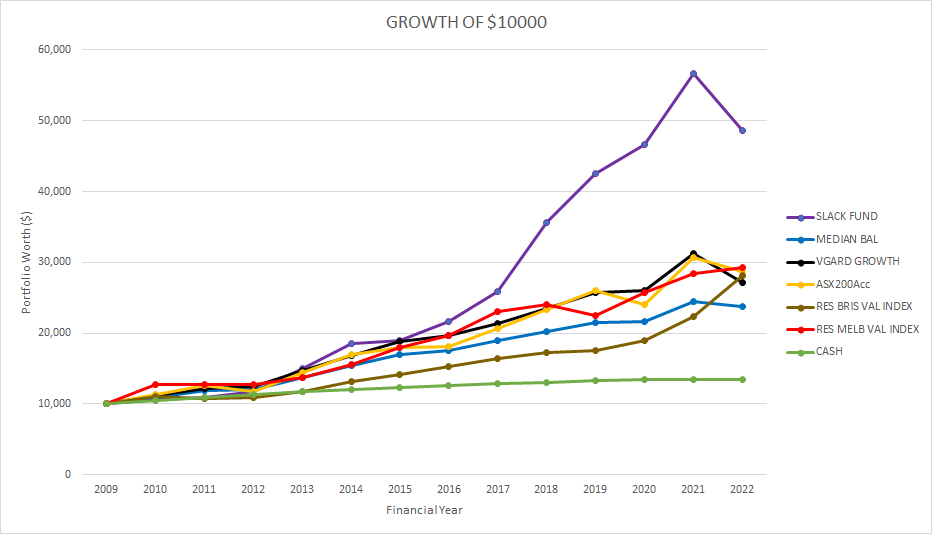
The beauty of compounding with a succession of good performance results can be seen in the chart below showing the growth of an initial investment in June 2009 of $10000.

Growth of a $10000 Investment Since 2009
The rate of growth of $10000 invested by Slack Investor in FY 2009 – compared to benchmarks – Click for better resolution.

10-year compound annual rate of return

The Slack Fund has been around a while and, at last, I am generating some long term data (10-year compound “rolling” annual rate of return). Over this time frame, the Slack Fund has been performing very well. A 10-year annual rate of return of over 14% – Go Slack Fund!

However, the 10-yr rates of return of the Median Balanced Fund, Vanguard Growth fund, ASX200, and residential property in Brisbane and Melbourne are also great long term investments, generating a 10-year compound annual rate of return of 6-9% p.a. From the figures below, although it can add stability to a portfolio, Cash as a long term investment, is a poor choice.

Average 10-yr compound yearly return

YEARSLACK FUNDMEDIAN BALVGARD GROWTHASX200AccRES BRISRES MELBCASH
2019 15.6 8.0  10.0 5.8 8.5 2.9
2020 15.9 7.0  7.8 5.5 7.3 2.6
2021 17.9 7.4  9.3 7.5 8.3 2.2
2022 15.2 7.1 8.1 9.3 9.9 8.7 1.8
202314.4 6.4 7.4 8.2 8.6 7.6 1.7

The Slack Fund average 10-yr compound yearly return vs BENCHMARKS. The Median Balanced Fund (41-60% Growth Assets)Vanguard Growth FundASX 200 Accumulation IndexCorelogic Residential Property Home Value (Total Return) Index in both Brisbane and Melbourne, and Cash (Australian Super Cash Fund) and Consumer Price Index (CPI)

FY2023 Nuggets and Stinkers and … July 2023 – End of Month Update

 Life is not a bowl full of cherries, there’s good and bad stuff 

Fuzzy Zoeller (American professional golfer)

Fuzzy Zoeller does not always say wise things, but his quote above is on the money. Slack Investor takes the good with the bad.

The trampoline effect of stinkers becoming nuggets in consecutive years reared again, with REA making the transition this year. Also, Nuggetsmight end on the Stinker pile the year after. Slack Investor puts more emphasis on growth over a multi-year period, but compiles the yearly Nuggets and Stinkers list …. because its fun!

Growth stocks (usually high Return on Equity (ROE >15%), as with other stocks, often have cycles of price – bouts of overvaluation followed by a period of undervaluation.

The percentage yearly returns quoted in this post include costs (brokerage) but, the returns are before tax. This raw figure can then be compared with other investment returns. I use the incredibly useful Market Screener to analyze the financial data from each company and extract the predicted 2o25 Price/Earnings (PE) Ratio, Dividend Yield, and Return on Equity (ROE), on the companies below. This excellent site allows free access (up to a daily limit) to their analyst’s data, on the financials tab for each stock, once you register with an email address.

Slack Investor Stinkers – FY 2023

Financial year 2023 was a welcome recovery in the technology sectors. All of Slack Investors followed markets Australia, the UK and the US having gains over the financial year 2023. However, Slack Investor is always ready for lessons in humility and still managed to pick up a few stinkers along the way.

Integral Diagnostics (IDX) -19% (Sold Oct 2022)

Integral Diagnostics | Medical Imaging Services | Australia | New Zealand

(IDX 2025: PE 18, Yield 3.8%, ROE 10%) Integral Diagnostics provides medical imaging services at a number of urban and regional locations in Australia and New Zealand. This company was also one of my stinkers last year (FY2022 -39%) The sinking feeling that I got during my monthly chart reviews was just too much … and I finally gave into that negative energy in October 2022 – and sold. This, unfortunately, turned out to be the bottom of the market – and IDX has made a modest recovery since.

Computershare (CPU) -18% (Sold May 2023)

(CPU– 2025: PE 16, Yield 3.8%, ROE 29%) Computershare is well known to owners of some Australian shares as they run the registry for many Australian companies. It started as an Australian technology business in 1978 and since has become a major global player in financial services. Slack Investor just bought at a bad time … and I sold in May 2023 to make another share purchase. CPU seems to be a solid global business though – Will look at buying this one again.

Dicker Data (DDR) -18% (Still held)

(DDR 2025: PE 14, Yield 6.8%, ROE 42%) Dicker Data is the only Australian owned and ASX-listed major IT provider. It is a hardware, software and cloud distributor for most of the well known US IT companies (Microsoft, Cisco, HP, etc). The business is projected to continue to grow and, as the share price seems to have “bottomed out”, Slack Investor will continue to hold on because of the companies excellent projected PE, Yield, and ROE.

BetaShares Asia Technology Tigers ETF -7% (Sold Sep 2022)

(ASIA – 2023: PE 17, Yield 2.6%,) Growth in Asia … What could go wrong! Plenty it seems. These “technology tigers” that make up this ETF have been part of a global selloff of tech-related shares in Asia since 2021 as many US investors take flight from the China market due to US/China tensions. 

This company was also one of my stinkers last year (FY2022 -33%) and was “on watch” during my monthly chart reviews. Sadly, the pain became too much and I unloaded near the bottom of the market again … and, it has since made a modest recovery. I have maintained at least some exposure to the Asian tech sector with with Vanguard FTSE Asia ex Japan ETF (VGE.ASX).

Slack Investor Nuggets – FY 2023

Nuggets made a comeback this Financial Year. Slack Investor continues to invest in high Return on Equity (ROE) companies with a track record of increasing earnings, Companies with these qualities sometimes behave as “golden nuggets”.

Technology One (TNE) +48%

(TNE 2025: PE 37, Yield 1.5%, ROE 34%) This Software as a Service (SaaS) and consulting company continues to be profitable. This great business was also a nugget last year (+17%). A high 2025 PE of 37 (Expensive) is a little scary but, if the high Returns on Equity (34%) remain, on balance, this is OK. I found this company through the writings of Rudi Filapek-Vandyck – a great Australian Investor and writer, when he talks, Slack Investor listens.

Altium (ALU) +40%

(ALU 2025: PE 34, Yield 2.3%, ROE 32%) Altium is an Australian based developer and seller of computer software for the design of electronic products worldwide. It focuses on electronics design systems for 3D printed circuit board (PCB) design. Slack Investor has part-owned this business since 2009 and has enjoyed the increasing value that ALU has created. This sector is very now … and remains a favourite of Slack Investor.

CarSales.com (CAR) +37%

(CAR 2025: PE 28, Yield 3.0%, ROE 10%) CarSales.com is the go to for selling cars, boats and other vehicles. It does, in an efficient way, what the classified ads used to do. I have noticed that the Return on Equity is dropping (Now 10%) and will keep this company on watch – but I cant argue with the recent price rises.

BetaShare NASDAQ 100 ETF (NDQ) +36%

(NDQ 2023: PE 26, Yield 1.0%) Exposure to the powerhouse of US Tech companies with the simplicity of an ASX ETF. Management fees are reasonable at 0.48% – Slack Investor remains a fan.

Pro Medicus (PME) +36%

(PME 2025: PE 78, Yield 0.6%, ROE 46%) Pro Medicus is a developer and supplier of healthcare imaging software and services to hospitals and diagnostic imaging groups. Slack Investor actually met the CEO and co-founder of Pro Medicus, Dr Sam Hupert, at an investment seminar last year. His modesty, US foothold, and debt-free approach to expanding his business impressed me – I’m obviously glad I bought in – but the very high PE ratio (+78) is worrying – expensive.

REA Group (REA) +30%

(REA 2025: PE 39, Yield 1.5%, ROE 29%) Like Carsales.com, REA has dominated the space left by the old newspaper classifieds in selling real estate in Australia. REA has expanded into India and other global locations. A high PE ratio (39) but while projected Return on Equity (ROE) remains high (29%), this is OK.

VanEck Wide Moat ETF (MOAT) +30%

(MOAT – 2023: PE 19, Yield 2.6%,) The Wide Moat ETF run by VanEck is a rules-based selection of “attractively priced US companies with sustainable competitive advantages” Sounds good doesn’t it. The management expense ratio of 0.49% is OK for such curated US exposure. 

Slack Investor Total SMSF performance – FY 2023 and July 2023 end of Month Update

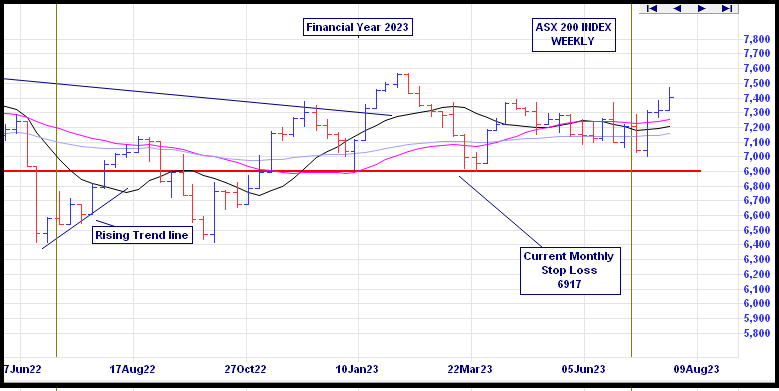
After a difficult 2022, FY 2023 is described by J. P. Morgan as being “kinder to balanced portfolios”. True That! The growth stocks that were punished last year bounced back strongly. In the Australian superannuation scene, the median growth fund (61 to 80% in growth assets) returned +9.2% for FY 2023. The ASX 200 chart shows a gradual climb for the financial year.

ASX 200 Weekly chart for FY 2023 – From Incredible Charts

After a tough FY 2022, the FY 2023 Slack Investor preliminary total SMSF performance looks like returning to form and coming in at around +18%. The 5-yr performance is a more useful benchmark to me – as it takes out the bouncing around of yearly returns. At the end of FY 2023, the Slack Portfolio has a compounding 5-yr annual return of around 10%.

The new financial year started of positively for Slack Investor markets. The ASX 200 + 2.9%; FTSE 100 +2.2%; and S&P 500 +3.1%. He remains IN for all index positions.

All Index pages (ASX IndexUK IndexUS Index) and charts  have been updated to reflect the monthly changes.

The Hubris Ark

Cathie Wood CEO of Ark Invest – from Observer

hubris: (noun) –  an extreme and unreasonable feeling of pride and confidence in yourself:

Cambridge Academic Content Dictionary

Cathie Wood is the CEO of Ark Innovation and is best known for her NASDAQ based flagship fund ETF (ARKK). She has been concentrating her bets on the “disruptive technologies,” such as artificial intelligence, genomics, blockchain and cryptocurrency, and clean energy. She is a big fan of Tesla and has made the prediction

Bitcoin will crack $1 million by 2030

Cathie Wood – The Street

Slack Investor is no seer … but at the October 14, 2022 price of 16240 USD, Bitcoin has quite a way to go to reach that mark. In the words of the great BBC TV character Sir Humphrey, this looks like a “very courageous” prediction Cathie!

The ARK Innovation ETF (Nasdaq: ARKK)

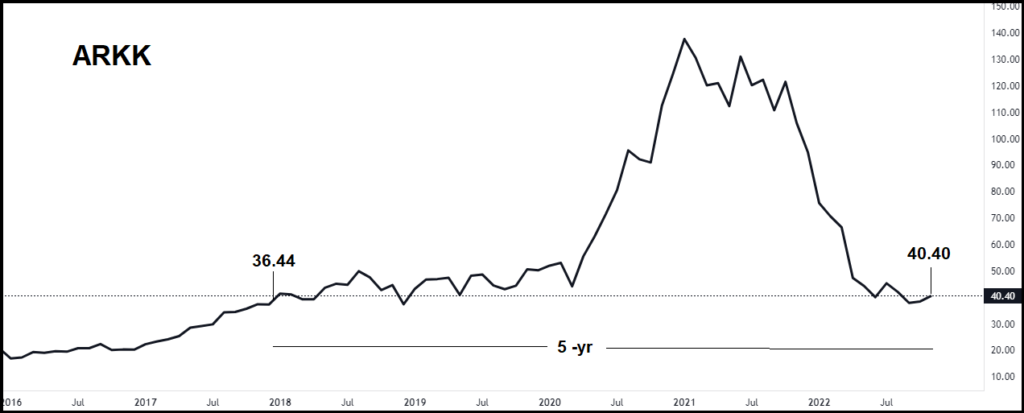
Wood, is a devout Christian, and has named her company after the sacred Ark of the Covenent. Cathie Wood is a household name in the US and has a huge number of loyal fans. Her funds had 60 billion USD under management at their peak. She was named by Bloomberg as Stock Picker of the Year in 2020 . The flagship ARKK fund gained a remarkable 152% in 2020, but since then, the performance has not been so stellar – ARKK is down 65% so far this year. In interviews, she often refers to her past success, and insists, over and over again, her performance should be judged over a five-year time horizon.

The Price chart of the ARKK ETF since 2017 –

Wood is nothing but confident. She hosts a monthly finance video – delightfully called “In the Know” and is a great defender of her fund. She sees “spectacular returns” for Ark Invest over the next five years. According to a recent article by New York magazine, her initial predictions for ARK Invest were annualized returns of 15 percent, “Now we think 50 percent.”

Slack Investor would agree that a 5-yr holding period is a good minimum to judge how a fund is performing – to allow for volatility and to allow growth stocks to grow. She might be right that tech stocks are undervalued at the moment. But let’s have a look at her results as a fund manager over the last 5 years. The total return of ARKK expressed as a compound annual growth rate (CAGR) since November 2017 was a not so impressive 3.5% when compared with other “no stock picking” index funds.

InstrumentValue Nov 2017Value Nov 20225-yr CAGR
ARKK36.4443.313.5%
NASDAQ 100 TR71591388114.2%
S&P 500 TR5212840710.0%
FTSE 100 TR651075643.1%
ASX 200 TR56486811027.5%
Based upon the 5 years preceding November 2022, the compound annual growth rate (CAGR) of various Total Return (TR) index values compared with the ARKK ETF (including dividends since Nov 2017 of $2.91 USD). These TR calculations include dividends. Data from Yahoo Finance and CAGR calculations from CAGRCalulator

Cathie Wood conducted a recent session at a Morgan Stanley event in Sydney. where she maintained her bullish outlook. According to the Financial Review, the fund manager essentially argued it’s the market that’s got it wrong, not her!

Slack Investor is far more humble … he “takes his licks” when times are bad – doesn’t “crow” when times are good – and is mostly wary when a new “stock guru” emerges.

In the stock market, volatility is the price he has to pay for being involved with long-term asset growth.

November 2022 – Mid-Month Update

This image has an empty alt attribute; its file name is trend-1445464__180.jpg

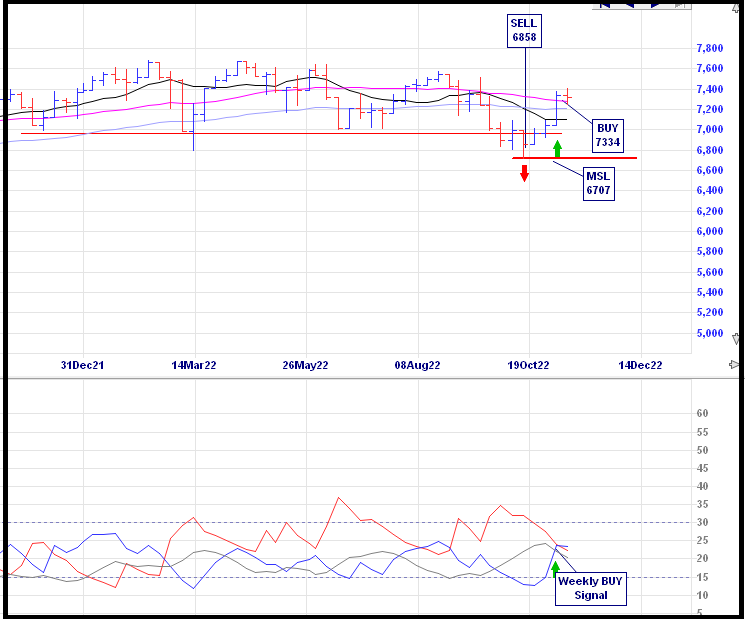
My small-scale, and often very frustrating, market timing experiment continues until its projected end in 2024. On a weekly signal for the FTSE 100 from the momentum following Directional Movement system. I have bought back into the UK index. I am back now to fully invested in the ASX IndexUK IndexUS Index.

The buy signal can show itself as a downward dip in the trend strength indicator ADX (grey line) of the lower panel below. There are many ways of setting up this Directional Movement system. Slack Investor likes the “smoothing” that is enabled by a system that looks back over the previous 11 periods – but the complexities are best left for the Resources page.

FTSE 100 Weekly chart showing a BUY signal on the Directional movement Index weekly chart. The weekly price ranges are at the top and Average Directional Movement Index (ADX) patterns below – From Incredible Charts

The Index page has been updated for the  UK Index. 

Let’s Lay a Few Bricks … and Mid-Month Update

A 1999 extract from The Sydney Morning Herald showing a 13-yr old Chris Brycki – smartcompany.com.au

Slack Investor will admit to being less than young … but I am still capable of being a “Fan boy” when I see something impressive happening in the financial world.

After a series of schoolboy stock picking successes – winning the ASX’s Share Game a remarkable 3 times and, at university, he entered the JP Morgan Trading Competition, which he also won several times. The talented Chris “the Brick” Brycki, launched into a career with stockbrokers and financial houses. After a while, he started to question the long term performance of fund managers.

“… The problem is that over time, even by being right, the value added is not big enough to counteract the 1% fee that a lot of these fund managers charge.”

Chris Brycki – Stockspot – Livewire

Chris founded Stockspot in 2013 as an alternative way to invest. Their Robo Advice model offers a low-cost automated alternative to traditional fund managers and advisors. After a simple online survey to determine your investing stage and risk tolerance, an investment portfolio type is recommended to you.

Stockspot Building Blocks

Chris, founder and CEO of Stockspot, in 2020 – From smartcompany.com.au

Chris (and Stockspot) have come up with the breathtakingly simple, yet genius (Both Slack Investor and Donald Trump have a loose definition of genius), strategy. After researching thousands of ETF’s and, based on exposure, performance and low fee costs – Stockspot has selected just 5 of them as the building blocks for a range of different portfolios. The portfolios are based on risk tolerance, financial situation and the investor’s appetite for volatility. The five component ETF’s are in Australian Shares (VAS), Global Shares (IOO), Emerging Global Markets(IEM), Australian Fixed Income (IAF), and Physical Gold (GOLD).

ETFSymbol (ASX)1-yr PerformanceGrowth since InceptionManagement Fee
Vanguard Australian Shares IndexVAS-7.92%8.25%p.a (13+ years)0.10%p.a.
iShares Global 100 IOO-4.43%7.37%p.a. (15+yearsr)0.40%p.a.
iShares MSCI Emerging MarketsIEM-20.59%7.18%p.a.(19+ years)0.69%p.a.
iShares Core Composite BondIAF-11.42%2.73%p.a.(10+ years)0.15%p.a.
ETFS Physical GoldGOLD+7.34%7.75%p.a.(19+ years)0.40%p.a.
The five ETF’s that Stockspot use to build their portfolios (1-yr Performance is to 13Oct 2022) – most of these ETF’s have a $500 minimum if you are investing directly.

It is best to disregard the above 1-yr performance – It has just been a bad year for most assets. The ETF management fees are low (depending on ETF complexity), there is good long term performance (Growth since Inception) and they have selected Physical Gold for inclusion.

Slack Investor does not naturally lean into Gold as it is a speculative, non-income producing asset. However, I might have to change my mind here. The reason Stockspot include Gold in all their portfolios is based upon historical data and the way gold tends to outperform in times of crisis. The results in this last year performance of +7.34% for Gold, speak for itself – as other asset classes flounder.

Mixing it all up

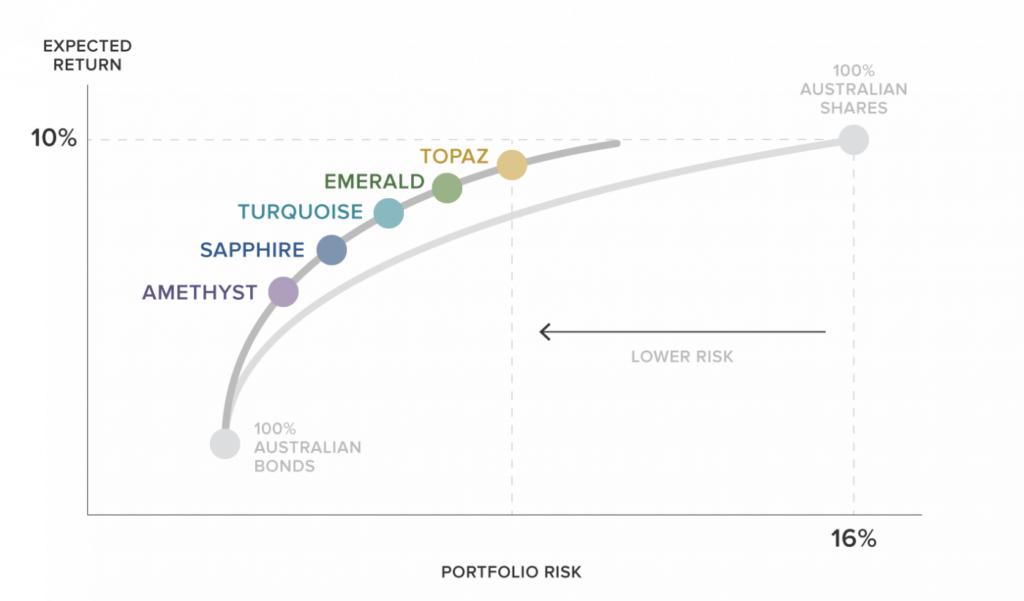
Slack Investor has written about Stockspot before in terms of Robo Advice and their valuable Superannuation reports. By using these 5 ETF’s in various combinations, Stockspot is able to give their customers a combination of returns and risk at a relatively low cost. There are even sustainable versions of each of the below portfolios available. As an example, the moderately conservative Sapphire portfolio is constructed with the following portions.

VAS: 27.2%
IAF: 35.2%
IEM: 14.4%
IOO: 7.9%
GOLD: 14.8%

A chart showing relative risk and return (grey line) of a portfolio varying between 100% Australian Bonds and 100% Australian Shares. The Stockspot portfolios have historically yielded lower returns than 100% Australian Shares) – but only slightly in their most aggressive Topaz portfolio. Overall, through their diversification, the portfolios represent much lower risk.

After fees, over a 5-yr period, Stockspot has outperformed 99% of similar funds over 5 years.

AMETHYST
Conservative
SAPPHIRE
Moderately conservative
TURQUOISE
Balanced
EMERALD
Growth
TOPAZ
High growth
3.1% p.a4.8% p.a5.3% p.a6.1% p.a6.8% p.a
5-yr annual performance (After Fees) – to 30 September 2022 – From Stockspot

There are fees involved for Stockspot to manage your money. For a balance of $200000, they amount to 0.66%. At first blush, these fees (on top of the ETF fees) sound a bit steep to Slack Investor. However, for all types of investors, with a time horizon of at least 3-5 years, for a stress-free place to put your money, this might be exactly what they are looking for. Stockspot do a tailor-made portfolio construction, all the re-balancing of assets and, they take care of all brokerage costs – Not Bad! They even have zero management fees for children accounts up to $10,000 (for under 18s) and the ability to dollar cost average with regular top-ups.

Stockspot does not earn fees from or have a commercial relationship with the ETFs we recommend. We don’t pay professionals for recommending our service to their clients.

Stockspot

Slack Investor can think of lots of situations where people would like a decision-free, low-fee, diverse investment that is designed to grow in the long term. Well done Chris Brycki (and Stockspot), for advancing the investing cause with particular attention to keeping the fees down … you are a Slack Investor Hero.

October 2022 – Mid-Month Update

This image has an empty alt attribute; its file name is trend-1445464__180.jpg

Despite the above discussion, my small-scale market timing experiment continues until its projected end in 2024. My frustration with this experiment continues – as it often goes against one of Slack Investors firm beliefs. If you can avoid it – Do not sell an asset when it is undervalued. Using historical CAPE values, at the end of September 2022, the UK Index (FTSE 100) was 13% below its long term mean, the US Index (S&P 500) was 9% above its long term mean, and the Australian Index (S&P 500) was 7% below its long term mean.

At the end of September 2022, Slack Investor was on SELL ALERT for Australian index shares (ASX 200), the US Index (S&P 500) and the UK Index (FTSE 100). Each of them had broken through their monthly stop loss.

 I have a “soft sell” approach when I gauge that the market is not too overvalued. I generally will not sell against the overall trend but monitor my index funds on a weekly basis once the monthly stop loss has been triggered.

Well … I can see no obvious up-trend at the end of the week for the US and UK markets and will exit at the end of week price of 3583 for the S&P 500 and 6858 for the FTSE 100. I am still just hanging in with the ASX 200 as they had a strong finish to the week.

The Index pages and charts  have been updated for the  UK Index and US Index. 

Financial Year 2022 Slack Results

“When you can measure what you are speaking about, and express it in numbers, you know something about it. ”

Lord Kelvin (William Thomson, Mathematician and Physicist, 1824-1907)

Slack Investor reflects on a tough investing year. I have mostly “stuck to my guns”  investing with growing companies that have an established earnings record and forward P/E ratios <50. There have been a few lapses (e.g. XRO) which had a forward PE ratio of about 100 when I bought it last financial year … and, I paid the price when the higher interest rates and threats of inflation caused a rapid change in valuation of most tech stocks.

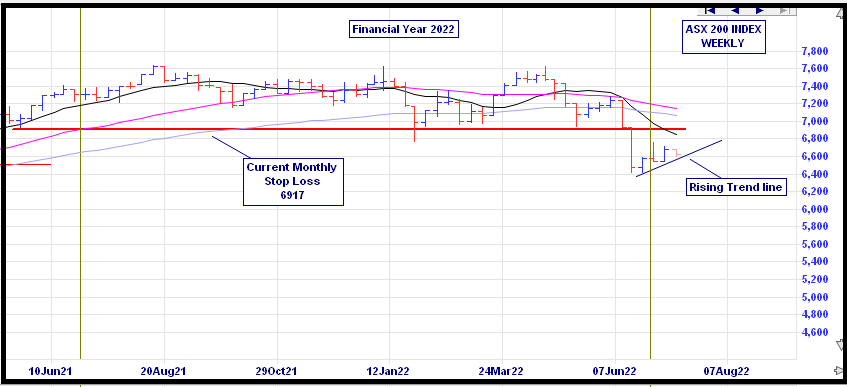
I expect a bit of volatility in my mostly “growth” investment portfolio and I try to reassure myself that, despite the odd negative year in the Slack Investment Portfolio the Stable Income portfolio is doing its job and keeping Slack Investor with enough cash to keep things running. In the world markets, the FTSE 100 Total Return Index was up 5.7% (last FY down 13.8%). Dividends helped the Australian Accumulation Index to be down 7.5% for the financial year (last FY +27.8%). The S&P 500 Total Return Index took a breather at last – and was down 10.7% (last FY up 36.4%) for the same period. All of these Total Return Indexes include any accumulated dividends, wheras the chart below of the ASX 200 for FY 2022, just shows stock prices.

The ASX 2oo Weekly chart for FY 2022- Dividends helped stem the losses for FY2022, but the ASX Accumulation Index is still down 7.5% for the FY – Incredible Charts – Click for better resolution.

Slack Portfolio Results FY 2022

All Performance results are before tax. The Slack Portfolio is Slack Investor’s investment portfolio and it had its first negative year since its establishment in 2010 – with an annual FY 2022 performance of -14.3%. Full yearly results with benchmarks are shown in the table below. It was a challenging year for all of my benchmarks that were exposed to sharemarkets (Median Balance Fund -2.5%, Vanguard Growth Fund -13.0%, ASX 200 Accumulation -6.5%).

Slack Investor seems to be clueless in real estate predictions … I have thought for some years that there must be a sizable correction soon – as the prices are still stratospheric in Melbourne and Sydney compared to incomes. The correction may still yet happen as interest rate rises are yet to take their toll.

The Brisbane real estate market was the place to be for FY 2022 (+25.6%) on top of a big year last year!) – Inflation was also a suprise for the challenged Slack Investor – with the CPI at +6.1%.

YEAR SLACK FUND MEDIAN BAL VGARD GROWTH ASX200Acc RES BRIS RES MELB CASH CPI
2010 6.6 9.8 12.3 13.1 10.8 26.9 4.2 3.1
2011 2.5 8.7 9.1 11.7 -2.4 0.9 4.4 3.7
2012 8.3 0.4 1.3 -6.7 1.3 -0.9 4.3 1.2
2013 26.5 14.7 18.6 22.8 7.7 8.3 3.2 2.4
2014 23.6 12.7 14.5 17.4 11.5 12.8 2.6 3.0
2015 2.4 9.6 11.8 5.7 7.7 15.6 2.5 1.5
2016 14.2 3.1 4.2 0.6 8.4 9.5 2.2 1.3
2017 19.5 8.1 8.8 14.1 6.5 17.7 1.9 1.9
2018 37.6 7.2 10.0 13.0 5.2 3.9 3.9 2.1
2019 19.7 6.2 9.8 11.5 1.7 -6.0 2.0 1.3
2020 9.4 0.3 0.6 -7.7 8.4 13.8 1.1 -0.3
2021 21.7 13.0 20.3 27.8 17.9 10.7 0.2 3.8
2022 -14.3 -2.5 -13.0 -6.5 25.6 3.1 0.3 6.1

The Slack Fund yearly progress vs BENCHMARKS. The Median Balanced Fund (41-60% Growth Assets)Vanguard Growth FundASX 200 Accumulation IndexCorelogic Residential Property Home Value Index in both Brisbane and Melbourne, and Cash (Australian Super Cash Fund) and Consumer Price Index (CPI)

However, the five-year compound annual performance gives me a much better idea about how things are going and will smooth out any dud (or remarkable!) results. The Slack Fund is still ahead of Benchmarks – but currently being challenged by Brisbane Residential real estate.

Slack Investor 5-year compound annual rate of return – compared to benchmarks – Click for better resolution.

The beauty of compounding with a succession of good performance results can be seen in the chart below showing the growth of an initial investment in June 2009 of $10000.

The rate of growth of $10000 invested by Slack Investor in FY 2009 – compared to benchmarks – Click for better resolution.

10-year compound annual rate of return

The Slack Fund has been around a while and, at last, I am generating some long term data (10-year compound “rolling” annual rate of return). Over this time frame, the Slack Fund has been performing very well. A long-term annual rate of return of over 15% – Go Slack Fund!

However, the 10-yr rates of return of the Median Balanced Fund, Vanguard Growth fund, ASX200, and residential property in Brisbane and Melbourne are also great long term investments, generating a 10-year compound annual rate of return of at least 7% p.a.

YEARSLACK FUNDMEDIAN BALVGARD GROWTHASX200AccRES BRISRES MELBCASH
201915.68.010.05.88.52.9
202015.97.07.85.57.32.6
202117.97.49.37.58.32.2
202215.27.18.19.39.98.71.8
The Slack Fund 10-year compound annual “rolling” rate of return – compared to benchmarks- The Median Balanced Fund (41-60% Growth Assets)Vanguard Growth FundASX 200 Accumulation IndexCorelogic Residential Property Home Value Index in both Brisbane and Melbourne, and Cash (Australian Super Cash Fund). The Vanguard Growth Fund was established in 2012 and has only just been able to generate a 10-yr rate of return.

Lifting the gaze … to a beautiful place

Earth  Australia  planet earth satellite view  SKU 0099 image 1
An “enhanced” satellite view of eastern Australia incorporating an “exaggerated relief” technique to emphasize the topography. The mountains of PNG and Indonesia are on the horizon.

It serves an investor well to occasionally lift themselves away from the day to day stresses of the world – and the trials of owning a share portfolio!

ASX 200 – The Australian Index

My previous post outlined a few of the difficulties of market timing and my decision to be tentatively out of the Australian Index according to my “market timing rules”. I also try not to trade against the market trend … and I would not sell while the weekly chart was looking positive.

ASX200 Weekly Chart FY 2022 – Incredible Charts

So far this has been the case, with the weekly chart just above the rising trend line. I will sell if the ASX200 is below the trend line and still below the stop loss at the end of the week. This gets to one of the problems of market timing – you can set up the most definitive strategy that will give you an objective selling point – but my heart is not in it as Slack Investor believes that the ASX 200 represents reasonable value at the moment. I am actually looking forward to the end of my 20-year market timing experiment – even though it does have the useful purpose of giving Slack Investor something to do in a market downturn.

Lifting the gaze

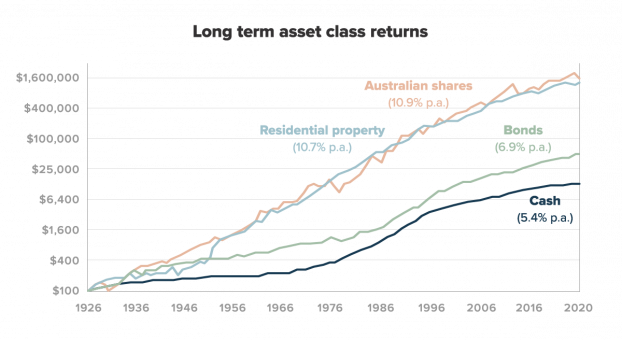
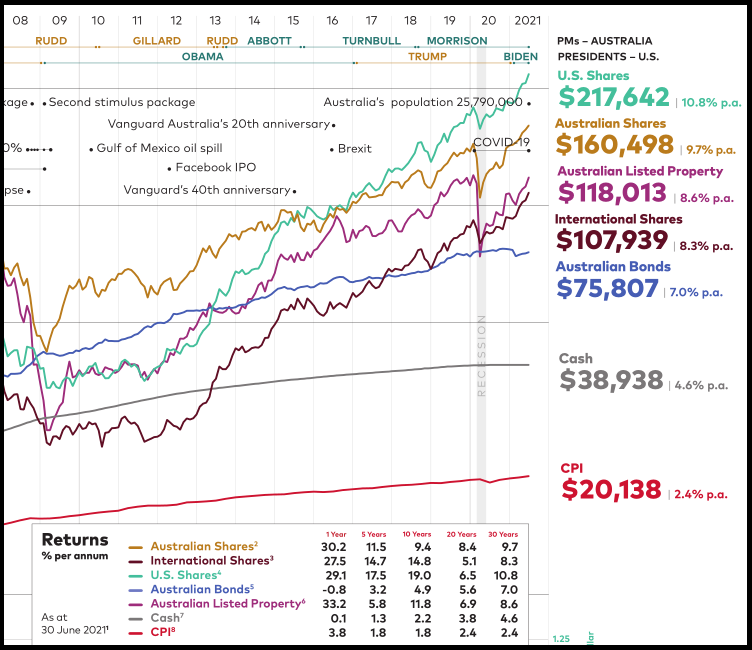
My absolute favourite way of lifting the gaze is to look at the Vanguard Asset Index chart over a long period. However, a later version than 2021 isn’t due out till mid August 2022 – so I have just shown last years version. The Long term asset class returns chart shown below – in a logarithmic scale, show that the asset classes of Residential Property and Australian shares – are the only really worthwhile games in town. When things just get too much in the day to day trading world – just sit on the couch and gaze in wonder at these two charts … and then perhaps doze off.

The importance of Australian shares in your portfolio | Stockspot
Long term Asset returns 1926-2020 – From Stockspot

Extract from the 2021 Vanguard Index chart (Just the 2008-2021 portion) – the dollar values on the right are the results of investing $10000 in index funds in each asset class for 30 years (since July 1991). – Check out the full glory of the Vanguard 2021 PDF chart – Click for better resolution.