A few times a year, Slack Investor likes to take a snapshot of the markets using the Cyclically Adjusted Price to Earnings ratios (CAPE) which use ten-year average inflation-adjusted earnings. I first started using CAPE as a “value” tool in September 2021, and my most recent look was in May 2023.
By plotting this CAPE over a period of time, we can look at how the whole sharemarket is currently valued in terms of historical data – this way we can track the whole share market as it oscillates between overvalued and undervalued.
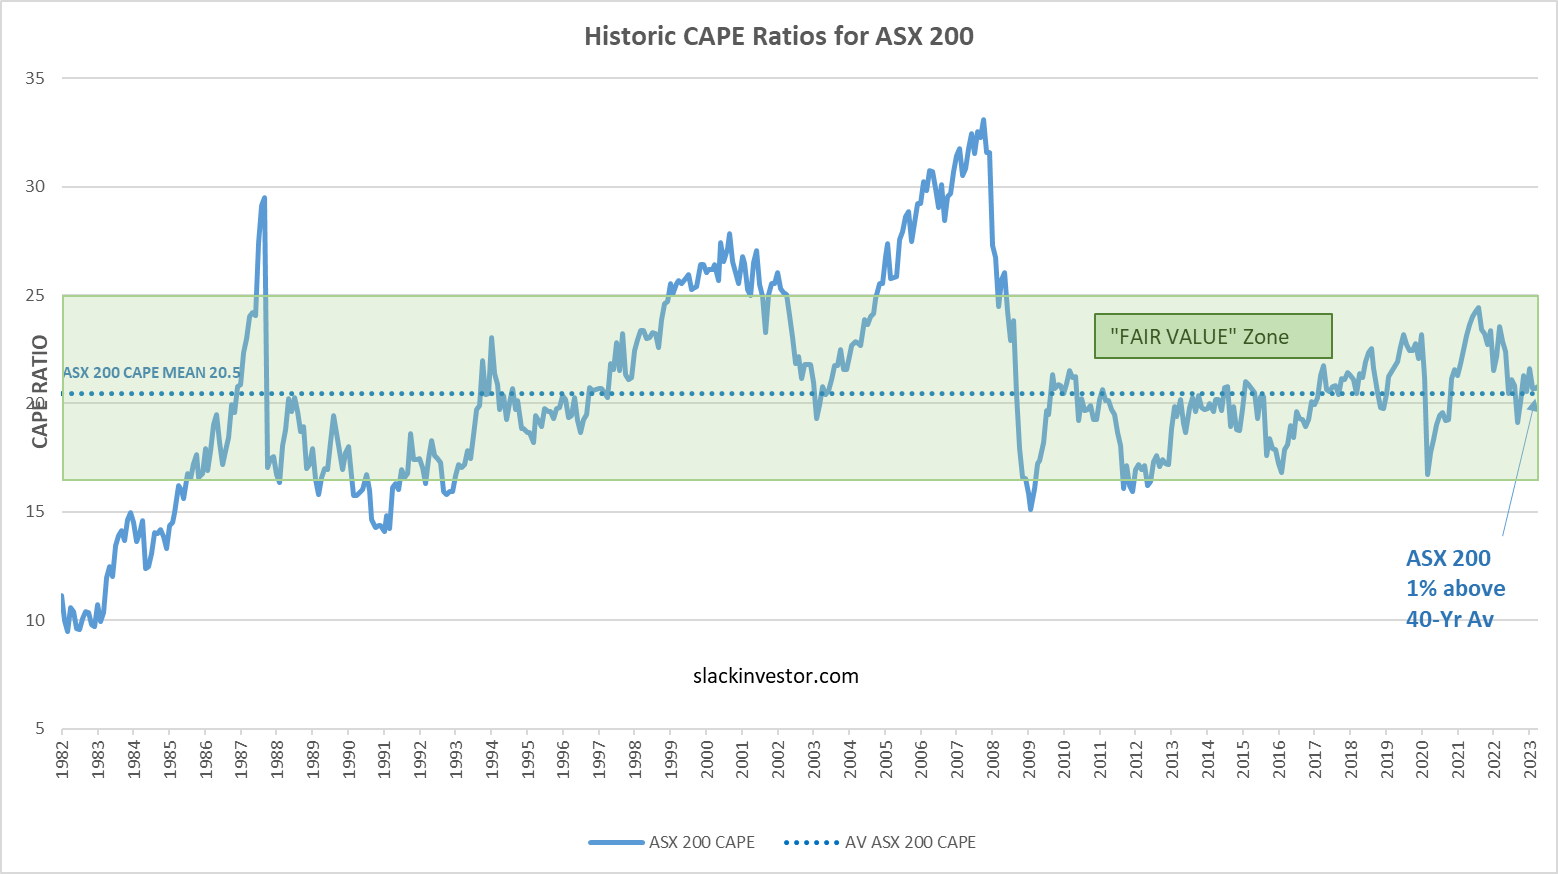
Using monthly CAPE data from Barclays, the 40-yr mean is calculated and plotted together with the CAPE values. A “fair value” zone is created in green where the CAPE is within one standard deviation of the mean (average).
ASX 200 Value
Historic CAPE ratios for the ASX 200 – From 1982 to end of October 2023– Click the chart for better resolution.
FTSE 100 Value
Historic CAPE ratios for the FTSE 100 – From 1982 to end of October 2023– Click the chart for better resolution.
S&P 500 Value
Historic CAPE ratios for the S&P 500 – From 1982 to end of October 2023– Click the chart for better resolution.
At the end of October 2023, both the ASX 100 (8% below the 40-yr average) and the FTSE 100 (15% below the 40-yr average) are “ON SALE”. If I have a choice, I will always look to buy in the sale period.
The S&P 500 still looks a little overvalued at 16% above the 40-yr average – but at least it has slipped back into the “Fair Value” zone.
In the world of stock markets, a 10% decline from a previous peak is known as a “Correction”. Never a nice time … but Slack Investor recommends that you just put on the big pants and get used to these things. Corrections are just part of the landscape of investing in shares and Slack Investor has often written about them – and theneed to roll with them – if you are using stock markets to better your financial position.
On average, the (US) market declined 10% or more every 1.2 years since 1980, so you could even say corrections are common.
Throughout my investing career, I have been a net buyer of stocks. Selling only to raise some cash, or to shift out of one stock into a (hopefully) better performing one. Things are much the same in retirement – Though I seem to be tradingless.
I have structured my portfolio into a stable income pile and the more adventurous investment pile. My living expenses are easily covered from the dividends from the investments pile and income from the stable pile. So I never have to sell shares when their value is discounted during a correction (>10% fall) or a crash (>20% fall).
This way I can reap the benefits of long term growth in the sharemarket. The data from 97 years of following the S&P 500 Index with a balanced (60% shares:40% bonds/cash) portfolio shows that, over a 5-yr period, the portfolio will outperform inflation 84% of times by an average annual amount of 5.48%. Holding the portfolio for 15 years, it has been ahead of inflation by 5.33% on 97% of occasions. Slack Investor would take those odds.
Not for the faint hearted, but you can (historically) get an increase to returns by taking on more risk with a 100% shares portfolio. When calculated over a 15-yr period, The S&P 500 has been ahead of inflation by 7.08% (average p.a.) on 95% of occasions.
In light of the above two tables, Slack Investor shows indifference to these corrections … be patient – you will be rewarded.
October 2023 – End of Month Update
Slack Investor remains IN for the US Index S&P 500 and the FTSE 100. But is on SELL Alert for the Australian index shares – as the end of month stock price (6780) is below its monthly stop loss of 6917.
Slack investor is on SELL Alert for the ASX200 at October 31, 2023 due to a stop loss breach. I have a “soft sell” approach when I gauge that the market is not too overvalued. I will not sell against the overall trend – but monitor my index funds on a weekly basis.
Another negative month for Slack Investor followed markets (S&P 500 -2.2 %, and the FTSE 100 -3.8%, and the Australian stock market did the same (ASX 200 -3.8%).
All Index pages and charts have been updated to reflect the monthly changes – (ASX Index, UK Index, US Index).


