Altium (ALU)- Thanks, so sad to see you go … and March 2024 – End of Month Update

Renesas CEO Hidetoshi Shibata (left) and Altium CEO Aram Mirkazemi (right) firming up the takeover deal – From Business News Australia.

It is with very mixed feelings that Slack investor reports on the likely takeover of Altium (ALU) – one of his major holdings (16.6% of total Portfolio) – by the Japanese Renesas Electronics Corporation.

Renesas will acquire all outstanding shares of Altium for a cash price of A$68.50 per share, representing a total equity value of approximately A$9.1 billion

Altium Press Release – February 15, 2024

Although this represents a tidy profit, as I first bought into Altium about 10 years ago when they were trading at $3.30, I will be genuinely sad to stop being a shareholder of this wonderful company. I envisaged holding Altium shares for a very, very, long time!

Slack Investor’s 10-yr journey as an Altium shareholder – Monthly price chart from incrediblecharts.com – click chart for better resolution

Why I originally bought into Altium?

Let’s get this straight, Slack Investor is no stock picking genius. My portion of profitable sold shares is only about 55%. That is, I have made losses on 45% of them – it is not that impressive! – but my overall performance results are good.  This is because I follow the Peter Lynch philosophy – where you try to stay in the stocks that are performing well and “weed out” the stocks that are not doing well.

“Some stocks go up 20-30 percent – and they get rid of it and hold onto the dogs. And it’s sort of like watering the weeds and cutting out the flowers. You want to let the winners run.”

Peter Lynch – Legendary Investor and Fund Manager. From 1977 until 1990, he ran the Magellan fund where he averaged a 29.2% annual return for those years.

Slack Investor is always on the lookout for growth companies … and Altium poked up its head and looked at me in 2014 from one of the financial sites that I read. The next step is a bit of independent research. My “go to” here is the most excellent Market Screener site. I went through my usual process for buying and checked the Market Screener/Financials tab for a reasonable projected Price/Earnings ratio, an established record of improvement in earnings, and a forecast Return on Equity (ROE) above 15%. Altium stood out here with no debt and a ROE of between 35 and 50. This company was growing!

After my initial purchase, I bought more parcels of ALU over the next two years as the shares continued to grow and their outlook projections were confirmed.

The Altium Story

Altium is an Australian-based software company that provides electronics design software to circuit-board engineers. These circuit boards are in every bit of technology that we own.

By the time Slack Investor had woken up to the Altium story, Aram Mirkazemi was the established CEO of Altium Limited. He came to Australia from Iran as a refugee in the 1980’s after a 6-month stint in a refugee camp in Pakistan. He did not speak English. After gaining qualifications in IT and engineering, he met Nick Martin, the founder of Altium, at a soccer game and Nick offered him a job. After an eventual falling out, Aram left to start his own software company. When Nick steeped down as CEO, Aram returned to Altium with a vision to make Altium a world player in printed circuit board design.

… in order to be able to change the way the electronics industry works you need to be able to standardise on one platform, like the graphics industry did with Photoshop or Microsoft’s dominance of the operating system and productivity tools market.

After several years of growth and gaining market share. The Altium board rejected an offer of $38.50 per share from Autodesk Inc back in June 2021 as they thought that the offer ‘significantly undervalues’ the companies prospects. The 2024 Renesas offer is yet to be approved by shareholders, but it seems that all the significant players are already “on board”. The offer A$68.50 per share in cash. represents a premium of approximately 34% to the pre-offer price.

All I can say is, it has been an honour to be part-owner (shareholder) of this great company – Thank you Aram and his team. I will be selling part of my holding this tax year (to spread the capital gain over two tax years) and wait for the cash offer to come through in 2025 for the remainder.

March 2024 – End of Month Update

More Happy Days in the stock market. As the troubled world marches on, all Slack Investor followed markets rose this month. The ASX 200 up 2.6%, the FTSE 100 up 4.2%, and the S&P 500 up 3.1%,

Slack Investor remains IN for the FTSE 100, the ASX 200, and the US Index S&P 500.

All Index pages and charts  have been updated to reflect the monthly changes – (ASX IndexUK IndexUS Index). The quarterly updates to the Slack Portfolio have also been completed.

Super, a home, and the Pension … a fruity mix! – and February 2024 – End of Month Update

Even Superman has his limits – Is it Kryptonite OR Brussell Sprouts?

Slack Investor writes a lot about Superannuation because it is a fantastic component to have in your armoury to establish financial independence – in a tax-effective way.

The ultimate aim for Slack Investor is to fund your own retirement, but in reality, according to the Association of Superannuation Funds of Australia (ASFA) estimates, a minority (43% ) of Australians of retirement age would be self-funded by 2023 – this percentage should increase as the compulsory superannuation system matures.

On 31 March 2023, 63% of the population aged 65 and over were receiving the aged pension (full or part), or other government-funded income support.

As so many Australians rely on a mix of both their super and the aged pension for retirement, it is worth revisiting the perverse ways in how superannuation interacts with the pension under the Assets test devised in 2017.

Your own Home

Before we get to this mix, by the time you retire, you do want to have a place to live and be free of landlords. This may sound impossible to some at the moment – but it is a vital part of financial independence. It can be a “tiny home”, an apartment, a place in a regional area …. as long as it is yours!

Tiny Homes – This 20 sq m little bewdy will set you back $32 000 – however, you still have to find land for it – and connect to services.

It is so important to aim to own your own home by the time that you retire – even if it is a 1-br apartment. Admittedly, this is so much harder than it used to be! Looking at the figures below, it is vital to get as large a home deposit as you can to reduce your borrow amount – this should be one of your early financial goals. However, without help, a multi-bedroom home near a capital city now seems near impossible.

If you dont have a deposit, October 2023 data showed that Australians need an income of more than $300,000 a year to buy a median priced home. Household incomes required were considerably less, but still “eye watering”, for outer suburbs and regional cities. e.g. Geelong $243,333, Brisbane $223,333. Apartments are usually less expensive – and require less income to service the home loan.

Things are really bad at the moment for future home owners. It was assessed that for the home market to “affordable” home prices needed to be on average 3.0 times the average median income. Currently, Australia’s housing market has a median multiple of 9.1! I am hoping that future governments will adopt policies that will reduce house prices – But I am not holding my breath.

Super and the Aged Pension

At its most basic level, superannuation is forced retirement savings for all working Australians. A compulsory contribution of 11.5% of your salary (from 1 July 2024) that will compound till your preservation age (between 55 and 60).

According to Treasury projections, about 60% of retirees will have less than $250 000 in super in 2024. This amount of super is not enough to fund a comfortable retirement. $250 000 in pension mode at the official Age 67 drawdown rate of 5% generates only $12 500 income per year. Clearly, many Australians will need to rely on a mix of their super and the aged pension for retirement income. The Aged Pension is available to Australians over 67 – but, it is means tested.

The bare minimum to aim for is the “sweet spot” in the aged pension asset test where your assets are a bit more than the maximum allowed for the full pension. Under current rules (2024), home owning couples can have $451 500 in assets (singles $301 750) and still qualify for the full government aged pension (at age 67).

In 2020, the Alliance for a Fairer Retirement System pointed to a super sweet spot of around $400,000, which can see a pensioner (home-owning) couple “earning $1,000 a month more than a couple with $800,000 in savings.”

Nicola Field (Using data for 2020/21)- Canstar

The first chart shows 20 different amounts of superannuation that you might have saved up by the time you are ready to retire – ranging from $150 000 to $1 100 000 above chart – from saveoursuper.org.au.

This next chart is far more interesting, it shows your total income from different amounts of superannuation (shown in the above table) mixed with the aged pension – for a home owning couple. For simplicity, these tables assume your only non-home assets are in super and the aged pension rates were those applicable in 2021 ($34 777 per couple). The essence of the table is still valid.

Total amount of retirement income – for a home owning couple – Combination of Part-Aged Pension (orange) and 5% of Superannuation Balance (Blue) for each of the 20 amounts of Superannuation Balance shown in the first chart (Using data for 2020/21)- saveoursuper.org.au

Bizarrely, there is a point on the total retirement-income (couple) table corresponding to around $400 000 in assets/super where an increased assets/super balance does not lead to an increased total income due to the asset test pension taper rate. Above that point, for those on the part-pension/super mix, the more super you have, your total income actually goes down. This strange anomaly exists for assets/super between $400 000 and $800 000 (2021/2020 data).

Clearly, the current assets test to qualify for the aged pension is unfair and provides a disincentive to save -and should be changed. But, until then, a major retirement goal is to use your super to get your total assets to near the sweet spot before you reach age 67.

(It)is not fair that people who forgo consumption and save more to increase their living standards in retirement and reduce their reliance on an Age Pension should instead get less retirement income. This is the perverse outcome for a large range of savings under the 2017 assets test.

Jack Hammond and Terrence O’Brien – saveoursuper.org.au

How the Assets test works (in real life) for the aged pension (2024 Data)

According to Services Australia, for the aged pension, assets are property or items you or your partner own in full or part – this does not include your home! It does include Financial Investments (Bank accounts, shares, managed funds, annuities, etc), Personal assets (Home contents and vehicles), Superannuation and Real Estate.

I had a recent example of filling in an assets form for a close relative. Her bank statements and investments were easy to quantify. We were advised that personal assets should be valued according to what we could get if we were “keen sellers”. It was suggested to us that, other than vehicles, most peoples personal effects would amount to between $5000 and $10 000. This proved to be near the mark as most furniture and home items end up having to be donated when finalizing a deceased estate.

For the table below, the aged pension and asset limits are current values* and correct at February 2024. Using 2024 data, the “sweet spot” for assets is now near $451 500 for couples ($301 750 for singles). If you had $250 000 in super, and your “other assets” added up $60 000 (Car $13 000, Bank Ac’ts/Shares/Funds $35 000, Home Contents $12 000). Your Total assets would be $310 000.

For a couple with similar “other assets” and a combined super of $400 000, your total assets would be $460 000.

SituationAsset LimitOther Assets*SuperDrawdown from Super @ 5%Age PensionTotal Income
Single Home-owner$301 750$60 000$250 000$12 500$28 514$41 014
Couple Home-owner
(Combined)
$451 500$60 000$400 000$20 000$42 988$62 988
Table based on a single home-owner with $310 000 total assets ($60K + $250K) and a couple home-owners with $460 000 total assets ($60K + $400K) – using Feb 2024 values for the Aged Pension and Asset Limits.

Using this mix of super and the pension, when reaching the pension qualifying age , a modest to comfortable retirement is possible under current rules when you own your own home. Also, under the Work Bonus Rules, singles can earn up to $5304 (Couples $9360) in a part-time job without affecting their aged pension.

Comfortable lifestyle (p. a.)Modest lifestyle (p. a.)
Couple $71,723Couple $46,620
Single $50981Single $32,417
ASFA calculated annual retirement requirements for those aged 65-84 (September quarter 2023) for both “comfortable” and “modest” lifestyles

February 2024 – End of Month Update

Slack Investor is IN for Australian index shares, the US Index S&P 500 and the FTSE 100.

Little movement this month for the ASX200 (+0.2%) – but, it is testing new all-time highs. Nothing happening with the FTSE 100 (0.0%) at the moment.

The S&P 500 (+5.2) and the NASDAQ 100 are hitting new record highs and Slack Investor is pleased to go with the momentum but remains nervous for these markets.

All Index pages and charts have been updated to reflect the monthly changes – (ASX IndexUK IndexUS Index).

2023 – Hope You Were Strapped In …  and January 2024 – End of Month Update

From Boredpanda.com

Slack Investor usually just assesses stock market returns at the end of the financial year. However, calendar year 2023 was some ride.

The 2023 ASX 200 Chart

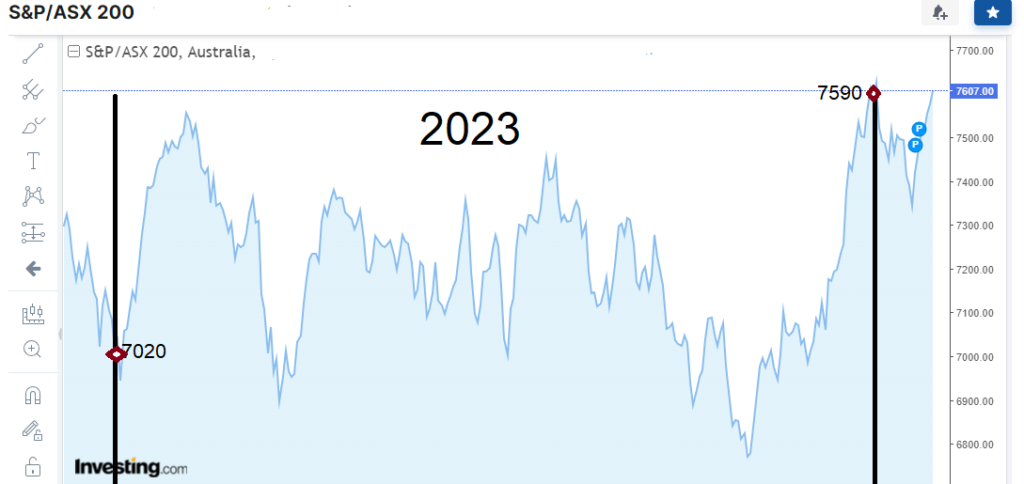
For the 2023 calendar year, the ASX 200 Index started at 7020, and ended up at 7590 – a 12-mth increase of about 8% – but, on the way, it fell to a year low of 6751 – a temporary fall of 3.8%.

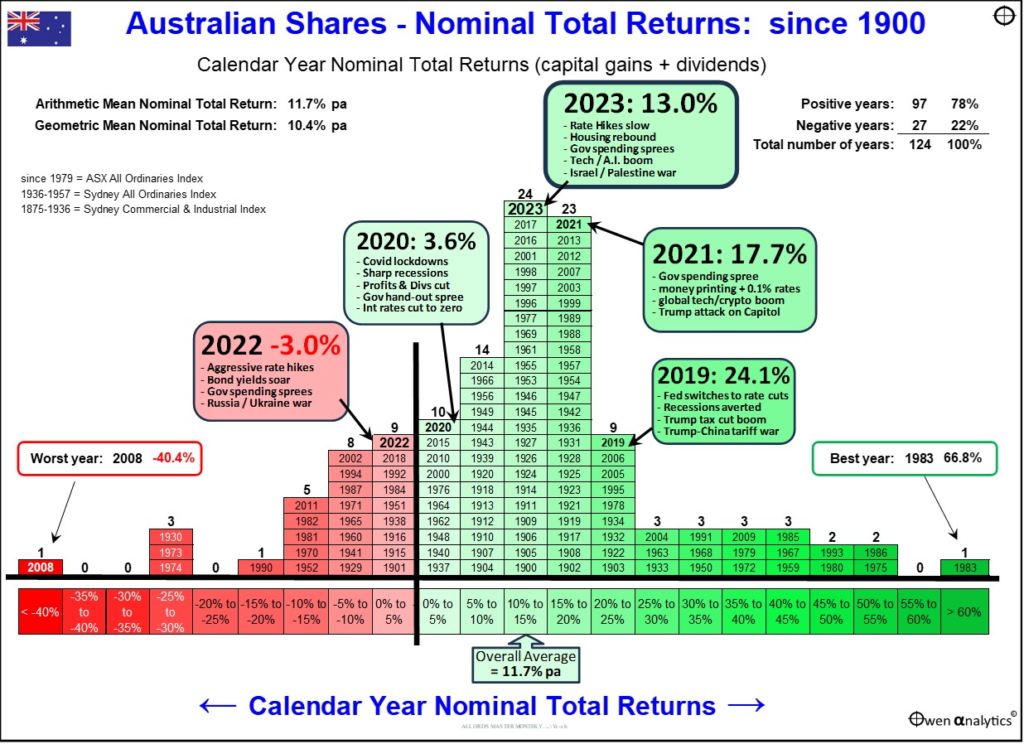
Of course, If you did not look at the charts daily, these fluctuations would mean nothing. If you ony looked at the Australian Index at yearly intervals, 2023 would probably bring some joy. As well as the overall 8% gain for the year, when you include dividends, the ASX 200 Index total return for calendar year 2023 was 12.2%. The ASX “All Ordinaries” Index (Tracking Australia’s largest 500 listed companies) had a total return of 13.0%.

Slack Investor will again emphasize the joy of investing and mostly doing nothing – and trying to focus on longer term returns. One of the best summary charts I have seen for a while that shows calendar year returns has just been updated and published by Ashley Owen. Ashley uses the “All Ordinaries” Index rather than the ASX 200 Index- as there is more historical data available for comparison.

Total ASX “All Ordinaries” calendar year returns – with the the last 5 years highlighted – From Ashley Owen – Owen Analytics – (Click to Enlarge)

The first thing that jumps out in this chart is the amount of “Green” positive years vs the “Red” negative years. In 78% of calendar years, ASX Index returns are positive. The overall average total return since 1900 for the Australian “All Ordinaries” Index is 11.7%.

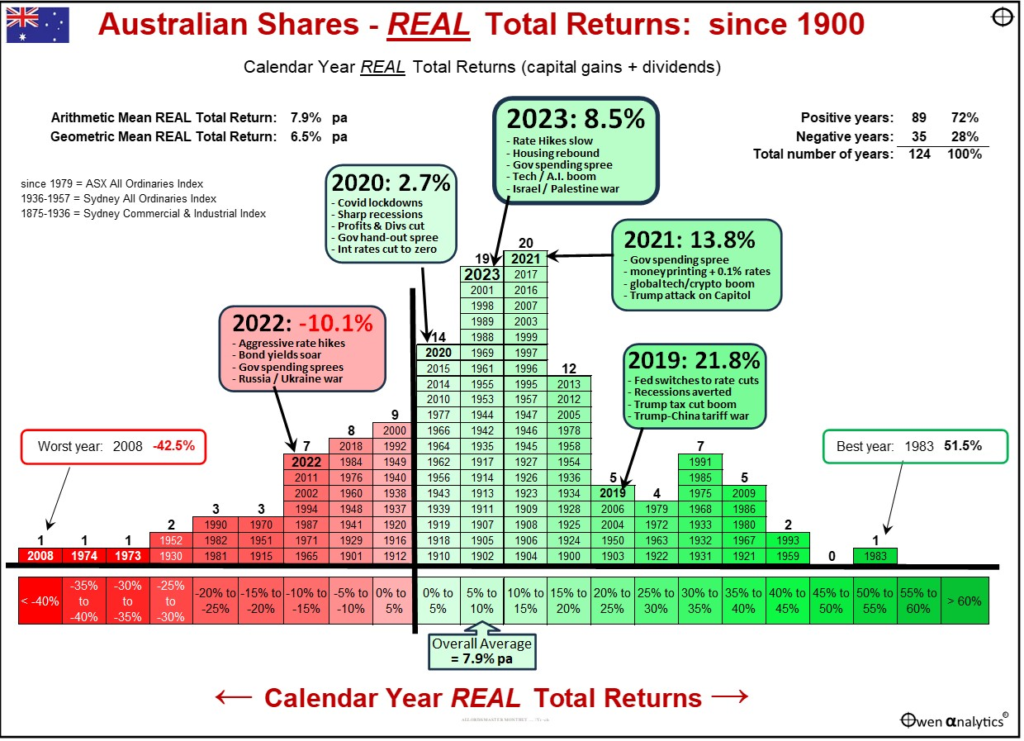
Inflation has been the topic of the day lately and Owen has kindly provided his calendar year chart in terms of Real Returns for the All Ordinaries Index – The total return minus the inflation rate (Consumer Price Index (CPI)). A certain amount of cash is worth holding to for liquidity – so that you can avoid selling stocks in a market downturn. Although cash can iron out some of the stock market fluctuations, being invested in cash is not a protection from inflation.

Total ASX “All Ordinaries” calendar year “Real” (minus inflation) returns – with the the last 5 years highlighted – From Ashley Owen – Owen Analytics – (Click to Enlarge)

Adjusted for cpi increases, the overall average “Real” total return since 1900 for the Australian “All Ordinaries” Index is 7.9%. Slack Investor is willing to put up with the volatility of share markets for an average “after inflation” return like this.

For financial independence and as a hedge against inflation, it is important to own growth assets – such as the Australian Share market. Sure, there will be the occasional negative annual returns ahead … but let’s not worry about this while the Australian stock market is rising. Long-term overall results are the important thing.

January 2024 – End of Month Update

Slack Investor is IN for Australian index shares, the US Index S&P 500 and the FTSE 100.

After a big Christmas Rally, things have settled down a bit with modest gains for the ASX 200 (+1.2%) and the S&P 500(+1.6%). The FTSE 100 had a small fall ( -1.3%)

It was time to adjust the stop loss for the S&P 500 as the current value is over 15% greater than the stop loss. Slack Investor has long believed the US market is overvalued and, while enjoying the journey, is happy to have his stop loss a little tighter. It is difficult to do the adjustment on the monthly chart, so I had a look at the weekly chart for the S&P 500 below. I am looking for a dip in the chart that represents a “Higher low”. The new stop loss now stands at 4682 – only 3% below the current value.

Extract from the S&P 500 weekly chart – From Incrediblecharts.com

All Index pages and charts have been updated to reflect the monthly changes – (ASX IndexUK IndexUS Index).

Sacrifice

The Self-sacrifice of a father – Jacques Sablet (French, 1749–1803)

Slack Investor likes a bit of old art – and a picture that tells a story really floats my boat. But firstly, a bit of recognition to the fabulous Artvee site that gathers public domain files of artworks from around the world from galleries and museums.

This Jaques Sablet oil painting depicts a father returning home with a bandaged arm – where he reveals some loaves of bread to his hungry family. He has previously allowed a trainee surgeon to extract his blood in exchange for money.

Not suggesting a blood sacrifice is required these days for a loaf of bread – but a form of sacrifice that could help you on your journey to financial independence is Salary Sacrifice.

Salary Sacrifice

The key to tax-effective salary sacrifice is for the employee to take some of their remuneration in the form of concessionally taxed benefits instead of taking it all as fully assessable salary. 

H&R Block

Australia has a progressive tax system that steps up at critical income values. The advantages of salary sacrifice are that you are buying a benefit in pre-tax dollars in an arrangement with your employer – who takes out the money before you see it. For example, if you sacrifice some of your pre-tax salary for superannuation contributions – instead of being taxed at your marginal rate, you are being taxed at the superannuation contributions rate of 15%. There is a tax saving.

Australian Residents Personal Tax Rates 2023-2024
Taxable incomeTax on this income
0 – $18,200Nil
$18,201 – $45,00019c for each $1 over $18,200
$45,001 – $120,000$5,092 plus 32.5c for each $1 over $45,000
$120,001 – $180,000$29,467 plus 37c for each $1 over $120,000
$180,001 and over$51,667 plus 45c for each $1 over $180,000

The above rates are from the Australian Tax Office (ATO) and do not include the Medicare levy of 2%. There are defined things that you can “sacrifice” and pay for with pre-tax dollars. They include car expenses (loan, running costs and parking) and superannuation.

Salary Sacrifice For Superannuation

Slack Investor has always been a good saver and would save up and pay cash for a second-hand car rather than getting a car loan. The benefits of sacrificing salary for a car were small without the a car loan element. I did however see the advantages in sacrificing part of my salary for superannuation.

United Global Capital (UGC) provide the case study for worker William aged 45 who plans to retire in 20 years. He was given a pay rise of $5,000, bringing his total salary to $90,000 pa. Rather than pocket the gain, he uses the pay rise to boost his retirement savings and salary sacrifices the extra $5,000 salary into super each year

By using this strategy, he’ll sadly have less take home pay ($3275), but he will save on tax and have an extra $975 in the first year to invest into super, when compared to receiving the $5,000 as after-tax salary (see Table 1).

The real benefits are in the disciplined automatic saving of $5000 per year and the magic of compounding over 20 years. If he continued to salary sacrifice this amount into super, this could lead to William having an additional $228,500 in his super after 20 years (see Table 2).

From United Global Capital (UGC)

You can enter your own salary details using the Industry fund salary sacrifice calculator.

There is also another advantage of salary sacrifice – for getting into the property market using the Australian Government First Home Super Saver Scheme. It has some complexity and form filling – but it does allow you to load up your super with salary sacrificing and then withdraw up to $50 000 from your super as a first home deposit.

There are drawbacks to salary sacrifice … the main one being that even though there is an overall benefit to your wealth position – it is not realised till you retire and start using your superannuation – this may be many years away. Your overall take-home pay will immediately reduce – which is a tough ask in these higher prices times.

Slack Investor is no stranger to delayed gratification and loves to automate his savings … so salary sacrificing to super was a good strategy for me and my partner. There was always competition for funds with paying off my home loan – and, I never got to using the maximum amount allowed for salary sacrificing per year (Currently $27 500 per year) … but it was always my aim.

Salary sacrifice was a worthwile element in the Slack Investor path to financial independence.

Looking Forward Looking Back …  and November 2023 – End of Month Update

Usually not much of a country and Western Fan, but Slack Investor is quite taken with this video of Slim Dusty in his rendition of Looking Forward Looking Back – where two Australian Music Legends (Don Walker and Slim Dusty) combine to make this beautiful Australian song. Slim must have been about 73 when this song was recorded in the year 2000.

Making sense of what I’ve seen
All the love we’ve had between
You and I, along the track
Looking forward, looking back

Looking Forward Looking Back – Don Walker (composer) (1951 – ) & Slim Dusty (vocals) (1924 – 2003)

This song is bitter-sweet to me as it was played at a good friend’s funeral … and I always get a little sad .. but then, I think of the good times I shared with my friend. My friend was also a keen investor and, I’m sure he wouldn’t mind me using this song to launch this post. It is a song of reflection … with a reminder to look forward as well.

Slack Five-Year Individual Share Performance

Though Slack Investor reports on his results on a yearly basis, the annual Nuggets and Stinkers post is a constant reminder of how, in successive years, a company can be “a nugget” … or “a stinker”. The market will often go in trends of overvaluation followed by a period of undervaluation – and the true measure of how the stock has performed is lost in these constant tidal changes. For my purposes (Slack!), a 5-yr measure of performance is about right – as this allows for the true performance of a quality stock to shine through.

I trawled through the Slack Portfolio to find stocks that I had owned for 5 years. I was suprised to find that, of my current 22 individual stocks or ETF’s that I own, I had held only 5 of these for 5 years. This is not what I expected from a Slack Investor and I had to drill down into the portfolio to realize that I had given my portfolio a big shake-up about 4-5 years ago. I had retired, injected a large portion of my work super into my SMSF, and also sold a few stocks to make way for a house purchase.

The 5 stocks that I had 5-yr data on were Altium, Macquarie Group. REA Group, CSL and Codan. The 5-yr Internal Rate of Return (IRR) figures give an “average” annual return for the 5-yr period and include dividends as well as any stock price growth. The results below, for the five years up to 30/06/23, are from my financial software – the free “Sunset” international version of Microsoft Money  Australian Version. There are IRR calculators and Compound Annual Growth Rate (CAGR) calculators also available online. I have also included the CAGR Total Return (TR) till 30/06/23 for each of the Slack followed markets (in bold) for reference.

StockSymbol5-yr IRR
Altium LtdALU14.8
Macquarie Group LtdMQG12.7
S&P500 (TR) 12.2
REA Group LtdREA11.3
CSL LtdCSL8.4
ASX200 (TR) 6.3
FTSE100 (TR) 3.8
Codan LtdCDA3.3

Digesting the above table, Slack Investor is generally pleased with the annual IRR over 5 years of the majority of held stocks. The exception is Codan (CDA) which has had a roller coaster ride in the price charts (see below) – and underperformed the ASX 200 index over 5 years. This stock needs further evaluation to see if I should continue to hold it in the Slack Portfolio.

There are strange days
Full of change on the way
But we’ll be fine, unlike some
I’ll be leaning forward, to see what’s coming

Looking Forward Looking Back – Don Walker (composer) (1951 – ) & Slim Dusty (vocals) (1924 – 2003)

I go to Market Screener Financials page for Codan to quickly see that the income for CDA is projected to increase for the next few years and the company is in a solid financial position. The projected Return on Equity (ROE) remains above 15% and, despite the dramatic price fall during 2021/2022 over earnings downgrades, the companies price trend so far in 2023, has been positive. This holding is currently on “watch” – but I remain a holder of CDA for now.

5-yr Price Chart of Codan (CDA) – from Investing.com

November 2023 – End of Month Update

Slack Investor is IN for Australian index shares, the US Index S&P 500 and the FTSE 100.

Due to a strong rebound this month Slack investor has cancelled his SELL Alert for the ASX200 that started at October 31 2023 due to a stop loss breach – and he now remains IN .

All Slack Investor overseas followed markets had a bumper month. The S&P 500 led the way with a massive rise of +8.9 %. More modest rises for the FTSE 100 +1.6% and the Australian stock market – the ASX 200 +4.5%.

All Index pages and charts have been updated to reflect the monthly changes – (ASX IndexUK IndexUS Index).

Corrective Lens and … October 2023 – End of Month Update

From Zeiss.com

Last week, the ASX 200 has moved into correction territory to its lowest point since October 2022. Both the S&P 500 and the NASDAQ Index are already in technical corrections. The FTSE 100 is faring marginally better, down around 9% from its recent peak in February 2023.

In the world of stock markets, a 10% decline from a previous peak is known as a “Correction”. Never a nice time … but Slack Investor recommends that you just put on the big pants and get used to these things. Corrections are just part of the landscape of investing in shares and Slack Investor has often written about them – and the need to roll with them – if you are using stock markets to better your financial position.

On average, the (US) market declined 10% or more every 1.2 years since 1980, so you could even say corrections are common.

For the S&P500 – Covenant Wealth Advisors

In the Australian market, falls of 10% occur (on average) every two years – and can occur even more frequently.

If you can avoid it? – Don’t Sell

Throughout my investing career, I have been a net buyer of stocks. Selling only to raise some cash, or to shift out of one stock into a (hopefully) better performing one. Things are much the same in retirement – Though I seem to be trading less.

I have structured my portfolio into a stable income pile and the more adventurous investment pile. My living expenses are easily covered from the dividends from the investments pile and income from the stable pile. So I never have to sell shares when their value is discounted during a correction (>10% fall) or a crash (>20% fall).

This way I can reap the benefits of long term growth in the sharemarket. The data from 97 years of following the S&P 500 Index with a balanced (60% shares:40% bonds/cash) portfolio shows that, over a 5-yr period, the portfolio will outperform inflation 84% of times by an average annual amount of 5.48%. Holding the portfolio for 15 years, it has been ahead of inflation by 5.33% on 97% of occasions. Slack Investor would take those odds.

Balanced Portfolio – Long-term returns over inflation (US) – From Bob French – Firstlinks

Not for the faint hearted, but you can (historically) get an increase to returns by taking on more risk with a 100% shares portfolio. When calculated over a 15-yr period, The S&P 500 has been ahead of inflation by 7.08% (average p.a.) on 95% of occasions.

S&P 500 Long-term returns over inflation – From Bob French – Firstlinks

In light of the above two tables, Slack Investor shows indifference to these corrections … be patient – you will be rewarded.

October 2023 – End of Month Update

Slack Investor remains IN for the US Index S&P 500 and the FTSE 100. But is on SELL Alert for the Australian index shares – as the end of month stock price (6780) is below its monthly stop loss of 6917.

Slack investor is on SELL Alert for the ASX200 at October 31, 2023 due to a stop loss breach. I have a “soft sell” approach when I gauge that the market is not too overvalued. I will not sell against the overall trend – but monitor my index funds on a weekly basis.

Another negative month for Slack Investor followed markets (S&P 500 -2.2 %, and the FTSE 100 -3.8%, and the Australian stock market did the same (ASX 200 -3.8%).

All Index pages and charts have been updated to reflect the monthly changes – (ASX IndexUK IndexUS Index).

Alphabet … Google It

Sundar Pichai, the CEO of Google and its parent company Alphabet looks ready to play the “evil genius”.

At around 15% of my investments, Alphabet (US:GOOGL) is a major holding in my portfolio. It is my biggest international holding. I first dipped into the stock back in 2019 and have been trying to top up (in small amounts) each year since.

From pcriver.com

Since Larry Page and Sergey Brin launched Google in 2004 with a killer search engine, the many tentacles of Google/Alphabet have spread into the everyday life of billions. Youtube alone had 2.6 bn annual users in 2022.

(Google’s search and advertising) is Alphabet’s best business, accounting for 80% of Google’s total revenue in 2022 including Google Search and other properties like Google Network ads and YouTube. The remaining 20% comes from Google Cloud (9.4%) and its apps, hardware and content businesses (10.4%).

From Intelligent Investor

Why keep investing in Alphabet?

Before any investment decision, Slack Investor will do a bit of research. Market Screener has a Financial page on each stock.

From Market Screener

When the income chart looks like the above showing a track record of growth (prior to 2023) – and projected further growth up to 2025 – I’m interested. A look now at Slack Investors favourite finance indicators. A projected Return on Assets (ROE) of 24.5 in 2025 (well above 15%), a 2025 predicted PE ratio of 17.5 (very low for a growth stock), and plenty of cash on hand for further aquisitions – it all looks good.

Nitpicking

Despite admiring the skill of Alphabet management in aquisition and company growth, Slack Investor is not enamoured with everything this company does. There are some things that I find annoying. Back in 2017, they sudddenly dropped their popular Google Finance Portfolio feature. Slack Investor then migrated to Yahoo Finance to keep track of his portfolio. I note that Google Finance has recently reinstated its porfolio feature – but I have already moved.

To keep growing revenue, many of their channels are being further monetized. I love using Youtube for music, entertainment, and the millions of helpful “how to” guides. However, the ads at the start of the clips are tedious. This is an attempt to get people into Youtube (no ad) Premium at $13.99 per month.

I also had a recent battle to reduce the amount of data in my google account (Photos, Google Drive, gmail) to below the 15 Gb free limit. This is deliberatly not a simple process and seems to be designed to push people into more storage through a subscription starting at $2.49 per month.

These are relatively small quibbles though – and Slack Investor really doesn’t expect “something for nothing”. I continue to hold and a happy buyer of this company using an international e-broking account with CMC Markets – Alphabet, I hope, will be a very long-term holding.

Vanguard 2023 Annual Long term Investing chart  and … August 2023 – End of Month Update

Whether it has been a good investing year – or a bad one, August is the time when the Vanguard long-term (30 yr) investing chart lands. It is a timely reminder that whatever is happening in the short term, investing for the long term (> 5-10 yr) in International and Australian shares will compound your wealth. Anyone with a steady income that exceeds their living expenses can do this – so, what a young Slack Investor would do, is Automate his investments, through platforms such as StockspotPearlerVanguard Personal, or Raiz) … and “Get Cracking!”

Extract from the 2023 Vanguard Index chart (Just the 2007-2023 portion) – the dollar values on the right are the results of investing $10000 in index funds in each asset class for 30 years (since July 1993) – Check out the full glory of the Vanguard 2023 chart in PDF format – Click image for better resolution.

The lessons of long term investing

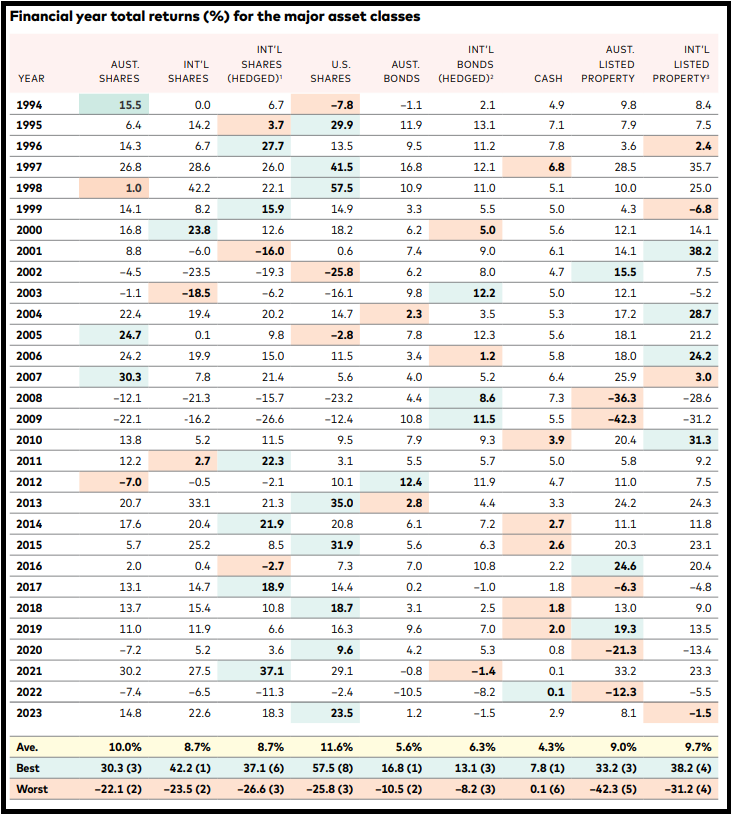
Every year Vanguard publish their performance data on each asset class. Slack Investor looks forward to this – as it demonstrates the powerful compounding that happens when the appreciating asset classes of Shares and Property are held for a long time (30 years). Although this Vanguard collection of data shows the volatility of asset values in the short term – it also also emphasizes the joys of holding and accumulating shares or property for long periods of time. These asset classes have steadily increased in value over the last 30 years. $10000 invested in Australian Shares in 1993 would have compounded to $138 778 in 2023, US Shares would have compounded to $176 155. Staying in Cash would have yielded $34 737.

Slack Investor says download and study this chart … and work towards getting a mix of some appreciating assets … accumulate, then hang on!

Financial year total returns (%) for the major asset classes

In the Vanguard 2023 table below, for each asset class the total annual returns are given and the best performing class for each year is shaded in blue/green … and the worst in pink. What stands out to Slack Investor is that is rare for and asset class to lead in annual returns (blue/green) for two years in a row – and there are years where the leading asset class (blue/green) becomes the worst performer (pink) in the next year. This drives home the need to spread your investments over different asset classes (diversification) and stay the course – 30 years of data talks loudly to Slack Investor.

Total returns for each asset class for the 30 years since 1993 – Check out the full glory of the Vanguard 2023 Brochure in PDF format– Click table image for better resolution.

This table highlights the benefits of diversification across asset classes for the long-term investor. Each asset class might be the best performing (Blue/Green shading), or the worst performing (Pink shading) for the year – and might dominate (or languish) for up to two years in a row. However, often a worst performing asset will show up as the best performing asset in the very next year – or vice versa.

Slack Investor is accepting of the occasional negative returns on a yearly basis for the appreciating asset classes- and concentrates on the 30-yr average long-term annual returns for holding shares and property of over 9% p.a.

When averaged over 30 years, the asset class and annual returns are : For AUST. SHARES 10.0%; INT’L SHARES 8.7%; U.S. SHARES 11.6%; AUST. LISTED PROPERTY 9.0%; and INT’L LISTED PROPERTY 9.7%; This compares with the average cash return of 4.3% p.a.

Slack Investor knows where he wants to be … over the long term, it isn’t cash.

August 2023 – End of Month Update

Slack Investor remains IN for Australian index shares, the US Index S&P 500 and the FTSE 100.

All Slack Investor overseas followed markets had a negative month (S&P 500 -1.8 %, and the FTSE 100 -3.4% and the Australian stock market did the same (ASX 200 -1.4%).

All Index pages and charts have been updated to reflect the monthly changes – (ASX IndexUK IndexUS Index).

Financial Year 2023 Slack Results

“I believe in evidence. I believe in observation, measurement, and reasoning, confirmed by independent observers. I’ll believe anything, no matter how wild and ridiculous, if there is evidence for it.

Isaac Asimov – US Author and Biochemist

Good fortune has prevailed in FY 2023. After the tough investing year of FY2022, Slack Investor has stuck to his strategy of investing with growing companies that have an established earnings record and forward P/E ratios <50 (Mostly!). As always, there have been a few lapses, but that’s just part of being an investor.

I expect a bit of volatility in my (mostly “growth”) investment portfolio and I try to reassure myself that, despite the odd negative year in the Slack Investment Portfolio the Stable Income portfolio is doing its job and keeping Slack Investor with enough cash to keep things running. In the world markets, the FTSE 100 Total Return Index was up 7.8% (last FY up 5.7%). Dividends helped the Australian Accumulation Index to be up 10.6% for the financial year (last FY -7.5%). The S&P 500 Total Return Index is again full of optimism – and was up 19.7% (last FY -10.7%) for the same period. All of these Total Return Indicies include any accumulated dividends.

Slack Portfolio Results FY 2023

All Performance results are before tax. The Slack Portfolio is Slack Investor’s investment portfolio and, after the first negative year since starting this portfolio in 2010, I am delighted to be “Back in the Black” – with an annual FY 2023 performance of +17.9%. Full yearly results with benchmarks are shown in the table below.

FY2022 was another bumper year in real estate – particularly Brisbane -but there has been a welcome pause in housing prices for FY2023. For property, the actual falls in asset values is greater than that shown as Slack Investor is using the Total Return values supplied by CoreLogic. The Total Return is calculated from value change as well as the gross rental yield. I would have preferred calculations that include the net rental yield, but this will have to do. The Total Return is a more realistic figure when comparing real estate returns to stock market total returns, as it treats both asset classes as investments.

The share market was the place to be for FY 2023, with the Australian Share market Total Return Index (ASX200 Acc) up 10.6% and the Vanguard Diversified Growth ETF (VDGR), comprising mostly (68%) of International and Australian Shares, increasing by 11.2%. Inflation is again coming in big – with the CPI at +6.0% – reinforcing the need to have exposure to “growth assets” such as shares or property.

Yearly Performance (%) results since 2010

YEAR SLACK FUND MEDIAN BAL VGARD GROWTH ASX200Acc RES BRIS RES MELB CASH CPI
2010 6.6 9.8 12.3 13.1 10.8 26.9 4.2 3.1
2011 2.5 8.7 9.1 11.7 -2.4 0.9 4.4 3.7
2012 8.3 0.4 1.3 -6.7 1.3 -0.9 4.3 1.2
2013 26.5 14.7 18.6 22.8 7.7 8.3 3.2 2.4
2014 23.6 12.7 14.5 17.4 11.5 12.8 2.6 3.0
2015 2.4 9.6 11.8 5.7 7.7 15.6 2.5 1.5
2016 14.2 3.1 4.2 0.6 8.4 9.5 2.2 1.3
2017 19.5 8.1 8.8 14.1 6.5 17.7 1.9 1.9
2018 37.6 7.2 10.0 13.0 5.2 3.9 3.9 2.1
2019 19.7 6.2 9.8 11.5 1.7 -6.0 2.0 1.3
2020 9.4 0.3 0.6 -7.7 8.4 13.8 1.1 -0.3
2021 21.7 13.0 20.3 27.8 17.9 10.7 0.2 3.8
2022 -14.3 -2.5 -13.0 -6.5 25.6 3.1 0.3 6.1
2023 17.9 6.9 11.2 10.6 -4.1 -2.6 2.6 6.0

The Slack Fund yearly progress vs BENCHMARKS. The Median Balanced Fund (41-60% Growth Assets)Vanguard Growth FundASX 200 Accumulation IndexCorelogic Residential Property Home Value (Total Return) Index in both Brisbane and Melbourne, and Cash (Australian Super Cash Fund) and Consumer Price Index (CPI)

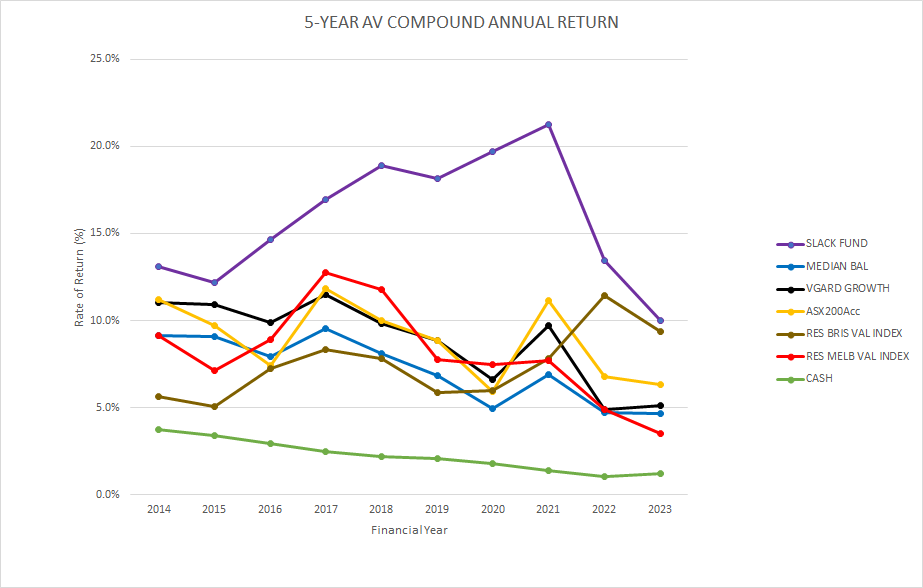
Although I collect yearly figures, the 5 and 10-year compound annual performance gives me a much better idea about how things are going and will smooth out any dud (or remarkable!) results. The Slack Fund is still ahead of Benchmarks – but currently being challenged by Brisbane Residential real estate over a five-year period.

5-yr Average Annual Performance
Slack Investor 5-year compound annual rate of return – compared to benchmarks – Click for better resolution.

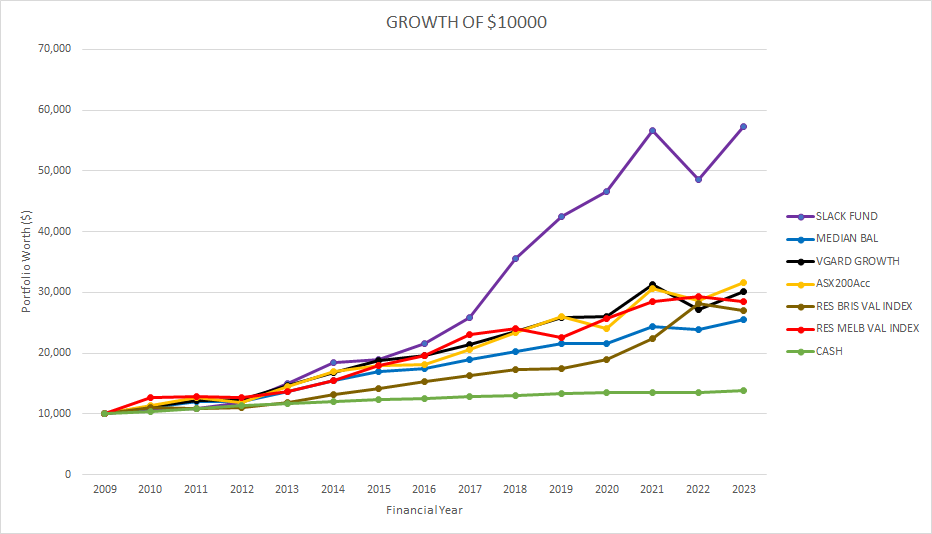
The beauty of compounding with a succession of good performance results can be seen in the chart below showing the growth of an initial investment in June 2009 of $10000.

Growth of a $10000 Investment Since 2009
The rate of growth of $10000 invested by Slack Investor in FY 2009 – compared to benchmarks – Click for better resolution.

10-year compound annual rate of return

The Slack Fund has been around a while and, at last, I am generating some long term data (10-year compound “rolling” annual rate of return). Over this time frame, the Slack Fund has been performing very well. A 10-year annual rate of return of over 14% – Go Slack Fund!

However, the 10-yr rates of return of the Median Balanced Fund, Vanguard Growth fund, ASX200, and residential property in Brisbane and Melbourne are also great long term investments, generating a 10-year compound annual rate of return of 6-9% p.a. From the figures below, although it can add stability to a portfolio, Cash as a long term investment, is a poor choice.

Average 10-yr compound yearly return

YEARSLACK FUNDMEDIAN BALVGARD GROWTHASX200AccRES BRISRES MELBCASH
2019 15.6 8.0  10.0 5.8 8.5 2.9
2020 15.9 7.0  7.8 5.5 7.3 2.6
2021 17.9 7.4  9.3 7.5 8.3 2.2
2022 15.2 7.1 8.1 9.3 9.9 8.7 1.8
202314.4 6.4 7.4 8.2 8.6 7.6 1.7

The Slack Fund average 10-yr compound yearly return vs BENCHMARKS. The Median Balanced Fund (41-60% Growth Assets)Vanguard Growth FundASX 200 Accumulation IndexCorelogic Residential Property Home Value (Total Return) Index in both Brisbane and Melbourne, and Cash (Australian Super Cash Fund) and Consumer Price Index (CPI)

Advice for a young man … and June 2023 – End of Month Update

Getty Images

I was recently delighted when my 14-yr old nephew asked me what I thought he should invest in with his earnings from his part-time jobs.

Firstly, it is a compliment to an old bloke to be asked anything, and secondly, it is testament to the financial maturity of this fine young man that he would be thinking about the world of the share market while still at school.

If he was older and in a steady full-time job I would advise he automate his savings as much as possible and lash into index funds via a platform such as StockspotPearler, Vanguard Personal, or Raiz)

His first investment would be in the order of a few thousand hard-earned dollars from part-time jobs. It is vital that the investment has good prospects and unlikely to lose money over a 5-yr period (no guarantees though!). Given that he would not feel the need to access the money for 5 years (hopefully longer!)

For a first investment, I would add the criteria that it should be a well-known Australian company that might appear in the news occasionally and remind him that he is a part-owner … and an investor!

If he was already 18, it would be “off to the races” and we would immediately set up a broker account in his own name and he would begin to experience the magic of being a shareholder. Being under 18 complicates things a little as minors are not allowed to directly own shares- we need to enlist his parent’s help.

If the parent already has a broker account the best way to start is for the parent to buy the shares on his behalf. When he turns 18, my nephew can start his own account with a broker (e.g. Self Wealth, Commsec, Pearler) and the parent can use an off-market transfer (get the form from the broker) to get the shares into my nephew’s hands as a “gift” including any dividends earned. During this brief holding period, any dividends and any capital gain will count as taxable income in the parents name – but this is a small price to pay to tap my nephew’s enthusiasm.

Alternatively, you could open a broker account in their name (as the trustee for “Nephews name”). The process is a little more complicated and is explained in detail by SelfWealth.

The Nuts and Bolts of Stock Selection

Naturally, I would address this problem in a methodical way and set up a list of Slack owned companies – I couldn’t recommend a company that I didn’t own myself. Some of my favourite stock metrics are gathered from the excellent Market Screener site on the financials page for each stock.

My number one metric for looking at companies is their Return on Equity (ROE), estimated for the year 2024 – Slack Investor is looking forward. This gives me an idea about whether a company is making an investment dollar grow. Higher the better, I start getting curious about a company when ROE is above 15%.

The projected Price Earnings ratio in 2024 is next – I don’t like the P/E Ratio to get above 40, as this indicates the current price of the company is 40 times its earnings (expensive) – but some exceptions are made if the company is growing fast (High ROE). The yield (dividend) is not that important to a young investor, it is the total growth that counts.

StockSymbol2024 ROE2024 P/E2024 YieldPrice 30/06/23% Price below consensus
CSL LtdCSL18%301.5%$277.38-18%
WesfarmersWES30%223.9%$49.34Fair Value
ColesCOL31%223.9%$18.42Fair Value
AltiumALU32%411.9%$36.92-6%
Macquarie BankMQG13%144.2%$177.62-10%
Car SalesCAR10%282.8%$23.82-3%
RealEstate.comREA29%411.3%$143.03-7%
Analysis of some Slack Investor owned stocks using the projected Return on Equity (2024 ROE); price earnings ratio in 2024 (2024 P/E); 2024 Yield; and the current price (30 June 2023); and current discount from the average analyst perceived value – marketscreener.com – Financials Tab

Looking at the figures, even though the stock price of CSL hasn’t really gone anywhere in the last 3 years, it would be my first pick as it is currently 18% below its fair value price (by a consensus of analysts). It is such a strong Australian company that really thinks of the future by continuing to increase its spend on research and development each year.

Wesfarmers (Bunnings, K-Mart, Officeworks, etc) and Coles look OK too because of their high Return on Equity (ROE) – they also have the benefit that you can continually pop in to see how your business is going. Altium has languished in price this last few years but remains a great company for the future – if my nephew was interested in the “tech” space.

This isn’t advice, Unless, of course, you are my nephew!

June 2023 – End of Month Update

The financial year closes and looking at the 12-month charts for FY 2023 – Slack Investor concludes … “It was better than last year”!

Slack Investor remains IN far all followed markets. The ASX 200 (+1.6%) and FTSE 100 (+1.1%) drifted slightly upward for the month. It is boom-time in the US with the S&P 500 rising 6.5%. The US index had moved more than 15% above its stop loss, so I have moved the stop loss upward to 4048.

All Index pages and charts  have been updated to reflect the monthly changes – (ASX IndexUK IndexUS Index). The quarterly updates to the Slack Portfolio have also been completed.