“When you can measure what you are speaking about, and express it in numbers, you know something about it. ”
Lord Kelvin (William Thomson, Mathematician and Physicist, 1824-1907)
Slack Investor reflects on a tough investing year. I have mostly “stuck to my guns” investing with growing companies that have an established earnings record and forward P/E ratios <50. There have been a few lapses (e.g. XRO) which had a forward PE ratio of about 100 when I bought it last financial year … and, I paid the price when the higher interest rates and threats of inflation caused a rapid change in valuation of most tech stocks.
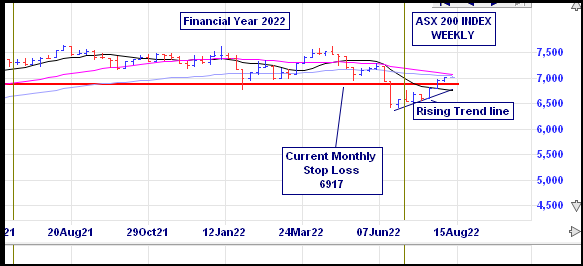
I expect a bit of volatility in my mostly “growth” investment portfolio and I try to reassure myself that, despite the odd negative year in the Slack Investment Portfolio the Stable Income portfolio is doing its job and keeping Slack Investor with enough cash to keep things running. In the world markets, the FTSE 100 Total Return Index was up 5.7% (last FY down 13.8%). Dividends helped the Australian Accumulation Index to be down 7.5% for the financial year (last FY +27.8%). The S&P 500 Total Return Index took a breather at last – and was down 10.7% (last FY up 36.4%) for the same period. All of these Total Return Indexes include any accumulated dividends, wheras the chart below of the ASX 200 for FY 2022, just shows stock prices.

Slack Portfolio Results FY 2022
All Performance results are before tax. The Slack Portfolio is Slack Investor’s investment portfolio and it had its first negative year since its establishment in 2010 – with an annual FY 2022 performance of -14.3%. Full yearly results with benchmarks are shown in the table below. It was a challenging year for all of my benchmarks that were exposed to sharemarkets (Median Balance Fund -2.5%, Vanguard Growth Fund -13.0%, ASX 200 Accumulation -6.5%).
Slack Investor seems to be clueless in real estate predictions … I have thought for some years that there must be a sizable correction soon – as the prices are still stratospheric in Melbourne and Sydney compared to incomes. The correction may still yet happen as interest rate rises are yet to take their toll.
The Brisbane real estate market was the place to be for FY 2022 (+25.6%) on top of a big year last year!) – Inflation was also a suprise for the challenged Slack Investor – with the CPI at +6.1%.
| YEAR | SLACK FUND | MEDIAN BAL | VGARD GROWTH | ASX200Acc | RES BRIS | RES MELB | CASH | CPI |
|---|---|---|---|---|---|---|---|---|
| 2010 | 6.6 | 9.8 | 12.3 | 13.1 | 10.8 | 26.9 | 4.2 | 3.1 |
| 2011 | 2.5 | 8.7 | 9.1 | 11.7 | -2.4 | 0.9 | 4.4 | 3.7 |
| 2012 | 8.3 | 0.4 | 1.3 | -6.7 | 1.3 | -0.9 | 4.3 | 1.2 |
| 2013 | 26.5 | 14.7 | 18.6 | 22.8 | 7.7 | 8.3 | 3.2 | 2.4 |
| 2014 | 23.6 | 12.7 | 14.5 | 17.4 | 11.5 | 12.8 | 2.6 | 3.0 |
| 2015 | 2.4 | 9.6 | 11.8 | 5.7 | 7.7 | 15.6 | 2.5 | 1.5 |
| 2016 | 14.2 | 3.1 | 4.2 | 0.6 | 8.4 | 9.5 | 2.2 | 1.3 |
| 2017 | 19.5 | 8.1 | 8.8 | 14.1 | 6.5 | 17.7 | 1.9 | 1.9 |
| 2018 | 37.6 | 7.2 | 10.0 | 13.0 | 5.2 | 3.9 | 3.9 | 2.1 |
| 2019 | 19.7 | 6.2 | 9.8 | 11.5 | 1.7 | -6.0 | 2.0 | 1.3 |
| 2020 | 9.4 | 0.3 | 0.6 | -7.7 | 8.4 | 13.8 | 1.1 | -0.3 |
| 2021 | 21.7 | 13.0 | 20.3 | 27.8 | 17.9 | 10.7 | 0.2 | 3.8 |
| 2022 | -14.3 | -2.5 | -13.0 | -6.5 | 25.6 | 3.1 | 0.3 | 6.1 |
The Slack Fund yearly progress vs BENCHMARKS. The Median Balanced Fund (41-60% Growth Assets), Vanguard Growth Fund, ASX 200 Accumulation Index, Corelogic Residential Property Home Value Index in both Brisbane and Melbourne, and Cash (Australian Super Cash Fund) and Consumer Price Index (CPI)
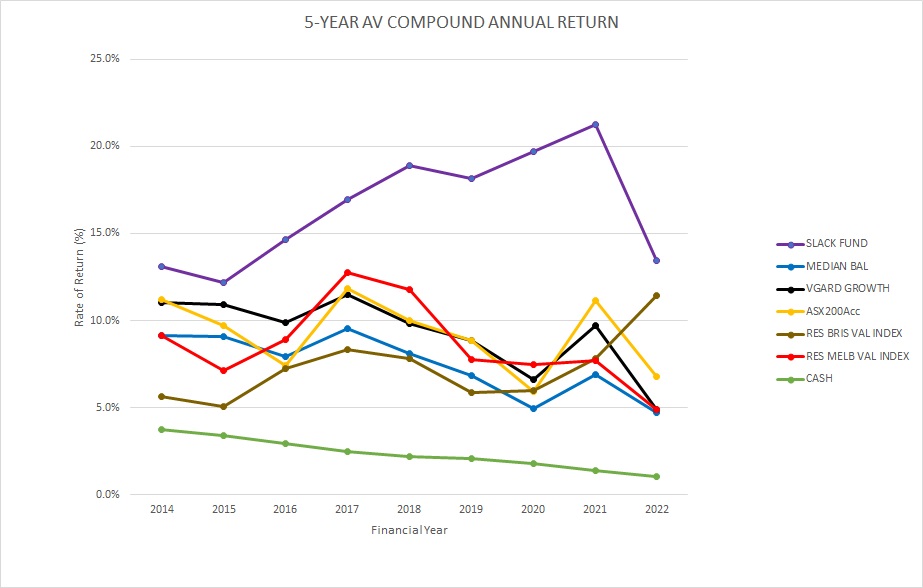
However, the five-year compound annual performance gives me a much better idea about how things are going and will smooth out any dud (or remarkable!) results. The Slack Fund is still ahead of Benchmarks – but currently being challenged by Brisbane Residential real estate.

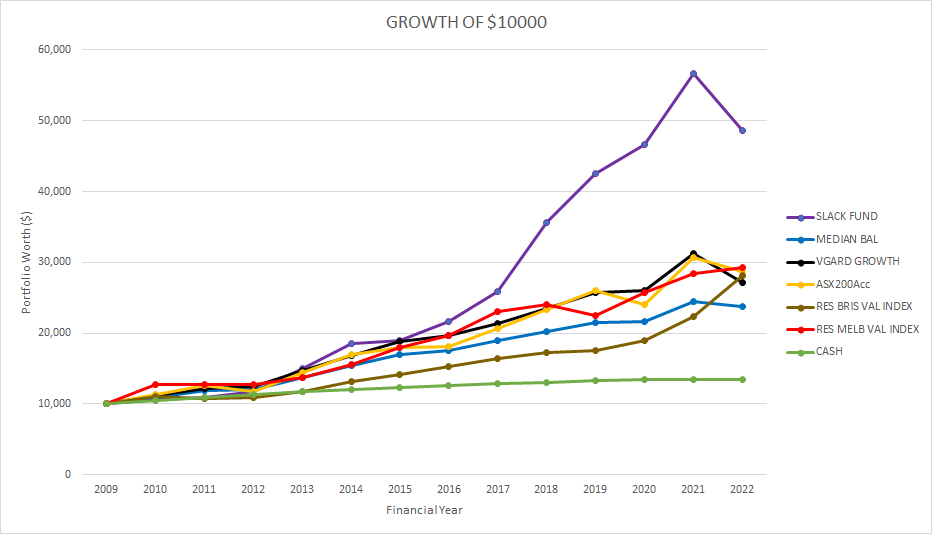
The beauty of compounding with a succession of good performance results can be seen in the chart below showing the growth of an initial investment in June 2009 of $10000.

10-year compound annual rate of return
The Slack Fund has been around a while and, at last, I am generating some long term data (10-year compound “rolling” annual rate of return). Over this time frame, the Slack Fund has been performing very well. A long-term annual rate of return of over 15% – Go Slack Fund!
However, the 10-yr rates of return of the Median Balanced Fund, Vanguard Growth fund, ASX200, and residential property in Brisbane and Melbourne are also great long term investments, generating a 10-year compound annual rate of return of at least 7% p.a.
| YEAR | SLACK FUND | MEDIAN BAL | VGARD GROWTH | ASX200Acc | RES BRIS | RES MELB | CASH |
|---|---|---|---|---|---|---|---|
| 2019 | 15.6 | 8.0 | 10.0 | 5.8 | 8.5 | 2.9 | |
| 2020 | 15.9 | 7.0 | 7.8 | 5.5 | 7.3 | 2.6 | |
| 2021 | 17.9 | 7.4 | 9.3 | 7.5 | 8.3 | 2.2 | |
| 2022 | 15.2 | 7.1 | 8.1 | 9.3 | 9.9 | 8.7 | 1.8 |
