Lets just get this out there … Slack Investor knows just the bare minimum on human relationships and isn’t qualified to give advice on matters of the heart. The only piece of useful knowledge that I can pass on is from, designer and business woman, Coco Chanel.
“As long as you know most men are like children, you know everything.” — Coco Chanel (1883-1971) from source
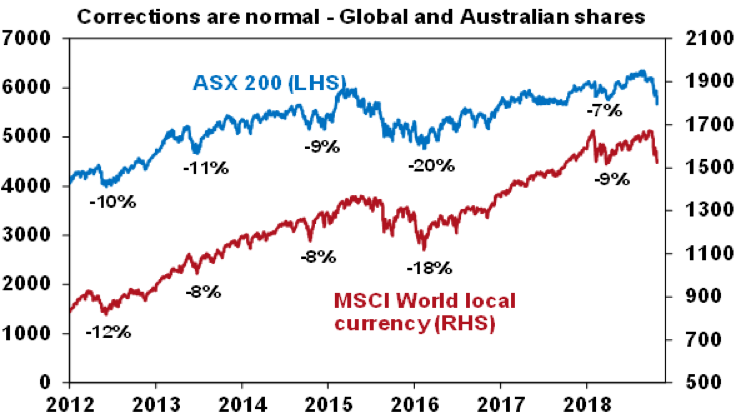
It has been a torrid last couple of months in the share market and Slack Investor has had to say goodbye to some of his old friends (Stocks that I have had a relationship with!) Last post I briefly looked at when its time to break up with individual stocks – this is something Slack Investor always finds a hard thing to do as I have to overcome the “confirmation bias” that tells me that I did the right thing in picking them in the first place – and, taking a loss sometimes is never pleasant. However, I steel myself with the conviction that it is the overall result that counts and to do that, you must associate with some winners
Let’s have a look at the overall Australian market. The economy is running along fine and the All Ordinaries is close to its long-term average value PE Ratio of 15 (15.6 Australian Financial Review 16/11/18). The US pundits are starting to talk about a possible recession in couple of years time – but this is now – and Slack Investor still whiffs (but does not know!) that the current downturn is an ordinary correction in the charts due to a change in sentiment. In the UK, things look a bit of a Brexit mess – so expect more bad news there.
I start with a watchlist of 15-20 companies that I like – or have been recommended in the press or internet. I then go to the most excellent site marketscreener.com where you can access a variety of analyst data on world stocks by free registration – entering your stock symbol and then going to the financials tab. The thing I love about this site is the predictive data for the next couple of years. These figures are just forecasts as they are based upon the companies sales predictions for itself … but a good company won’t try to “gild the lily” too much on its predictions of earnings.
For each company, I write down their future PE’s, yield and Return on Equity (ROE). ROE is really important and should be 15 or more. A company must have increasing sales, an increasing history of dividends and manageable debt. I setup a group of companies that have reasonable numbers and put them in a table (… like below!)
| Company | Symbol | Future PE | Future Yield % | Future ROE | Sales Inc | Divdnd Inc | Debt | Chart Momtm |
|---|---|---|---|---|---|---|---|---|
| 2019/2020 | 2019/2020 | 2019/2020 | EPS | History | Chge(Wk) | |||
| Costa Group | CGC | 23/20 | 2.4/2.7 | 18/19 | YES | YES | OK | YES |
| Macquarie Group | MQG | 14/14 | 4.7/4.9 | 17/17 | YES | YES | OK | YES |
| Service Stream | SSM | 13/11 | 5.1/5.7 | 23/24 | YES | YES | OK | YES |
| Amcor | AMC | 15/12 | 5.0/5.3 | 67/71 | YES | YES | OK | YES |
| Reece | REH | 20/19 | 2.2/2.3 | 15/14 | YES | YES | OK | YES |
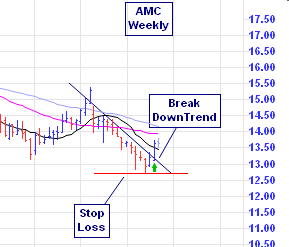
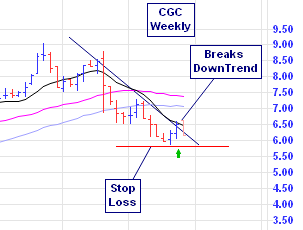
That is the” fundamental” part of my analysis … and then I wait patiently, watching the weekly charts until there is a change in momentum on a stock – this is the “technical” part of the analysis. I will try to buy the company as soon as I can after this momentum change … but set a stop loss just In case I am wrong!
There are many chart indicators that show a change in momentum. I like using the 11-week Directional Movement Index (ADX) on a weekly chart – or a breakthrough of a downward trend line. Examples of changes in momentum are shown below on the weekly charts of Amcor (AMC) and Costa Group (CGC)


This is not advice … But I have recently bought these companies and will report back in a year as to how things have worked out.
I have also admired the US Technology Index (NASDAQ) from afar for a long time – but never had a chance to buy it. It is available in Australia as a Beta Shares ETF (NDQ). However, NDQ is still moving south and has yet to break out of its downward trend.
Technically speaking, maybe it nearly is time to start dating again!


