Vanguard 2023 Annual Long term Investing chart  and … August 2023 – End of Month Update

Whether it has been a good investing year – or a bad one, August is the time when the Vanguard long-term (30 yr) investing chart lands. It is a timely reminder that whatever is happening in the short term, investing for the long term (> 5-10 yr) in International and Australian shares will compound your wealth. Anyone with a steady income that exceeds their living expenses can do this – so, what a young Slack Investor would do, is Automate his investments, through platforms such as StockspotPearlerVanguard Personal, or Raiz) … and “Get Cracking!”
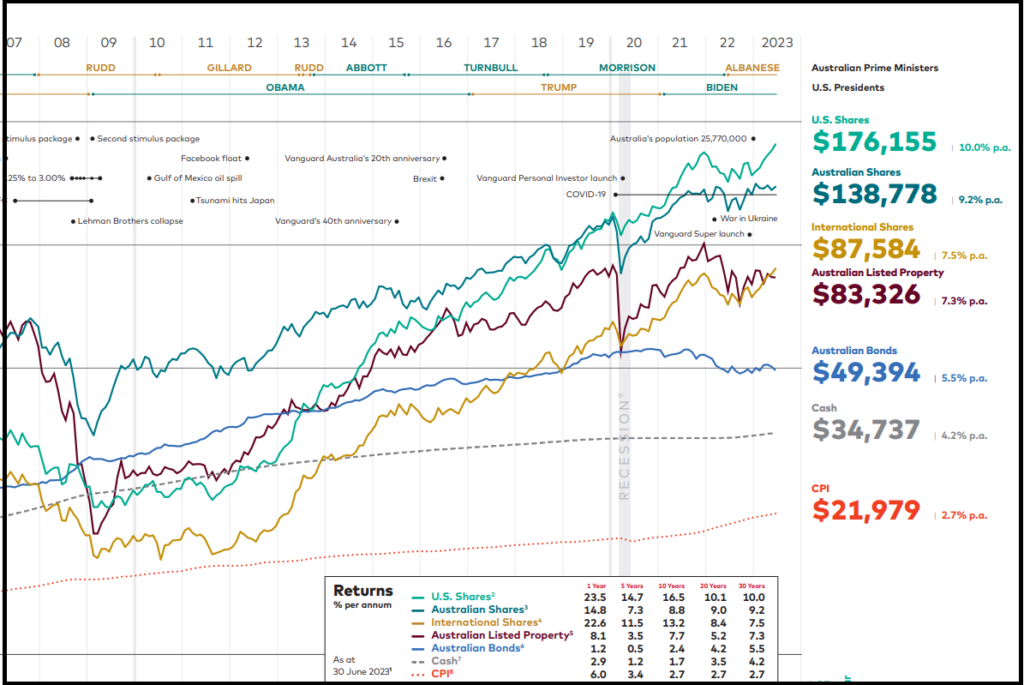
Extract from the 2023 Vanguard Index chart (Just the 2007-2023 portion) – the dollar values on the right are the results of investing $10000 in index funds in each asset class for 30 years (since July 1993) – Check out the full glory of the Vanguard 2023 chart in PDF format – Click image for better resolution.

The lessons of long term investing

Every year Vanguard publish their performance data on each asset class. Slack Investor looks forward to this – as it demonstrates the powerful compounding that happens when the appreciating asset classes of Shares and Property are held for a long time (30 years). Although this Vanguard collection of data shows the volatility of asset values in the short term – it also also emphasizes the joys of holding and accumulating shares or property for long periods of time. These asset classes have steadily increased in value over the last 30 years. $10000 invested in Australian Shares in 1993 would have compounded to $138 778 in 2023, US Shares would have compounded to $176 155. Staying in Cash would have yielded $34 737.

Slack Investor says download and study this chart … and work towards getting a mix of some appreciating assets … accumulate, then hang on!

Financial year total returns (%) for the major asset classes

In the Vanguard 2023 table below, for each asset class the total annual returns are given and the best performing class for each year is shaded in blue/green … and the worst in pink. What stands out to Slack Investor is that is rare for and asset class to lead in annual returns (blue/green) for two years in a row – and there are years where the leading asset class (blue/green) becomes the worst performer (pink) in the next year. This drives home the need to spread your investments over different asset classes (diversification) and stay the course – 30 years of data talks loudly to Slack Investor.
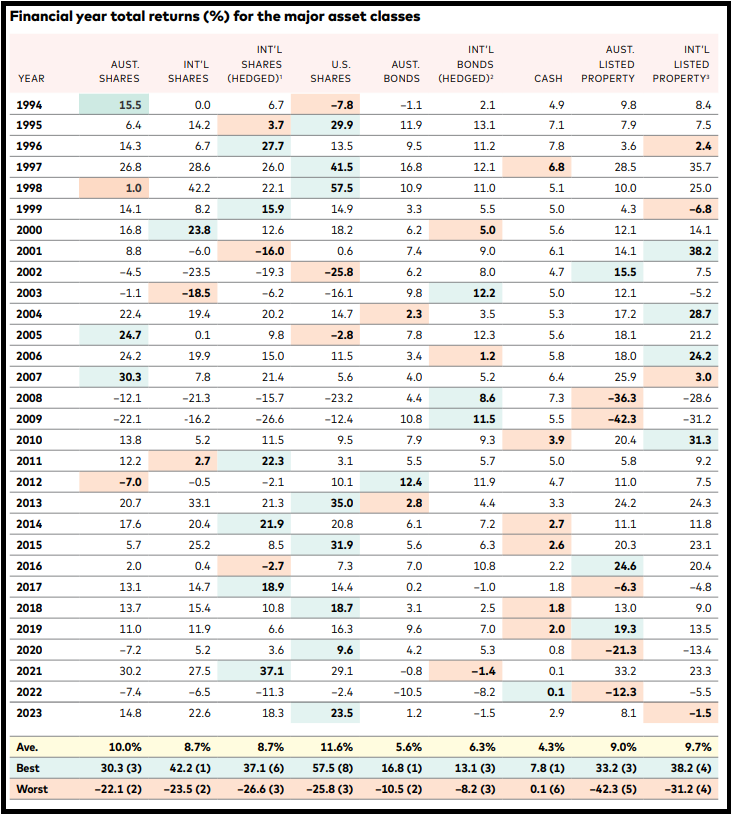
Total returns for each asset class for the 30 years since 1993 – Check out the full glory of the Vanguard 2023 Brochure in PDF format– Click table image for better resolution.

This table highlights the benefits of diversification across asset classes for the long-term investor. Each asset class might be the best performing (Blue/Green shading), or the worst performing (Pink shading) for the year – and might dominate (or languish) for up to two years in a row. However, often a worst performing asset will show up as the best performing asset in the very next year – or vice versa.

Slack Investor is accepting of the occasional negative returns on a yearly basis for the appreciating asset classes- and concentrates on the 30-yr average long-term annual returns for holding shares and property of over 9% p.a.

When averaged over 30 years, the asset class and annual returns are : For AUST. SHARES 10.0%; INT’L SHARES 8.7%; U.S. SHARES 11.6%; AUST. LISTED PROPERTY 9.0%; and INT’L LISTED PROPERTY 9.7%; This compares with the average cash return of 4.3% p.a.

Slack Investor knows where he wants to be … over the long term, it isn’t cash.

August 2023 – End of Month Update

Slack Investor remains IN for Australian index shares, the US Index S&P 500 and the FTSE 100.

All Slack Investor overseas followed markets had a negative month (S&P 500 -1.8 %, and the FTSE 100 -3.4% and the Australian stock market did the same (ASX 200 -1.4%).

All Index pages and charts have been updated to reflect the monthly changes – (ASX IndexUK IndexUS Index).

The Long View

“Astronomie”, Georg Leopold Hertel and François Boucher, 1750 – 1778 – Rijksmuseum, Netherlands

What exactly these angelic cherubs are up to in this etching will remain a mystery to Slack Investor, but he would say that looking at things from a distance is a worthwhile trait in the stock market world. Slack Investor is currently in Europe on holiday and the geographical distance and time zone shift have helped him take more of a holiday from the markets … and just let them get on with it – without interference!

Take the long view

There are some scary headlines and plenty of volatility on the stock markets with worries about inflation and international bank collapses. Slack Investor will just pass on some sage advice. Here is the secret to being a good investor …

Don’t get caught up in what happens in three months, six months, or 12 months. It’s about the next five to seven years.

Paul Taylor, head of investments for Fidelity Australia and Portfolio Manager for the Fidelity Australian Equities Fund

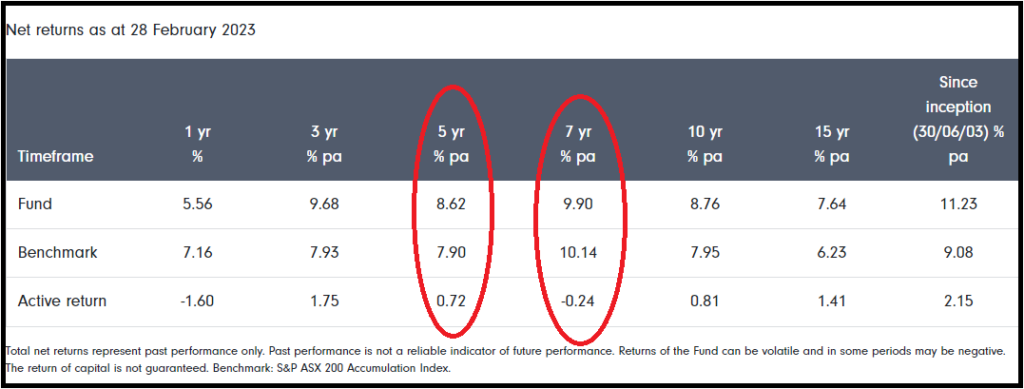
Paul Taylor is no mug … his Australian Equities Fund is of the managed fund variety and, despite a slug of 0.85% p.a. in management fees, his fund has kept pace or slightly bettered the performance of the ASX 200 Accumulation index over the 5 and 10-yr periods. Even though the managers of the fund appear to know what they are doing, the difficulty of beating index funds over every time period is shown by the negative relative performance over 1 and 7-yrs.

Fidelity Australian Equities Fund performance compared to the ASX 200 Accumulation index – up to the end of February 2023.

Now, Slack Investor completely agrees with Mr Taylor, when investing in equities (shares), you should be locking them up for at least 5 years so that any volatility will be swamped by the beautiful long-term march of increasing value for Australian and International Shares. See the latest Vanguard Long Term Chart to see what I mean.

Slack Investor is still “pretend hurting” from his own last year’s (FY22) annual Slack performance (-14.3%). However, he realises his 5-yr and 10-yr performance is the critical measure for his Slack Fund. As these returns p.a. (13.5% (5-yr) and 15.2% (10-yr), are comfortably above benchmarks, I have reconciled the poor one year figures as just part of the volatility of owning mostly growth shares.

Contribute regularly to your savings

Whether adding to your super, or investment savings, the best way to do this is to add regularly, without even thinking about it. Set up an automatic personal deduction from your salary to your super – or automatically contribute to your savings through a vehicle that is in sync with your risk tolerances (e.g. StockspotPearler).

As my super was accumulating, it was mostly in broad-based index funds (Australian and International). My other investments were mostly in individual companies.

While it’s possible to beat index funds, it’s not easy to do over the long run … and as it isn’t worthwhile for most of us to try.

Paul Samuelson, American Nobel prize winner in economics – from johncbogle.com

Slack Investor has some exposure to index-type ETF’s but continues to dabble in individual companies. Despite the above warning, Slack Investor will continue to “have a crack” at stock selection and portfolio management – but only while his long-term performance still stands up.

Alignment

Four of the planets that are visible to the naked eye – Saturn, Mars, Venus and Jupiter were aligned on April 24, 2022 at 4.40am visible from Southbank, Melbourne – SBS Australia

We have 8 planets in our solar system (sorry Pluto!) all whizzing around the sun at different rates, occasionally they “align” when the planets line up or appear close together in a small part of the sky .

Planetary Alignment is a special thing, depending on which planets are involved – and their order. Sadly, Slack Investor wasn’t paying attention when 4 of the 5 planets visible to the naked eye (Mercury, Venus, Mars, Jupiter and Saturn) appeared in a line around the world on April 24 2022.

The bright string of lights in the morning sky (in April 2022) is thought to be a one-in-1000-year event.

Australian Geographic

Slack Investor is coming to the planetary alignment party very late and is now setting his sights on September 8, 2040, when five naked-eye planets (Mercury, Venus, Mars, Jupiter, and Saturn) will be within a circle of 9 degrees in the sky.

Investing alignment

Slack Investor may be a poor astronomer but one of his skills is noticing when two of the most important attributes in the stock market have an alignment – Value and Momentum.

Value investing involves looking at stocks that appear to be trading for less than what they are worth using a value screener like “book value” or the Price/Earnings ratio. Slack Investor likes to use the Cyclic Adjusted Price Earnings Ratio (CAPE) as a broad indicator of value – the lower the CAPE, the better the value.

Momentum investing just uses charts and indicators to pick out the current movement of a stock. Based upon the theory that – If the trend is upwards … it is likely to continue upwards. This is tricky though … the trend is your friend … until it isn’t!

Because trend trading is difficult, I always like a bit of assurance or alignment with value. Ideally, I like value and momentum in a stock before parting with Slack cash.

Value

It has been 6 months since I produced a set of index value charts based upon CAPE to look at how the markets are travelling.

As with individual companies, the whole share market will oscillate between overvalued and undervalued. Slack Investor has written about the Cyclically Adjusted Price to Earnings ratios (CAPE) which use ten-year average inflation-adjusted earnings. By plotting this CAPE over a period of time, we can look at how the whole sharemarket is currently valued in terms of historical data.

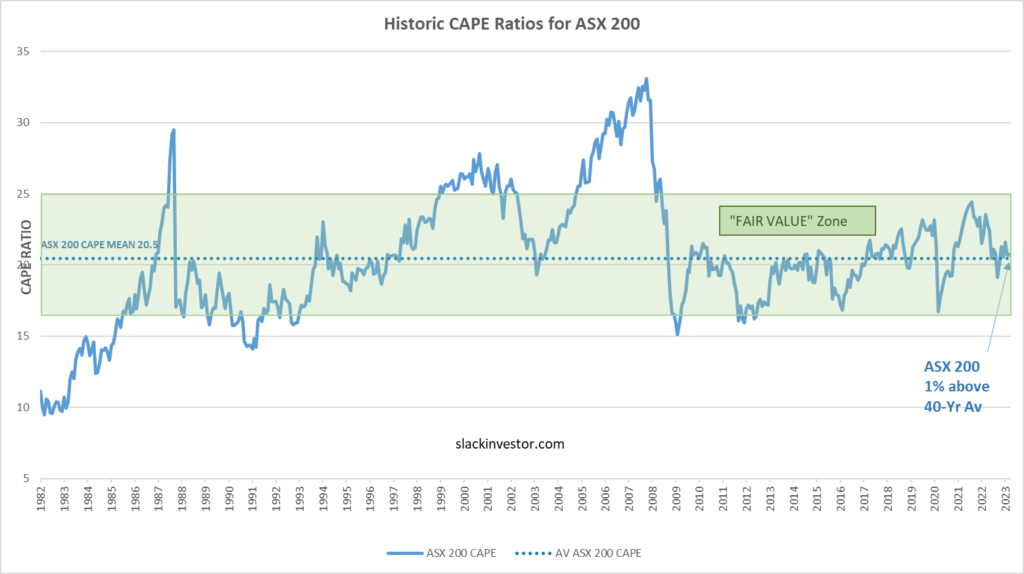
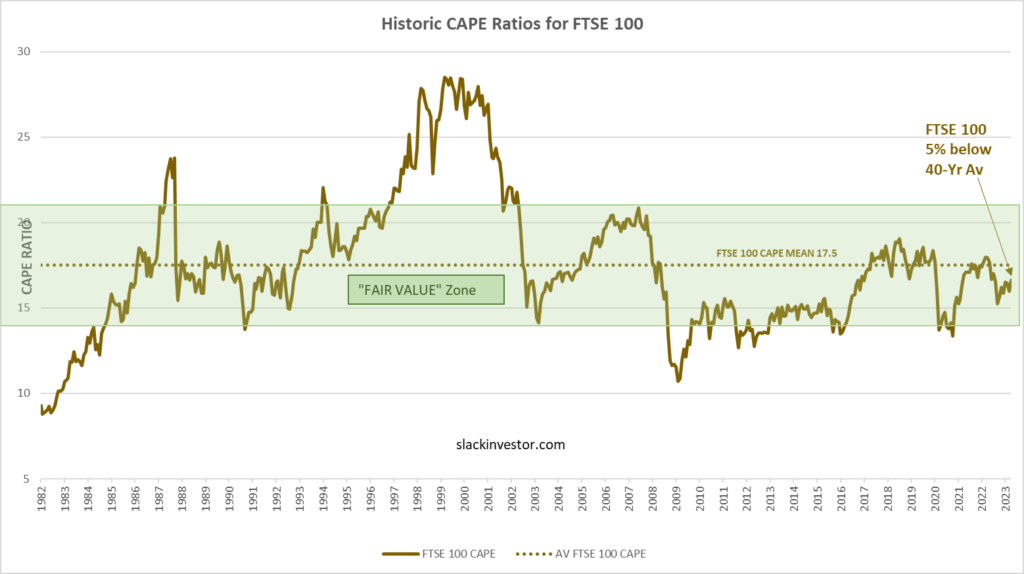
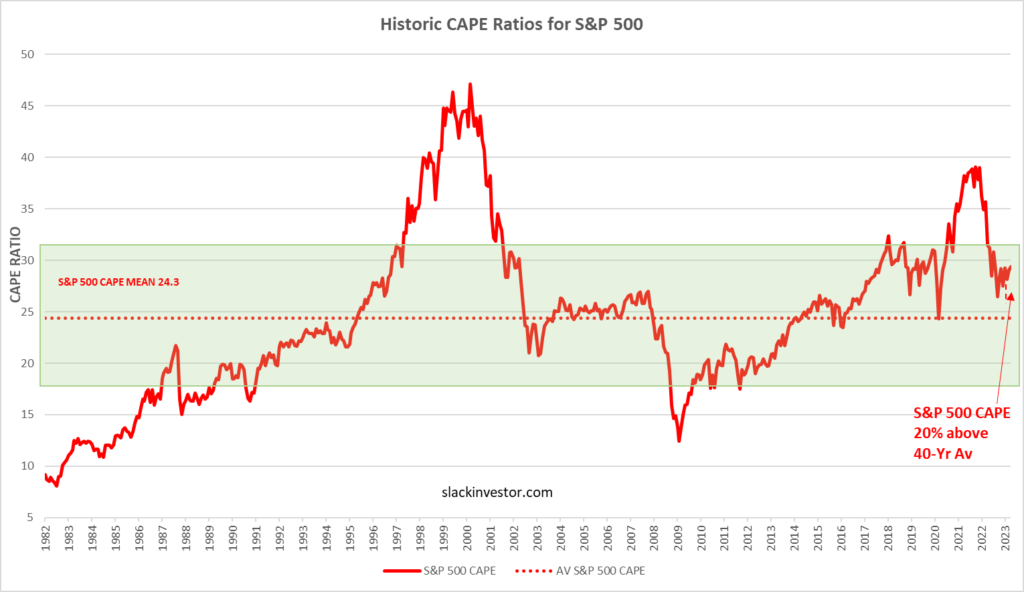
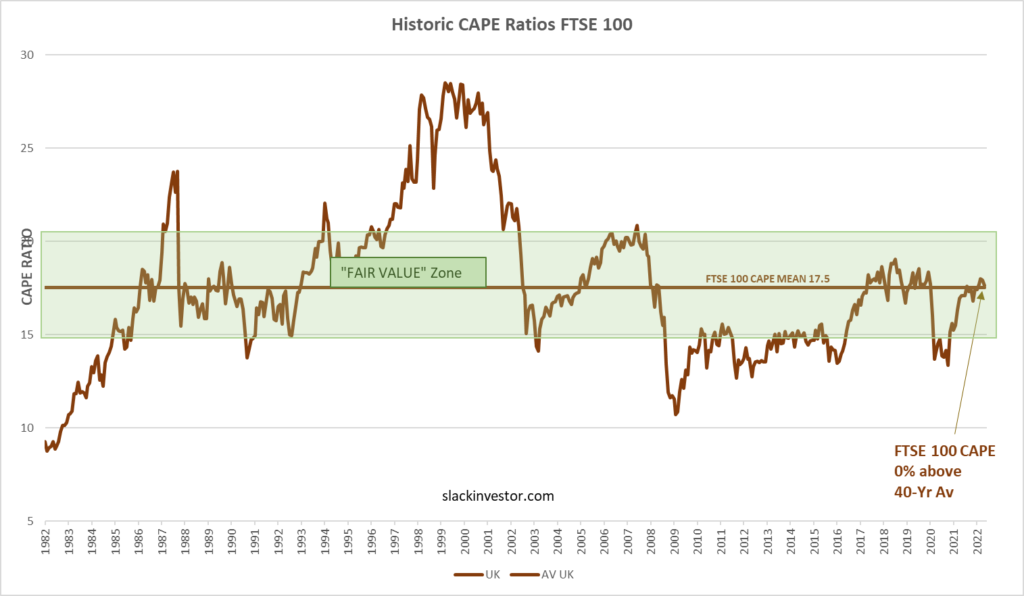
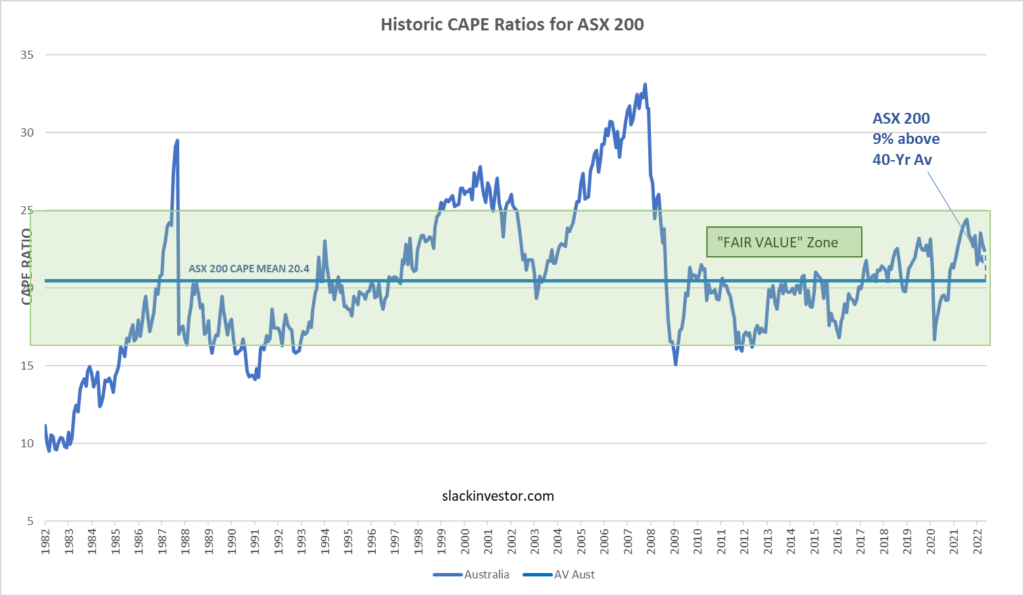
Using monthly CAPE data from Barclays, the 40-yr mean is calculated and plotted together with the CAPE values. A “fair value” zone is created in green where the CAPE is within one standard deviation of the mean.

Historic CAPE ratios for the ASX 200 – From 1982 to April 2023– Click the chart for better resolution.
Historic CAPE ratios for the FTSE 100 – From 1982 to April 2023– Click the chart for better resolution.
Historic CAPE ratios for the S&P 500– From 1982 to April 2023 – Click the chart for better resolution.

From the above, The ASX 200 is right on fair value (1% above av.) and the FTSE 100 is cheap (5% below av.). Both are worth looking at for the moment as their CAPE values are at, or below their long-term averages. The S&P500, is still in the “Fair value” range, but at 20% above the long term average – so, no bargain here.

Momentum

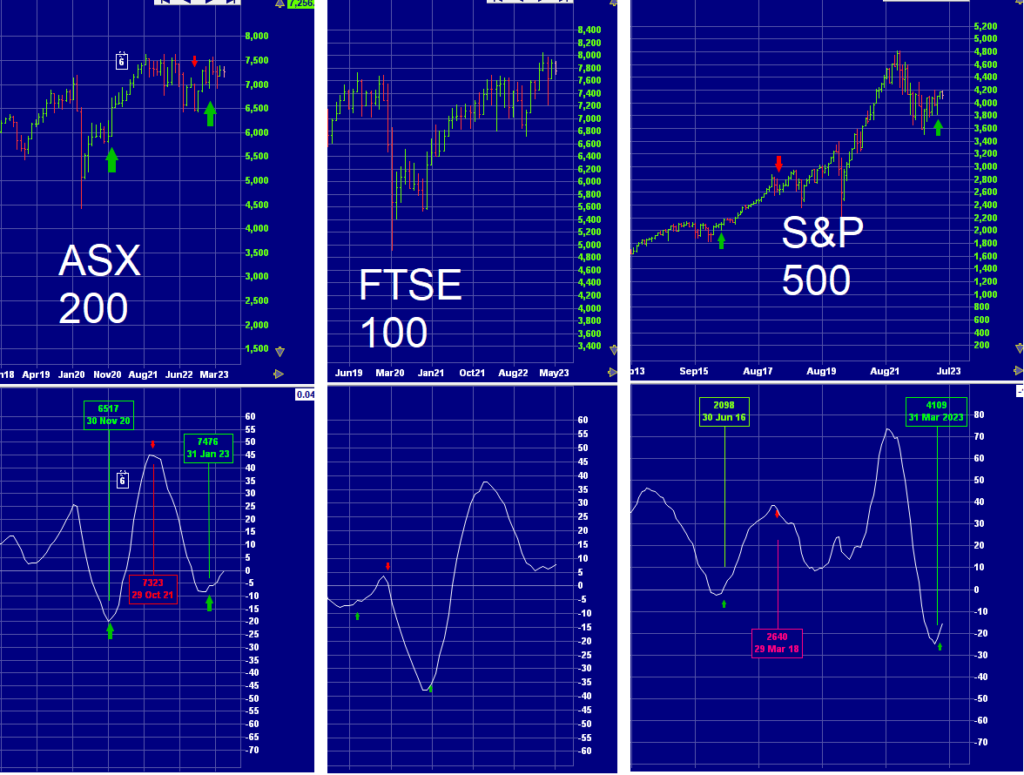
There are lots of stock indicators that track momentum. Slack Investor has blogged about The Coppock Indicator before. It has had an incredible track record in signalling the end of a “bear market”. The signal (Green Arrow) is triggered when the indicator (shown in the lower screens below as a white line) bottoms from under the zero line and then slopes upwards.

Monthly charts of the ASX 200, FTSE100 and S&P500 together with the Coppock Indicator (White Line) in the lower section of each chart. The green arrows show the “bottom of the market” predictions using the Coppock Indicator. The red arrows show a possible time to sell – Click the chart for better resolution – Incrediblecharts.com

The ASX 200 (Since 31 Jan 2023) and the S&P 500 (Since 31 Mar 2023) are showing signs of recovery from the bear market with the is well into the Coppock recovery cycle. The FTSE 100 is also showing signs of recovery, but as the Coppock indicator did not get below the zero line, this is not a proper Coppock reversal.

Alignment of Value and Momentum Together

Slack Investor will again rant about how market timing is difficult and that the best time to buy stocks is “all the time” – by automating your investments so that their is no decision inertia. Use dollar cost averaging.

However, the Coppock Indicator has been reliable so far in predicting stock gains. This is not advice, but the ASX 200 currently has the alignment of both value and momentum indicators. Alignment is good … If I wasn’t already fully invested, I would have a crack!

Nuns Know Best

In Nuns … Wisdom – The New Indian Express

Slack Investor loves a good story – whether its true or not! I like the owning of stocks and I also admire anyone who can stick to their vows. All of this seems to intersect with the story of the Coppock Curve – a technical indicator that can be mapped on stock price charts that has a great track record for showing when the market has reached the “bottom” of a cycle.

When I first started to think a bit more seriously about financial things, I was going to an evening investment class in Townsville. The class was held by a personal Slack Investor Hero, Robbie Fuller, who put on these classes for no personal gain … he just wanted to educate people about the opportunities that lay waiting in the stock market. Robbie would teach us about fundamental analysis (trying to measure the intrinsic value of a stock) and technical analysis (charts and trends). There was always a particular beauty when fundamental and technical information aligned about a company.

The class was usually a lot of fun, but I remember a time around 2011 when the markets were going through a bit of a lacklustre period and we had all had a few recent losing trades – there was just not much excitement about stocks.

Robbie came bounding in one evening after 31 July 2012 with the news that the Coppock Indicator had just turned … it was a sign that “good things will happen”- He was right – It was the start of a 3-yr period where the Australian market was mostly rising. It is much easier to trade when the “tide is coming in”.

The Coppock Curve is a “smoothed” momentum indicator developed by the economist Edwin “Sedge” Coppock and published in in a 1962 issue of Barron’s. It all started when he was commissioned by the Episcopal Church to find long-term investment opportunities for the Church fund.

According to the legend, he asked a group of nuns (or bishops!) how long it took the bereaved to “recover” from their grief. The answer was 11 to 14 months. He took the radical step of thinking that something similar might happen in stock markets after a market high and subsequent downtrend. He assumed that because markets are motivated by emotion, they might be ready to “move on” after a period of 11-14 months of “grief”.

“Crowds do too much too soon”, he wrote. “They overdo. When they get an urge to speculate, their concerted demand forces prices up at a rate far greater than the growth of the company into which they are buying. Likewise, when they liquidate holdings or make short sales during a panicky decline, they ignore basic economic facts. They overdo because they are motivated by emotion rather than reason.”

Edwin “Sedge” Coppock – from Business Insider

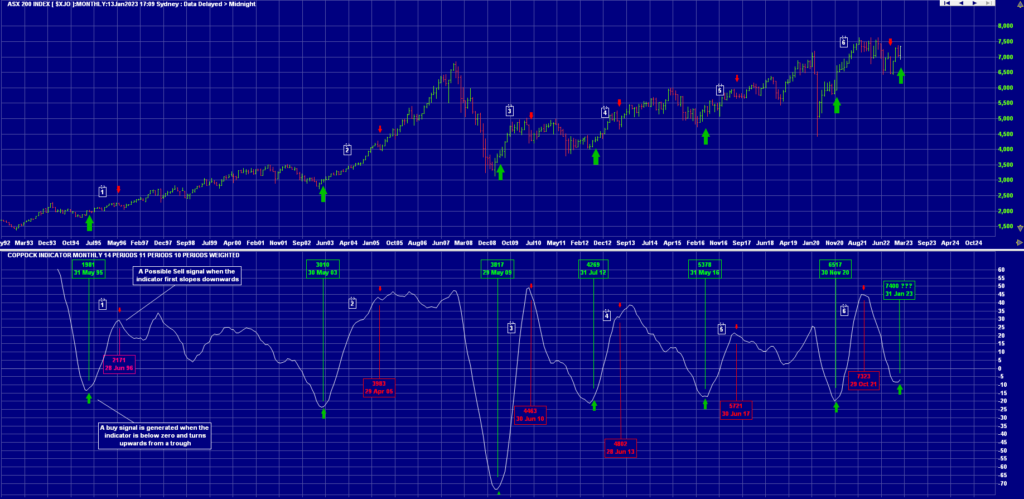
The Coppock Indicator has had an incredible track record in signalling the end of a “bear market”. The signal (Green Arrow) is triggered when the indicator (shown in the lower screen below) bottoms from under the zero line and then slopes upwards.

Monthly chart of the ASX 200 together with the Coppock Indicator below. The green arrows show the “bottom of the market” predictions using the Coppock Indicator. The red arrows show a possible time to sell – Click the chart for better resolution – Incrediblecharts.com

The indicator gives buy signals very rarely, only 6 times in the past 30 years for the ASX 200. But it has just given another one, signalling a buy for the ASX 200. The maths of the curve is a little complex, but it looks for the next uptrend after the market establishes a high and then goes through a 11-14-month “greiving” period.

Is Coppock’s Bollocks?

There is no perfect trading indicator. Coppock designed his indicator to try to establish a “bottom of the market” buy signal to identify long term investment opportunities. He didn’t try to use it as a selling tool. However, there is a trading strategy that uses this indicator after a BUY signal.

  • SELL when the Coppock Curve takes its first downwards trajectory OR,
  • SELL when the Coppock Curve falls below zero

I have trialled both methods and the strongest gain (p.a) results were with the first method. I have marked these sell signals on the chart above with red arrows and tabulated the gain results below.

COPPOCK CYCLEBUY DATEASX200SELL DATEASX200GAINPERIOD(yr)GAIN (p.a.)
131-May-95198128-Jan-96217110%0.6614.5%
230-May-03301029-Apr-05398332%1.9116.9%
329-May-09381730-Jun-10449318%1.0916.3%
431-Jul-12426928-Jun-13480212%0.9113.7%
531-May-16537830-Jun-1757216%1.085.9%
630-Nov-20651729-Oct-21732312%0.9113.5%
 31-Jan-237400??????

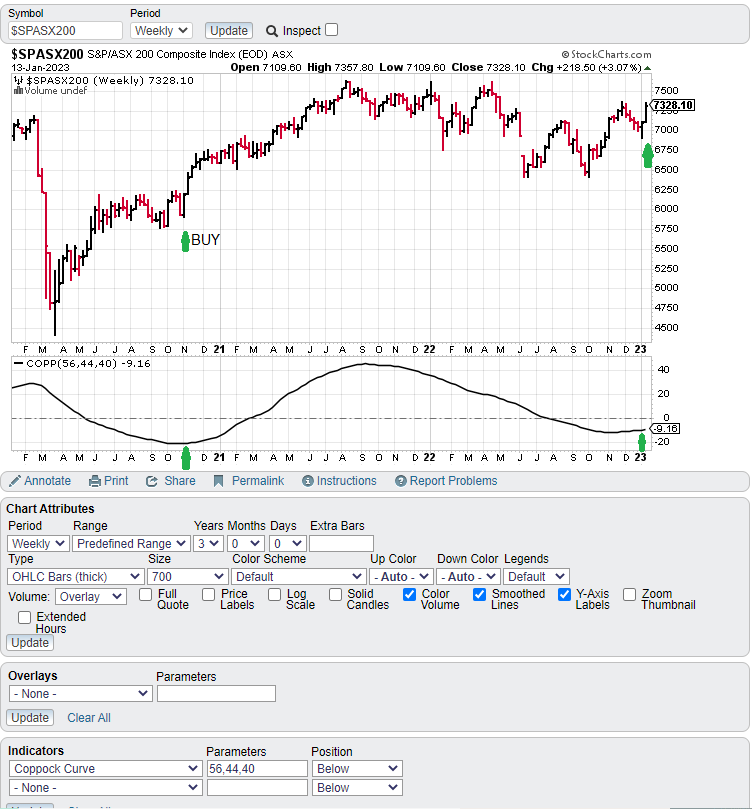
Slack Investor uses Incredible Charts to do all his charting … but their indicator screen can get complicated. To easily follow the Coppock Indicator on any stock, just use the free, but great, StockCharts and put in the same chart attributes below.

ASX 200 Chart from StockCharts – showing stock price on top and the Coppock Curve below.

Slack Investor is a great believer that market timing is difficult and that the best time to buy stocks is “all the time” – by automating your investments so that their is no decision inertia. Use dollar cost averaging.

However, looking at the chart history of this indicator … and the GAIN results in the above table, this is not advice, but now looks like a good time to get into the Australian market. Although, officially, the Coppock results are based on the end of month data. In addition, using Slack Investor’s CAPE valuation method, at the end of December 2022 the ASX 200 was “fairly valued”.

Nuns are not infallible … but mostly wise.

Let’s Lay a Few Bricks … and Mid-Month Update

A 1999 extract from The Sydney Morning Herald showing a 13-yr old Chris Brycki – smartcompany.com.au

Slack Investor will admit to being less than young … but I am still capable of being a “Fan boy” when I see something impressive happening in the financial world.

After a series of schoolboy stock picking successes – winning the ASX’s Share Game a remarkable 3 times and, at university, he entered the JP Morgan Trading Competition, which he also won several times. The talented Chris “the Brick” Brycki, launched into a career with stockbrokers and financial houses. After a while, he started to question the long term performance of fund managers.

“… The problem is that over time, even by being right, the value added is not big enough to counteract the 1% fee that a lot of these fund managers charge.”

Chris Brycki – Stockspot – Livewire

Chris founded Stockspot in 2013 as an alternative way to invest. Their Robo Advice model offers a low-cost automated alternative to traditional fund managers and advisors. After a simple online survey to determine your investing stage and risk tolerance, an investment portfolio type is recommended to you.

Stockspot Building Blocks

Chris, founder and CEO of Stockspot, in 2020 – From smartcompany.com.au

Chris (and Stockspot) have come up with the breathtakingly simple, yet genius (Both Slack Investor and Donald Trump have a loose definition of genius), strategy. After researching thousands of ETF’s and, based on exposure, performance and low fee costs – Stockspot has selected just 5 of them as the building blocks for a range of different portfolios. The portfolios are based on risk tolerance, financial situation and the investor’s appetite for volatility. The five component ETF’s are in Australian Shares (VAS), Global Shares (IOO), Emerging Global Markets(IEM), Australian Fixed Income (IAF), and Physical Gold (GOLD).

ETFSymbol (ASX)1-yr PerformanceGrowth since InceptionManagement Fee
Vanguard Australian Shares IndexVAS-7.92%8.25%p.a (13+ years)0.10%p.a.
iShares Global 100 IOO-4.43%7.37%p.a. (15+yearsr)0.40%p.a.
iShares MSCI Emerging MarketsIEM-20.59%7.18%p.a.(19+ years)0.69%p.a.
iShares Core Composite BondIAF-11.42%2.73%p.a.(10+ years)0.15%p.a.
ETFS Physical GoldGOLD+7.34%7.75%p.a.(19+ years)0.40%p.a.
The five ETF’s that Stockspot use to build their portfolios (1-yr Performance is to 13Oct 2022) – most of these ETF’s have a $500 minimum if you are investing directly.

It is best to disregard the above 1-yr performance – It has just been a bad year for most assets. The ETF management fees are low (depending on ETF complexity), there is good long term performance (Growth since Inception) and they have selected Physical Gold for inclusion.

Slack Investor does not naturally lean into Gold as it is a speculative, non-income producing asset. However, I might have to change my mind here. The reason Stockspot include Gold in all their portfolios is based upon historical data and the way gold tends to outperform in times of crisis. The results in this last year performance of +7.34% for Gold, speak for itself – as other asset classes flounder.

Mixing it all up

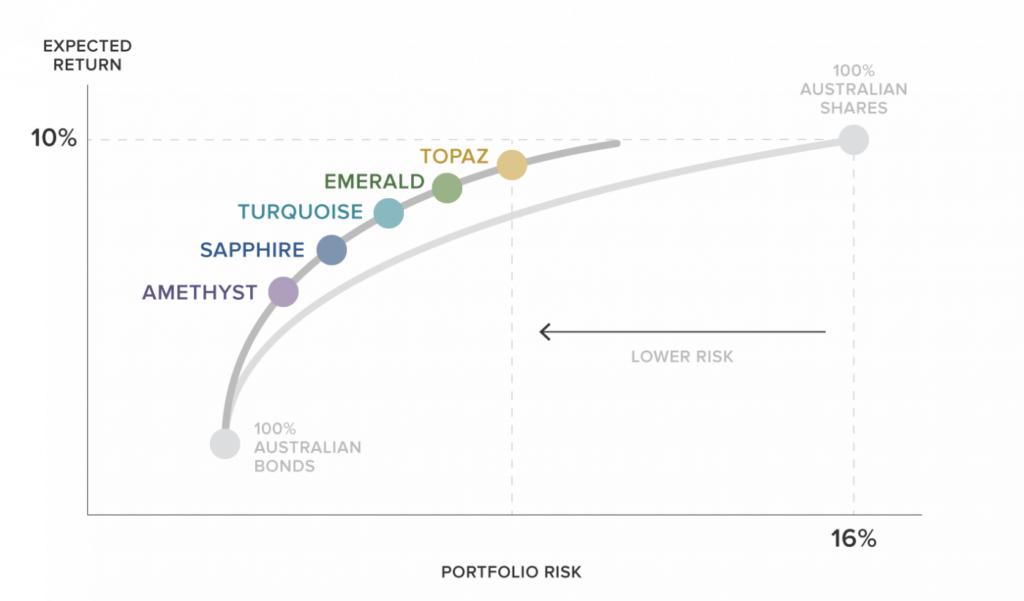
Slack Investor has written about Stockspot before in terms of Robo Advice and their valuable Superannuation reports. By using these 5 ETF’s in various combinations, Stockspot is able to give their customers a combination of returns and risk at a relatively low cost. There are even sustainable versions of each of the below portfolios available. As an example, the moderately conservative Sapphire portfolio is constructed with the following portions.

VAS: 27.2%
IAF: 35.2%
IEM: 14.4%
IOO: 7.9%
GOLD: 14.8%

A chart showing relative risk and return (grey line) of a portfolio varying between 100% Australian Bonds and 100% Australian Shares. The Stockspot portfolios have historically yielded lower returns than 100% Australian Shares) – but only slightly in their most aggressive Topaz portfolio. Overall, through their diversification, the portfolios represent much lower risk.

After fees, over a 5-yr period, Stockspot has outperformed 99% of similar funds over 5 years.

AMETHYST
Conservative
SAPPHIRE
Moderately conservative
TURQUOISE
Balanced
EMERALD
Growth
TOPAZ
High growth
3.1% p.a4.8% p.a5.3% p.a6.1% p.a6.8% p.a
5-yr annual performance (After Fees) – to 30 September 2022 – From Stockspot

There are fees involved for Stockspot to manage your money. For a balance of $200000, they amount to 0.66%. At first blush, these fees (on top of the ETF fees) sound a bit steep to Slack Investor. However, for all types of investors, with a time horizon of at least 3-5 years, for a stress-free place to put your money, this might be exactly what they are looking for. Stockspot do a tailor-made portfolio construction, all the re-balancing of assets and, they take care of all brokerage costs – Not Bad! They even have zero management fees for children accounts up to $10,000 (for under 18s) and the ability to dollar cost average with regular top-ups.

Stockspot does not earn fees from or have a commercial relationship with the ETFs we recommend. We don’t pay professionals for recommending our service to their clients.

Stockspot

Slack Investor can think of lots of situations where people would like a decision-free, low-fee, diverse investment that is designed to grow in the long term. Well done Chris Brycki (and Stockspot), for advancing the investing cause with particular attention to keeping the fees down … you are a Slack Investor Hero.

October 2022 – Mid-Month Update

This image has an empty alt attribute; its file name is trend-1445464__180.jpg

Despite the above discussion, my small-scale market timing experiment continues until its projected end in 2024. My frustration with this experiment continues – as it often goes against one of Slack Investors firm beliefs. If you can avoid it – Do not sell an asset when it is undervalued. Using historical CAPE values, at the end of September 2022, the UK Index (FTSE 100) was 13% below its long term mean, the US Index (S&P 500) was 9% above its long term mean, and the Australian Index (S&P 500) was 7% below its long term mean.

At the end of September 2022, Slack Investor was on SELL ALERT for Australian index shares (ASX 200), the US Index (S&P 500) and the UK Index (FTSE 100). Each of them had broken through their monthly stop loss.

 I have a “soft sell” approach when I gauge that the market is not too overvalued. I generally will not sell against the overall trend but monitor my index funds on a weekly basis once the monthly stop loss has been triggered.

Well … I can see no obvious up-trend at the end of the week for the US and UK markets and will exit at the end of week price of 3583 for the S&P 500 and 6858 for the FTSE 100. I am still just hanging in with the ASX 200 as they had a strong finish to the week.

The Index pages and charts  have been updated for the  UK Index and US Index. 

Market Timing and Share Market Valuation … and June 2022 – End of Month Update

Trying to time the market is a losing game

In addition to the trading … and mostly holding onto individual companies, Slack Investor has been running an experiment on market timing for Index funds in the Australian, UK and US markets. The Index funds have been doing OK .. but Slack Investor is generally just finding that timing markets is just too hard and is hinting at an end to the timing experiment in 2024.

As a recap on the experiment so far, I am still outperforming the “Buy and Hold” investor in all followed markets – but the advantage is slim. Per annum outperformance is 1.4%, 1.9% and 0.6% for the ASX, UK and US markets respectively. Not really fantastic results when you consider that I am missing out on the dividends that “buy and holder’s” receive when I am “timed” out of the markets.

The Slack Index “timing the market” method was devised with a lot of back-testing on 30-years of market performances and does really well when sustained bear markets occur as it gets out of the market at a hopefully early stage in the price downturn. Ideally, the Slack method should stay in the market for the smaller fluctuations (corrections <~10%) and get out of stocks before it becomes a full bear market. The problem with my current strategy is that I am getting “whipsawed” out of the market in these smaller downturns – and the big swings seem to happen so quickly that the damage is done before I can get off the couch.

Things were much easier in the accumulation stage – I had set amounts of money coming out of my pay each month that would be automatically invested into my trading account. With dollar cost averaging, if the market went down, it would just mean that I would be able to buy a greater number of shares – all good.

It is different in retirement mode … as, I am not a net buyer of shares now and, as I am usually am fully invested, it is difficult to take advantage of a lower-priced market. These days, the stock market downturns are just something to be endured.

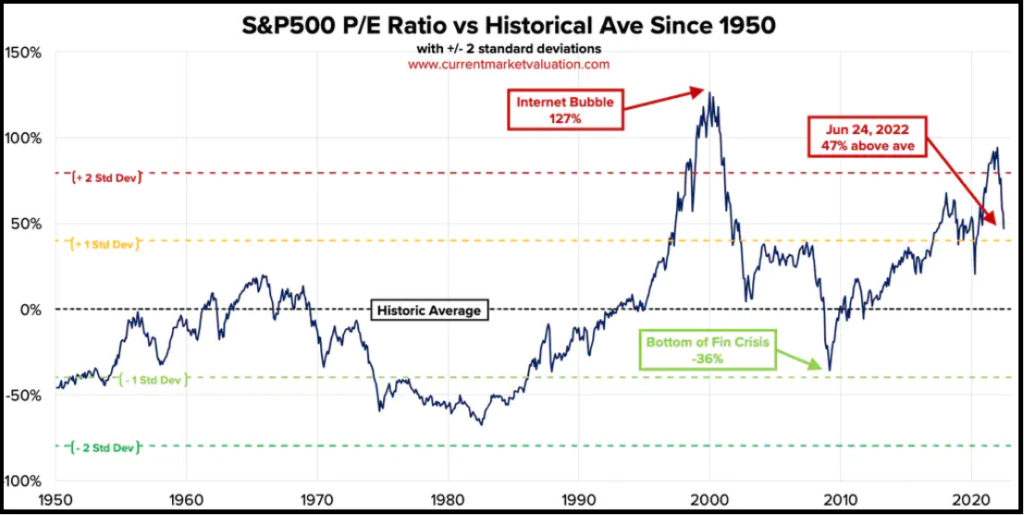
A chart that caught my eye from Current Market Valuation is shown below. They have a developed a method to try to see if a market is over, or under, valued using the cyclically adjusted price-to-earnings ratio (CAPE). This is very similar to the way that Slack Investor has previously tried to work out the valuation of the Australian, UK and US markets.

S&P CAPE data showing the 1950-2022 average (mean) P/E value of 19.8 (baselined as 0%), as well as horizontal bands showing standard deviation bands. As of June 24, 2022, the S&P500 P/E ratio is 47% higher than the 1950-2022 average – From Current Market Evaluation.

Current Market Valuation define the market as “Fairly Valued” if the CAPE Ratio is between between -1 and 1 standard deviation from the “average”. If the CAPE distribution is “Normal”, then the CAPE should be ranked as “Fairly Valued” about 70% of the time. 

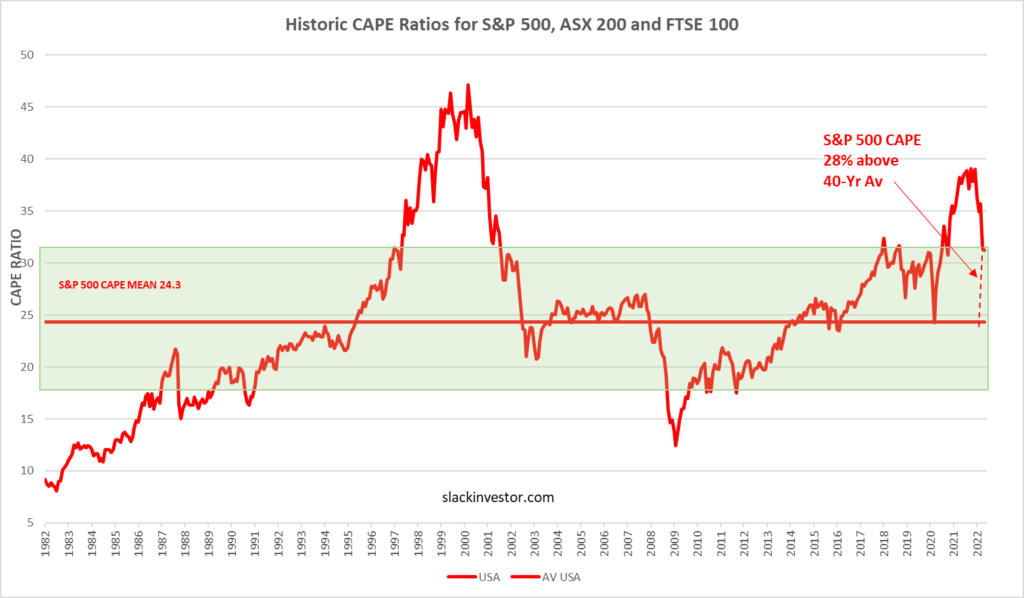
Slack Investor has developed similar charts – but only since 1982. I have used only a short time frame for this analysis as there are good arguments as to why the CAPE should actually rise over time – and a small time range will tend to stop this distortion. The Green shaded areas correspond to the limits of one standard deviation of the CAPE from the 40-yr average values.

Slack Investor S&P 500 CAPE data showing the 1982-2022 average (arithmetic mean) P/E value of 24.3 at the end of May 2022 -“Fair Value” is represented by the green shaded area. Despite recent price drops, the S&P 500 CAPE is still well above average (28%) but at least in the broad “Fairly Valued” range now- Data from Barclays
Slack Investor FTSE 100 CAPE data showing the 1982-2022 average (arithmetic mean) P/E value of 17.5 at the end of May 2022 -“Fair Value” is represented by the green shaded area. The FTSE 100 CAPE is close to its 40-yr mean and well into the “Fairly Valued “range – Data from Barclays
Slack Investor ASX 200 CAPE data showing the 1982-2022 average (arithmetic mean) P/E value of 20.4 at the end of May 2022 -“Fair Value “is represented by the green shaded area – Data from Barclays

Slack Investor gets very nervous when the CAPE charts are well above the green “Fair Value” range. and would love to be a buyer when any of these markets show CAPE values below their 40-year averages.

However, as my “time the market” skills are limited, and my Stable Income pile is still producing, I am prepared to strap in and “enjoy”(not really!) the ride.

June 2022 – End of Month Update

The financial year closes and looking at the 12-month charts for FY 2022 – An official “Bear Market” for the US (>20% fall from a recent high) and big drops in the UK and Australian markets. The “blood in the streets” trend in world index prices have moved the ASX 200 below my stop loss of 6917 – This triggers a sell response.

However, I will not sell against the overall trend. Given that the ASX 200 is bouncing up a little today (01 Jul 2022), this means that I will go to a weekly watch on the ASX 200 – I will now wait till the end of next week to see if the ASX 200 continues to drop – or recovers. I have developed this “soft sell” approach when I gauge that the market is not too overvalued (see above ASX 200 CAPE chart).

Slack Investor remains IN the FTSE 100, TENTATIVELY OUT for the ASX 200, but OUT for the US Index S&P 500 due to a sell in January 2022.

All markets down for the month. The FTSE 100 (-5.8%), the S&P 500 (-8.4%) and the ASX 200 (-8.9%).

All Index pages and charts  have been updated to reflect the monthly changes – (ASX IndexUK IndexUS Index). The quarterly updates to the Slack Portfolio have also been completed.

Greed and Fear – Battling the human condition

Sick Bacchus - Caravaggio Self Portrait
“Sick young Bacchus” a self portrait by Caravaggio (circa 1593) showing himself as the Greek God Bacchus, the god of wine. It is thought that Caravaggio painted this portrait when he was not well – probably suffering from malaria. From the Borghese Gallery, Rome.

Fear and greed are part of the human condition, these traits have evolved over time.

Without the right dose of fear, we would expose ourselves to unreasonable threats and, without the right dose of greed, we would forego opportunities to secure the resources that we need to live.

Fear and Greed: a Returns-Based Trading Strategy around Earnings
Announcements

The fluctuations of the stock markets are just a symptom of these traits. There is a lot of general panic and selling when the stock market starts consistently falling. Stock owners become fearful of further losses and press the sell button. This sets up a chain reaction and the markets fall even further.

A “Herd Effect” exists in the financial markets when a group of investors ignore their own information and, instead, only follow the decisions of other investors.

The herd effect in financial markets – Quantdare.com

It is easy to see how herd behaviour evolved as copying what other individuals are doing can be useful in many situations. For example, if there is an immediate threat, that you haven’t noticed and the herd has – it might save your skin to follow the herd.

Then, of course, there are the good times when the stock market is pumping – the buyers start piling in regardless of the fundamental foundations of the stocks. Asset bubbles often result and a good example of this greed was the “dotcom” bubble in the late 1990’s when big prices were paid for any company that mentioned the internet in its prospectus. Nobody wanted to miss out on, what looked like, easy money.

But these herd behaviours are the opposite of what the astute investor should be doing. We must fight these evolved traits and develop our own behaviours that keep us on the right path.

Savings Automation and Dollar Cost Averaging

Slack Investor has written before about automating your savings. There are also huge advantages to automating your investing – particularly when you are just starting out in the investing world. The first stumbling block that new investors face is to start investing. Then they must develop the habit to keep on investing. There is always a reason to use the money somewhere else or, you might think that right now is not a good time to invest. This “paralysis” must be over come and the best way to do it is through automation.

With auto investing, you don’t have to make the decision when to invest, it just happens automatically when your savings reach a pre-determined point. This opens up the delights of “Dollar Cost Averaging” where, if the market is relatively expensive, you will buy few shares – and if the market is undervalued at the time, your set amount of dollars will buy more shares.

You are buying in the good times and bad . This doesn’t matter – the important thing is that you are buying into companies and accumulating your wealth. Your purchasing is relentless, no decisions, no procrastination – Warren Buffet would be proud!

By investing regularly, in this case, $417 per month, you accumulate shares regardless of the share price. Dollar Cost Averaging buys you more shares when the share price is cheap and less when they are more expensive. – From SeekingAlpha.com

Pearler and Auto Investing

A new kid on the block in the broking business for Australian and US shares is Pearler with distinguishing points of a flat $9.50 brokerage charge and the use of the Chess system for attributing shares to individuals. This means that you are issued with a Holder Identification Number (HIN) and you have direct ownership of your shares. Slack Investor likes this model rather than the custodial model of many other new broking players. Pearler also offers free brokerage on the purchase of selected ETF’s (provided that you hold them for a year).

However, Slack Investor thinks the absolute best feature of the Pearler platform is that it encourages Auto Investing and makes the process simple. If you are serious about your investing journey, you need a broker and why not make it Pearler.

There are some well researched and comprehensive reviews of Pearler and its many features by Captain FI and AussieDocFreedom.

Auto Invest through Pearler is an excellent way to combat the cycles of fear and greed and take the emotion out of your investing decisions.

Other than just opening an account with them, Slack Investor has no affiliation with Pearler.

July 2021 – 5 Years of Slack Investor

Extract from Rembrandt van Rijn “Self-Portrait, 1659” – From the Museo Collection. Enjoy the full image at the National Gallery of Art, Washington

“Rembrandt … says things for which there are no words in any language.”

Vincent Van Gogh

Slack Investor doesn’t put himself in the class of Rembrandt but he admires the honesty of this self portrait at age 53. It is time well spent to look a little further into his amazing catalogue.

Rembrandt, despite incredible talent and artistic output, was known to have lived beyond his means and, he sadly died in 1669 at age 63 as a poor man. He was known to have done over 40 self portraits in his life. Perhaps after 5 years of Slack Investor, it is also a time for self reflection.

Slack Investor doesn’t possess any great financial skills. My financial talents pale in significance with the great investors. I didn’t go to a private school but my government school was one of the better ones and I scraped into a science degree at university. My Physics and Maths marks didn’t put me on the honour board – but I passed. One thing I am grateful for is that my parents instilled a desire to make the most of any opportunities that life presents. Skills that I do have are a willingness to learn and the “stubborness” to complete a task.

Although Slack Investor has been very fortunate in his life with opportunities to travel and work in many interesting countries in his twenties. My own financial story is not really one to emulate. I had a delayed journey to financial independence by returning to Australia at 29 broke, no superannuation, and owing money. My limited skill set was lucky to include the ability to learn from others and to be single minded in pursuit of a goal – that was, to be financially secure.

My journey was greatly helped by going to an investing class by Robbie Fuller, He had selflessly contributed his investing knowledge to a U3A class in Townsville for over 20 years and also ran an evening class for investors. I learned a lot from Robbie. He showed me how to look at a companies sales, debt levels, future earnings and potential growth and to try and assess its real value (fundamental investing). He also opened up the world of charting to me. Looking at a price chart of a company – trends, breakouts and stop losses (technical investing) – and I am grateful. A basic knowledge of the fundamental and technical aspects of investing is so important – and not many people have this knowledge.

However, not everyone can have a convenient investment class in their town. I originally started this blog as a means to show those interested in investing that, by gaining a few skills, you can become a better investor and manage your own financial affairs at a minimum cost – knowledge is power.

Never depend on a single income. Make Investments to create a second source.

Warren Buffet

Slack Investor hopes to keep going. I am sure that Rembrandt had a good life -an enormous creative talent, a love for his wife Saskia, other relationships after his wife’s sad death, a son and a daughter. However, Rembrandt earned much, and he lost much. He was forced to sell his house and most of his art collection for a pittance to avoid bankruptcy in the late 1650’s. A bit of financial self reflection is often required if you want to achieve financial independence – Take control.

Slack Investor’s Favourite Charts

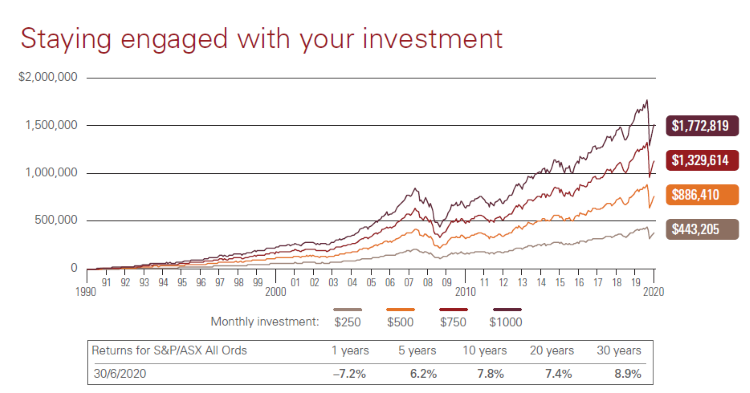
There are lots of great charts on the web. I look forward the release of the Vanguard Index chart every year – and this will be the subject of another post when they release the 2021 chart. However, the chart below drives home the benefits of consistent investing over time – and I like that.

Returns on an Australian Index fund 1990 – 2020 – Vanguard Australia – click for better resolution.

This chart shows the beautiful connection of constant investing and time. Over 30 years since 1990, the chart shows the 2008 GFC crash and last year’s Covid-19 crash. Despite these major downturns. given time, their is always a recovery. An investor who starts with nothing but invests in a US index fund by contributing $250 per month would have compounded $443 205 by the end of 2020. If the investor had increased the monthly contribution to $1000, then the rewards would be $1 772 819.

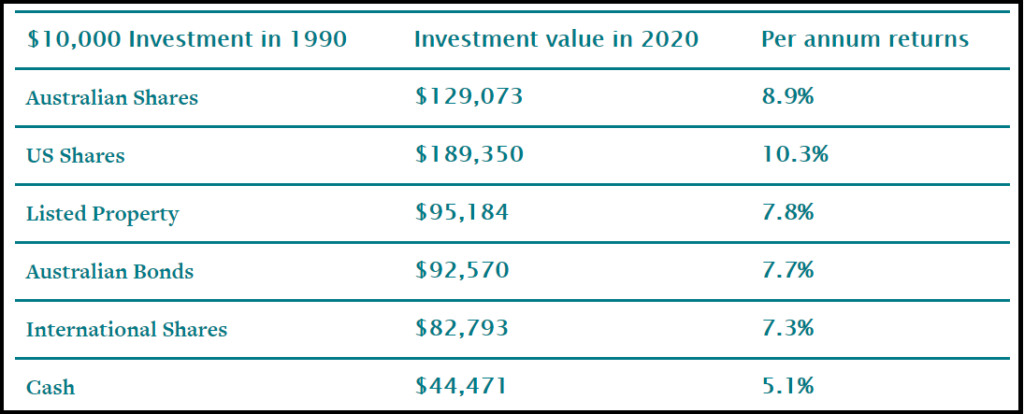
Another way of showing the benefits of time and compounding investing is to look at the average returns on a single investment of $10 000 in various asset classes over 30 years.

Returns on $10 000 after 30 years of Investing in various asset classes 1990-2020 – Vanguard Chart found at Canstar.com.au

3 Most Popular Slack Investor Posts

Ride your own bike

Retirement sweet spot

Chance would be a fine thing