Are CAPEs back in fashion? … and September 2021 – End of Month Update

Superhero Capes That Had A Purpose Vs Those That Didn’t
Photo:© Marvel Studios

Slack Investor is often “banging on” about Price to Earnings (PE) ratios. The economist Robert Shiller designed the even sexier Cyclically Adjusted Price to Earnings ratios (CAPE) which use ten-year average inflation-adjusted earnings to take out some of some of the volatility of annual earnings. The details on how to calculate the Shiller CAPE Ratio can be extracted from Seeking Alpha.
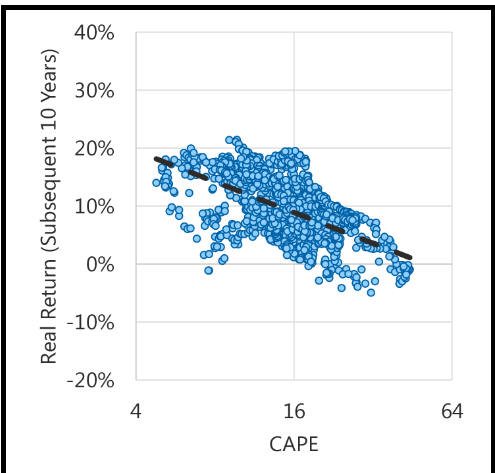
Relationship of annual market returns (over 10-yr period) to current CAPE. From Research Affiliates – based upon Shiller Data

Professors Shiller and Campbell found that, the higher the CAPE, the lower the likely annual return from equities over the following 5-20 years. The current US CAPE is at one of its highest levels since the 1880’s. GuruFocus provide current information on the S&P 500 CAPE and market return predictions based on Shiller’s work.

What originally started me thinking of CAPE is this excellent visualization prepared by John Kingham of Seeking Alpha for the UK FTSE 100. This chart shows how the current FTSE rates with fair value at a glance. John uses a “Fair Value” UK CAPE of 16 -just a bit below its recent average of 17.5. The UK CAPE black line seems still in “fair value” territory – according to Shiller, this is generally OK for a buyer in terms of long-term returns.
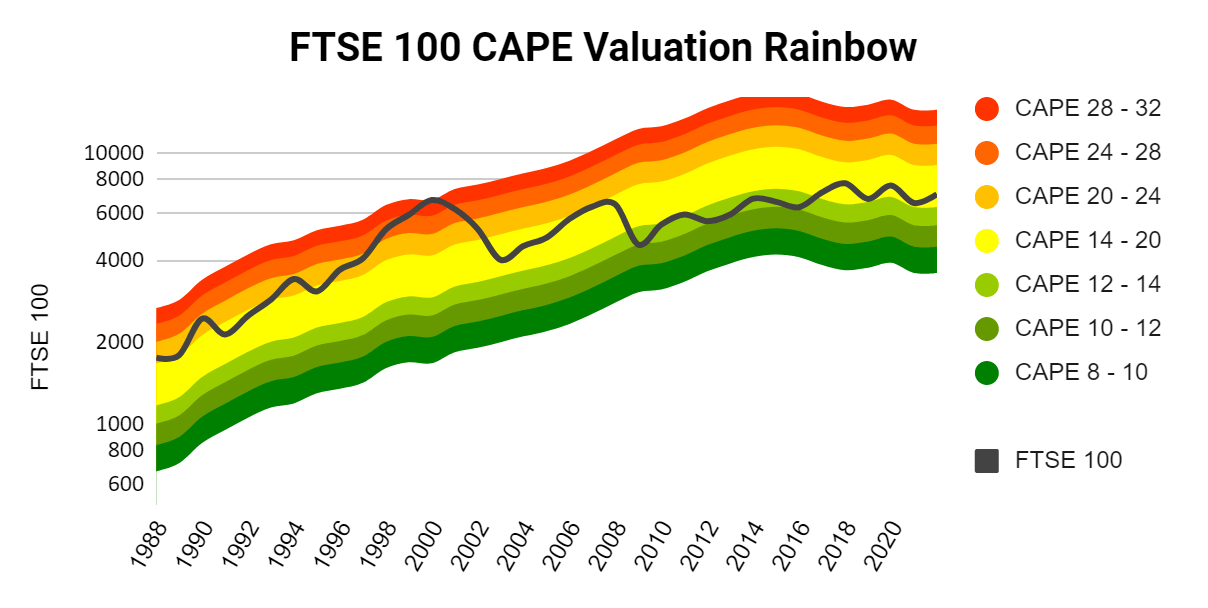
This chart of the UK FTSE 100 CAPE from Seeking Alpha. The FTSE CAPE is the black line and John Kingham has prepared the CAPE zones to indicate GREEN = cheap, YELLOW = fair value, RED = expensive (75% above the mean) – Click for higher resolution

There have been a few criticisms of the use of CAPE as a predictor, as it has consistently underforecast returns for the past 25 years. Since the original research, new accountancy rules have brought significant changes to the way that company earnings are calculated. There are also arguments that CAPE values are structurally much higher now as the result of cheap money from the 40-yr decline in bond yields.

Graph B1: 10-year Government Bond Yields
Cheap money has changed things – From the Reserve Bank Australia

We are also in times of high government stimulus and, with interest rates so low, there is more than the usual amount of money in the share market. It is a case of no other alternative – perhaps, with the exception of residential property.

Slack Investor has no idea whether the extremely high US S&P 500 CAPE values may continue for a while … It is a complicated market at the moment. With the US Market at 38 times the 10-year average earnings … the US Market Is Not Cheap and, I am glad that my stop losses for index funds are set tightly within 10% of recent highs in the share price.

The rich data on CAPE ratios for a range of countries is prepared lovingly by Barclays each month. The CAPE values of the US S&P 500 CAPE, ASX 200 CAPE and the FTSE CAPE are respectively, 61%, 19% and 0% above their 39-yr averages. Interestingly, the US market CAPE (24.5) has a far higher mean than Australia (20.4) or the UK (17.5). This may be due to higher earnings growth prospects in the US.
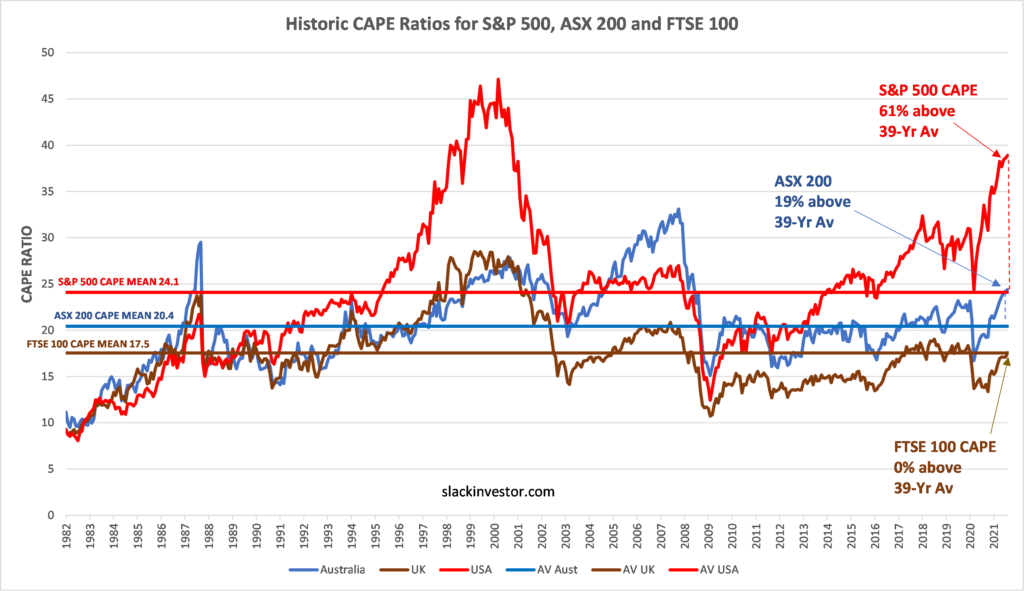
Historic CAPE Ratios for the S&P 500, ASX 200 and FTSE 100 together with their 39-year averages – Developed with data from Barclays

Is CAPE a good predictor of a market correction/crash

In the below chart I mapped the US S&P 500 against the S&P 500 CAPE to see if the CAPE is useful for determining market turning points.
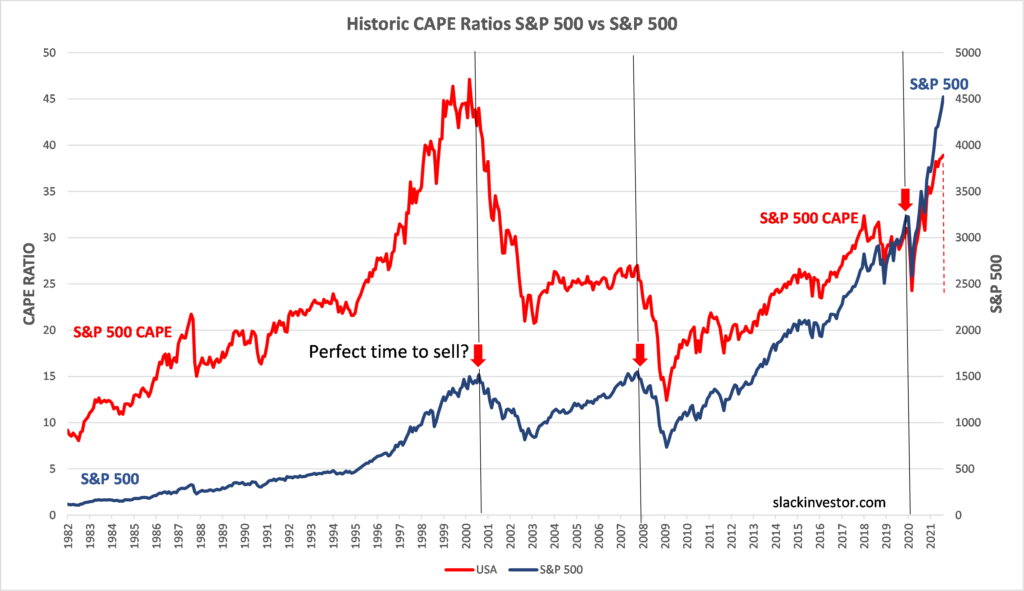
The CAPE indicator does not seem to be a good predictor of short-term share market prices – as high CAPE values have been at sustained high levels for many years. CAPE trends seem to immediately mirror the trends in the share price. However, Professor Shiller’s established relationship with high CAPEs and lower forward returns in the longer term is hard to ignore. Interest rates will not stay low forever. Regardless of the unusual circumstances of todays stock market, the US market at 61% above its 39-yr average, looks expensive.

September 2021 – End of Month Update

This image has an empty alt attribute; its file name is trend-1445464__180.jpg

Slack Investor remains IN for Australian index shares (ASX 200), the US Index (S&P 500) and the UK Index (FTSE 100).

After 11 months in a row of monthly stock rises for the ASX 200, things are starting to get a little jittery in the stock markets. This is just normal behaviour. Decent monthly falls for the ASX 200 (-2.7%) and S&P 500 (-4.8%), the FTSE 100 flat at -0.2%.

All Index pages and charts  have been updated to reflect the monthly changes – ASX IndexUK IndexUS Index. The quarterly updates to the Slack Portfolio have also been recalculated.

Financial Year 2021 Slack Results

“In the business world, the rear view mirror is always clearer than the windshield.”

Warren Buffett 

Slack Investor has a proven track record in not being able to predict where speculative assets (such as Bitcoin or precious metals) are going. I would also add to the “speculative list” some companies whose share price have become divorced from the link to their actual earnings. As a rough guide, I try not to invest in companies that have a forward P/E ratio of greater than 50. I get these forward P/E ratios from the excellent Market Screener site.

This means that I have missed out on the great gains of being by in companies like Afterpay (APT – 2023 P/E ratio 190) or TESLA (TSLA – 2023 P/E ratio 193). Some folk have made a lot of money with these companies …. but they are just too speculative for me. Slack Investor tries to “stick to his knitting” with growing companies that have an established earnings record and forward P/E ratios <50.

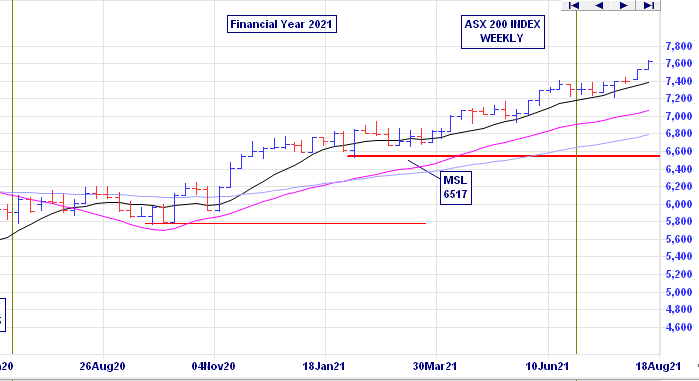
After an eventful FY 2020 and the COVID-19 dip in the markets around the world. FY 2021, has seen very good gains for most global markets. In the UK, the FTSE 100 Total Return Index is up 18.1% (last FY 20 down 13.8%). Dividends helped the Australian Accumulation Index to be up 27.8% for the financial year (last FY down 7.7%). These Americans remain stupendously optimistic … the S&P 500 Total Return Index was UP 36.4% (last FY up 12.0%) for the same period. All of these Total Return Indexes include any accumulated dividends, wheras the chart below of the ASX 200 for FY 2021, just shows stock prices.

ASX 2oo Weekly chart for FY 2021 – started at 5897 and finished at 7313 (30 June 2020 – 30 June 2021) – Incredible Charts – Click for better resolution.

Slack Portfolio Results FY 2021

All Performance results are before tax. The Slack Portfolio had a cracking year with annual FY 2020 performance of +21.7%. Full yearly results with benchmarks are shown in the table below. It was also a top year for all benchmarks (Median Balance Fund +13.0%, Vanguard Growth Fund +20.3%, ASX 200 Accumulation +27.8%).

Against all Slack Investor predictions … Real Estate turned out to be a great investment in the Brisbane and Melbourne markets for FY 2021 (+17.9% and +10.7%) – Perhaps I should also give up on the “looking ahead” in the residential property market – I just don’t get it!

YEAR SLACK FUND MEDIAN BAL VGARD GROWTH ASX200Acc RES BRIS RES MELB CASH CPI
2010 6.6 9.8 12.3 13.1 10.8 26.9 4.2 3.1
2011 2.5 8.7 9.1 11.7 -2.4 0.9 4.4 3.7
2012 8.3 0.4 1.3 -6.7 1.3 -0.9 4.3 1.2
2013 26.5 14.7 18.6 22.8 7.7 8.3 3.2 2.4
2014 23.6 12.7 14.5 17.4 11.5 12.8 2.6 3.0
2015 2.4 9.6 11.8 5.7 7.7 15.6 2.5 1.5
2016 14.2 3.1 4.2 0.6 8.4 9.5 2.2 1.3
2017 19.5 8.1 8.8 14.1 6.5 17.7 1.9 1.9
2018 37.6 7.2 10.0 13.0 5.2 3.9 3.9 2.1
2019 19.7 6.2 9.8 11.5 1.7 -6.0 2.0 1.3
2020 9.4 0.3 0.6 -7.7 8.4 13.8 1.1 -0.3
2021 21.7 13.0 20.3 27.8 17.9 10.7 0.2 3.8

The Slack Fund yearly progress vs BENCHMARKS. The Median Balanced Fund (41-60% Growth Assets)Vanguard Growth FundASX 200 Accumulation IndexCorelogic Residential Property total return in both Brisbane and Melbourne, and Cash (Australian Super Cash Fund) and Consumer Price Index (CPI)

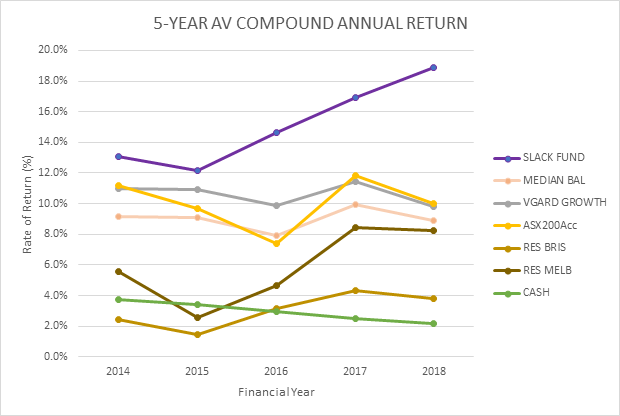
The five-year compound annual performance gives me a much better idea about how things are going and will smooth out any dud (or remarkable!) results.

Slack Investor 5-year compound annual rate of return – compared to benchmarks – Click for better resolution.

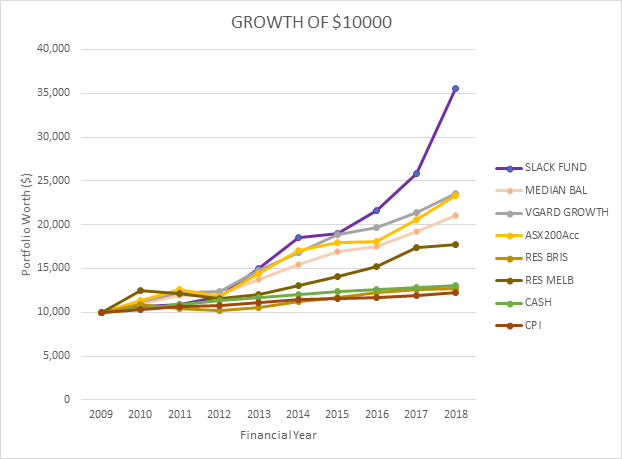
The beauty of compounding with a succession of good performance results can be seen in the chart below showing the growth of an initial investment in June 2009 of $10000.

The rate of growth of $10000 invested by Slack Investor in FY 2009 – compared to benchmarks – Click for better resolution.

The lessons of long term investing

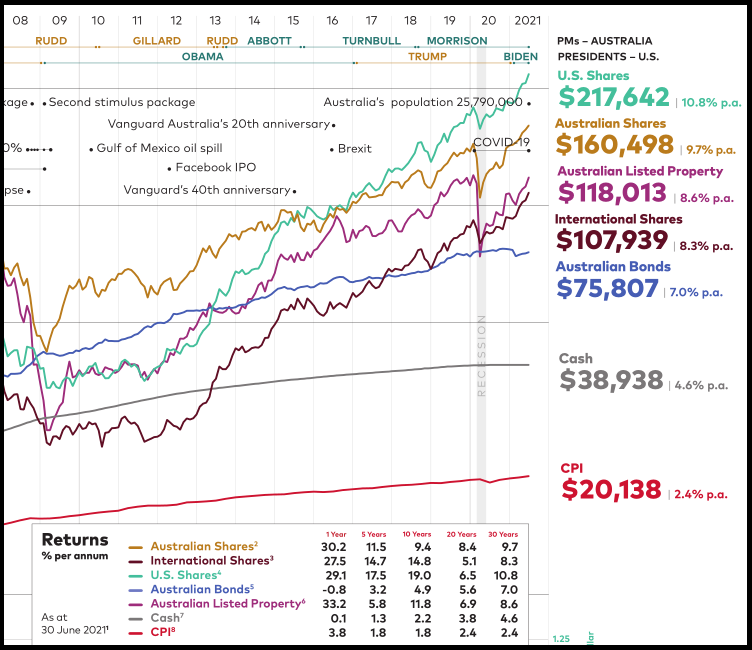
Every year Vanguard publish their performance data on each asset class. Slack Investor looks forward to this – as it reminds him of the power of the appreciating asset classes of Shares and Property. Vanguard highlights the volatility of asset values in the short term – but also emphasizes the joys of holding and accumulating shares or property for long periods of time. These asset classes have steadily increased in value over the last 30 years. $10000 invested in Australian Shares in 1990 would have compounded to $160 498. Staying in Cash would have yielded $38 938.

2021 Vanguard Index Chart

Extract from the 2021 Vanguard Index chart (Just the 2008-2021 portion) – the dollar values on the right are the results of investing $10000 in index funds in each asset class for 30 years (since July 1991). – Check out the full glory of the Vanguard 2021 PDF chart – Click for better resolution.

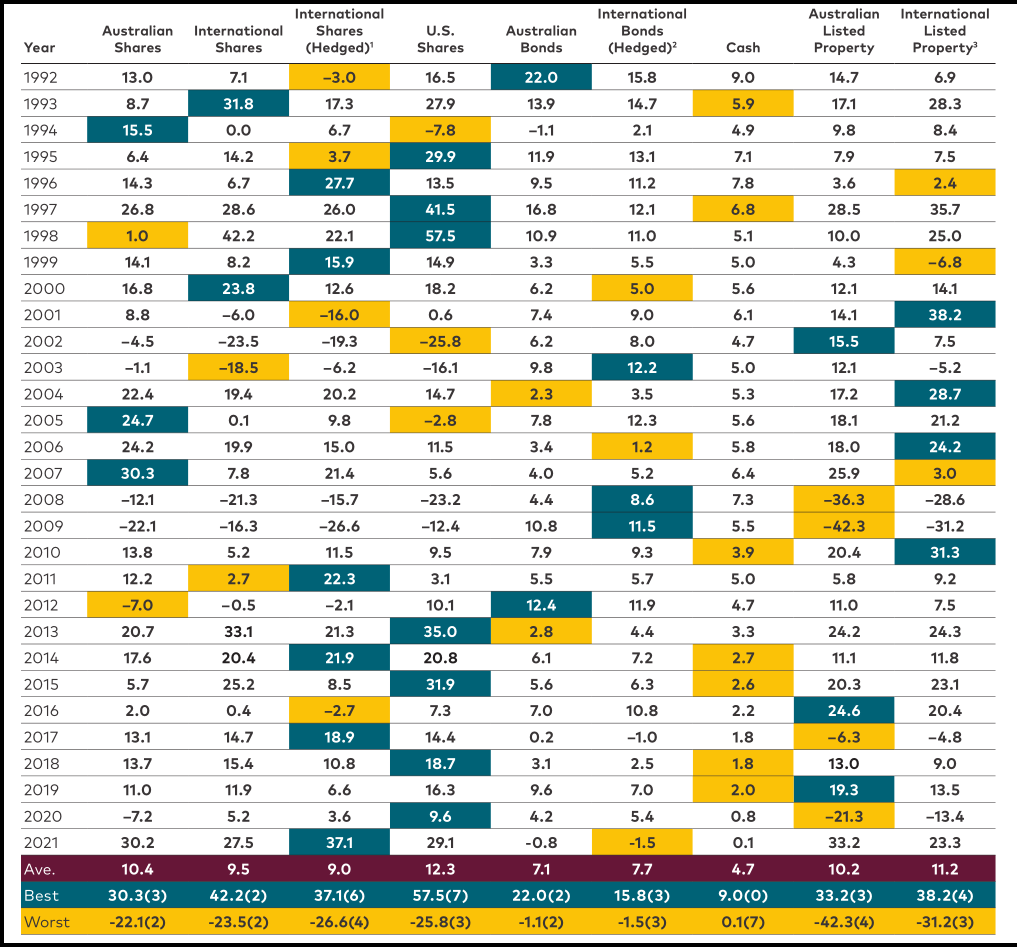
Financial year total returns (%) for the major asset classes

In the chart below, for each asset class the total annual returns are given and the best performing class for each year is marked in green … and the worst in gold. What stands out to Slack Investor is that is rare for and asset class to lead in annual returns (green) for two years in a row – and there are years where the leading asset class (green) becomes the worst performer (gold) in the next year. This drives home the often repeated sentence in the finance world.

Past performance is not a guarantee of future results.

Total returns for each asset class for the 30 years since 1991 – Check out the full glory of the Vanguard 2021 PDF – Click for better resolution.

This table highlights the benefits of diversification across asset classes for the long term investor.

Sitting on the couch, Slack Investor is quietly pleased with his 2021 results – Roll on Financial year 2022. However, when comparing this year’s bumper returns with the long term average returns for Australian and International shares of around 10% – Slack Investor can’t help but be a little nervous.

.

Euphoria … and April 2021 – End of Month Update

People, Football, Footballers, Group, Team Sport

“Bull markets are born on pessimism, grow on skepticism, mature on optimism and die on euphoria.”

Sir John Templeton

John Templeton (1912 – 2008) was a great investor, fund manager and philanthropist. He is best known for setting up the Templeton Growth Fund which averaged returns of over 15% per year for 38 years. Slack Investor salutes this kind of behaviour and listens when great investors say something. If Mr Templeton is right, this game should be pretty easy and we wait till the “Euphoria” sets in and the we sell … Right?

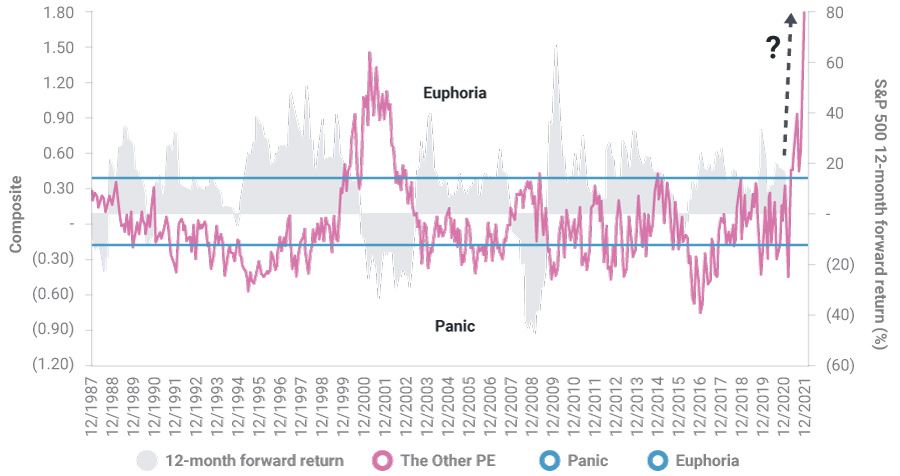
Well, according to the CitiGroup Panic and Euphoria Index , which looks at sentiment in the market back to 1950. The section from 1987 through to the start of 2021 is shown below – Euphoria is already well and truly established by December 2020. However, most markets have gone up considerably further since then!

Source: Haver Analytics, Pinnacle Data, and Citi Research – diamondportfolio.com.au – Click image for better resolution

This is a bit of a complex chart, and the grey solid columns represent the return from the US Stock market for the next 12 months (forward return) and the Magenta line is the Citibank Euphoria Index which tracks market sentiment.

Visually, it looks like whenever the Euphoria Index (LHS – Magenta) goes to a high value, there is a downturn in the next 12-month return (RHS – Grey). Citibank have defined a range (Blue Lines) where the market is operating “normally” and outline areas of Euphoria and Panic when the market is beyond that range. According to Citibank, we are in a period of Euphoria and the prospect of good returns in the next 12 months looks bleak. The Chief Economist from Citigroup, Tobias Lekovich, suggests that there is a “100% historical probability of down markets in the next 12 months at current levels.” – that proclamation was made 5 months ago.

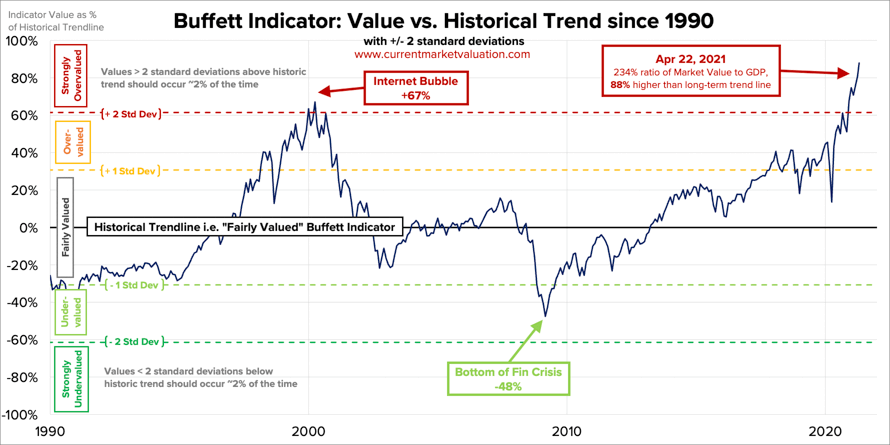
Another Slack Investor hero, Warren Buffet, talks about the ratio of total United States stock market valuation to US Gross Domestic Product (GDP). This is now known as the “Buffet Indicator” – and, although he admits to its limitations, it still is “the best single measure of where valuations stand at any given moment. At April 22, 2021 the Buffett Indicator is calculated to be 234% – the highest value since 1950. In contrast, the Australian market using this indicator is either “fair valued” or “modestly overvalued”

From Current Market Valuation – The Buffett Indicator is the ratio of total US stock market valuation to GDP – Click image for better resolution

By our calculation (the US Stock Market) that is currently 88% (or about 2.9 standard deviations) above the historical average, suggesting that the market is Strongly Overvalued

Current Market Valuation

There are a lot of current examples of “investor exuberance” in the stock markets – particularly in the US. There is no doubt that the pricing of some companies has got well out of hand. The earnings of a company are critical when I look at my investments.

Another risk is that pockets of the market at the moment appear to be speculative bubbles. You can easily tally about US$5 trillion of assets, from cryptocurrencies to Tesla, that are not underpinned by any fundamental earnings. They’re speculation. And if these bubbles were to pop, that could drag down a wider range of investments.

Hamish Douglas, Magellan Financial Group – Livewire Interview

There are a group of companies that I like that I have no intention of selling – because they have a good track record of increasing earnings and there future prospects look good – no matter what the market does in the short term. There is also about 40% my portfolio in stocks where I am not so sure of their long term prospects. It is these stocks that I will be watching closely at the end of every week and have set stop losses that will indicate to me that I should sell if the price falls below the stop loss.

Slack Investor is happy to go along for the ride and has no real faith in his prediction ability. Sure, stocks are at extreme valuations but these are very unusual times. Interest rates are very low and there has been an unprecedented amount of government spending to keep economies going along.

Still on the couch, I don’t feel euphoria … but I feel OK … I have a plan.

April 2021 – End of Month Update

Despite the “exuberance”, Slack Investor is still on the wave and remains IN for Australian index shares, the US Index S&P 500 and the FTSE 100. All Slack Investor followed markets this month had strong rises (ASX 200 +3.5%; FTSE 100 +3.8%; S&P 500 +5.3%).

In these uncertain times, especially with the high prices on the US market, I am monitoring my index funds weekly and if, at the end of the week my Index funds are below the stop loss, then I will put a post on the blog and sell at the next opportunity. All Stop Losses are Live.

All Index pages and charts  have been updated to reflect the monthly changes – (ASX IndexUK IndexUS Index).

Two Very Important Numbers

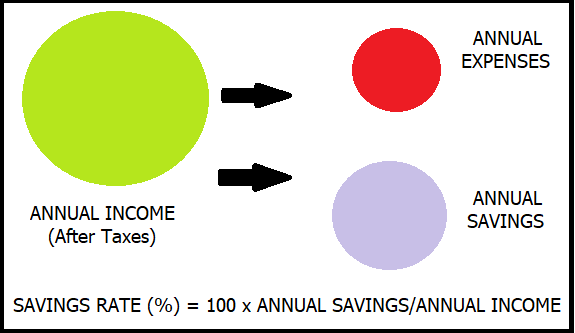
There are many numbers to note in finance world – Fees, Investment returns, etc. However, there are two extremely important numbers when it comes to financial independence. Both are percentages and the first one is the 4% “rule of thumb” and the second is your savings rate.

The 4% Rule

All followers of finance blogs would have heard of this often quoted “rule” Slack Investor acknowledges that this magic number is arguable and depends on individual circumstances but, it is an excellent way to estimate how much you will need to retire. The 4% rule is a way to “roughly” link assets with income. For example, as an estimate, if you would like to generate a $40 000 yearly income, you would need to have investments assets of $1 000 000 to earn this income using the 4% rule (4% of $1 000 000 = $40 000).

Another way of looking at this 4% rule is that you need to save 25 x your annual spending for your retirement fund so it can generate an income to cover your spending. So, if you spend $30 000 a year, you need a portfolio of $750 000 (25 x $30 000). To get an idea about what your expenses are it is important that you track them over a year using a spreadsheet or finance software. If necessary, this investment income can always be supplemented by a government pension or a part-time job.

Bill Bengen originally came up with this “4% safe withdrawal rate” in 1994. He developed it by backtesting a conservative US portfolio with data dating back to 1920 and tried to get a safe withdrawal rate that would generate an income for at least 30 years. He is the first to admit that the 4% number was always treated too simplistically and has since updated the rate to be closer to 4.5%.

Slack Investor is a bit old fashioned in liking to hold on to most of the capital that is earning the money and has a flexible approach to how much to extract from investments each year. In a good year for the stock markets, I am happy to dig deep into the investments pile – using dividends, distributions and even some capital gains as income. When the market performs poorly, it is more complicated and I have to dip into my stable income pile. Most of the Slack fund is in Australian Investments and in 2021, the Australian Index has a 12-month forward dividend yield of 3.5% . Hopefully, the shares will also increase in value over time. Over the past 10 years, Australian shares had a total return of almost 7% – with growth shares you can aim higher, but prepare for volatility. In the good years, I will also take out a bit of capital gain for extra spending. All of this is in addition to the stable income component of my investments.

Your Savings Rate

“Wealth consists not in having great possessions but in having few wants.”

Epicetus

Using the 4% rule we estimate how much will give us a sustainable retirement. But there is another number to add to our arsenal.

Just as in Lord of the Rings there is ” one ring to rule them all…”, there is also one “percentage” to rule them all in the Financial Independence world – and that is the Savings Rate percentage.

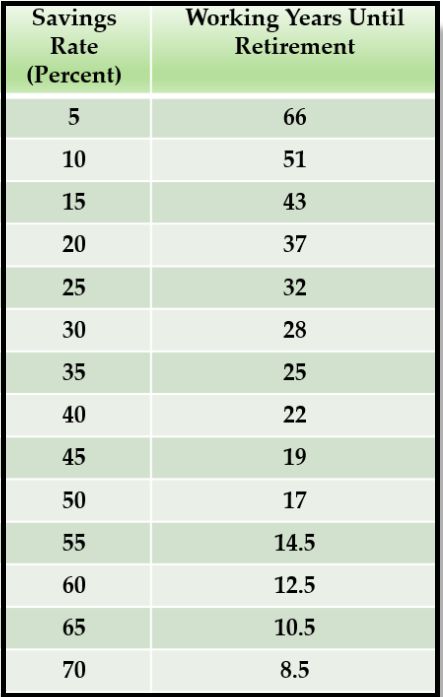
The annual expenses is critical here as this is the figure you are trying to generate out of investment income. Lets have a look at the effect that savings rate has on the number of years that you have to work until you can sustainably generate your expenses from your investments. The table below is from the great financial blogger Mr Money Mustache. There are a few assumptions used to generate this table

Here’s how many years you will have to work for a range of possible savings rates, starting from a net worth of zero:

At a saving rate of 10% you will have to work for over 50 years – we have to do better than that! There are some pretty heroic savings rates amongst financial bloggers e.g Aussie Firebug 61%; Dividends Down Under 61%; I have admiration for these savings rates and note that these bloggers are in a hurry to get to financial independence – and retire early. At 60% savings you can retire after 12.5 years of working and saving – but that sounds pretty hard.

Slack Investor was on a much slower train and lucky that he quite enjoyed his job – and didn’t mind spending 30 years saving for his retirement. I have always been a good saver but, when looking at my past savings rates, it was usually around the 30-40% level and, some years had dropped down to 20%. Raising a family and holidays are a delightful interference with savings and you just have to find a balance. In Australia, we have compulsory superannuation which currently adds a welcome 9.5 % to your savings rate.

A beautifully presented calculator at Networthify shows how the savings rate works and gives a yearly breakdown. It also shows some interesting OECD statistics for average National savings rates (e.g. The US 6%, and India 32%). The aim is to eventually save enough money to invest in a way that you average (at least) 5% return on your investments after infation. If you withdraw from this retirement pool at the rate of 4% and have enough to cover 100% of your expenses – you become financially independent – the retirement pool keeps on giving!

Automate your savings

One of the best financial habits that I formed was to take the thinking out of saving and set up automatic recurring transfers from my work money to my savings or investment accounts – Pay Yourself First. I also took full advantage of “concessional contributions” to my super account which were taxed at 15% rather than my then marginal rate of 37%.

So, automate your savings. Investment returns are important and we hope that we can exceed the 5% after inflation returns that the above table and 4% rule are based on. However, the number you have most control over is your savings rate – and that is most important.

Colin Nicholson – A Great Australian Investor … and February 2021 – End of Month Update

I have a few people that have greatly influenced my investing life – One such figure is Colin Nicholson. I have never met him, but he has taught me a vast amount through his long running website “Building Wealth Through Shares” (bwts.com.au).

This great Australian investor Colin Nicholson, has been investing for over 50 years and documenting his adventures with shares since 2001 on his site. Colin has only stopped actively contributing at the end of 2019. Fortunately, this website is still running and his knowledge and experience keeps on giving. As well as education material on technical and fundamental analysis, he often discusses the psychology necessary to be a successful investor.

We tend to have an impulse to snatch profits quickly and to let losses run, hoping things will come good if we hold on. This natural impulse is the exact opposite to what a successful investor must do.

Colin Nicholson

Colin started bwts.com.au when financial blogs were in their infancy and Australian contributors were rare. Colin is a private investor, an author, and educator. He has been contributing to his site for over 20 years and answered hundreds of questions from other investors. His site is an incredibly detailed knowledge base covering all aspects of owning a share portfolio. His Investing – Twelve Key Lessons is essential reading to anyone thinking of entering this fascinating world. His results over a 20-yr period are very impressive. Colin has retired from active contributions to his website but has hinted that he would maintain his website for the education of future investors.

There are countless bits of wisdom as Colin relentlessly tackles investment according to a defined, well-tested, and logical plan. No matter what the investing subject, search his site, and Colin Nicholson will offer some useful and reasoned discussion.

The source of most frustration in investors is that they are expecting the impossible. They want to sell at the top. I repeat that it simply cannot be done except by sheer luck.

Colin Nicholson – Take Profits or Wait for the Stop-Loss?

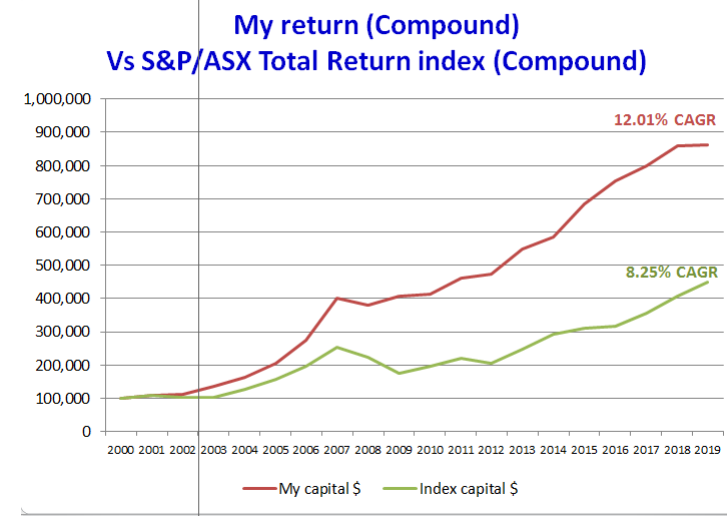
My first introduction to his site was through his meticulous documentation on how he calculated his end of financial year performance returns. Year after year he would list his portfolio and investment returns.

This image has an empty alt attribute; its file name is ColNichReturn.png
Colin Nicholson’s documented returns over 20 years comparing his returns(red) and the ASX 200 accumulation index (green). A 12.01% Compound Annual Growth Rate (CAGR) is very impressive over a 20-yr period and has enabled Colin to have a hopefully financially carefree retirement.

… I do not wish to advise people or to manage their money. Rather, my focus is on my own investments and passing on what I have learned to others.

Colin Nicholson

In addition to his website and public speaking, Colin has also authored Building Wealth in the Stock Market and Think Like the Great Investors. Like another of Slack Investor heroes, Warren Buffet, Colin has a plan for “retirement mode” and intends to become more passive with his investments and half of his portfolio is now in LICs and index funds.

I am not retired – I am a full-time investor

Colin Nicholson

Colin Nicholson, Slack Investor salutes you for your enormous contribution to my investment life and for helping countless others with your education materials and your disciplined and methodical approach to investing in shares. Dive deep and long into bwts.com.au and you will be a better investor.

February 2021 – End of Month Update

Slack Investor remains IN for Australian index shares, the US Index S&P 500 and the FTSE 100.

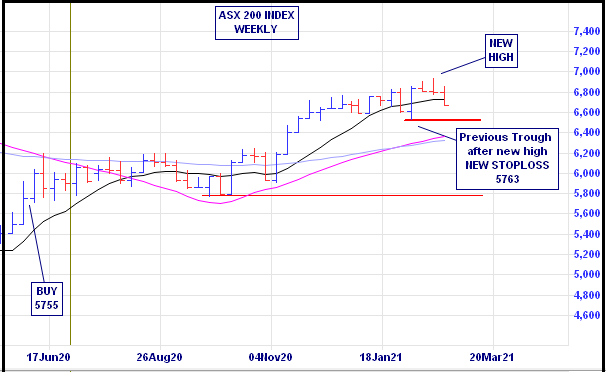
When having a look at the end of month charts, I noticed that all index trackers were well above their stop losses (>16%). My Mum (and Kath and Kim) would say that she could “feel it in her waters” when she had a premonition about something. My index rules allow the end of month stock price to be up to 20% above the stop loss. However, in a tip of the hat to Mr Nicholson, who is far more disciplined than Slack Investor in the investing arts, some action this month. As “new highs” have been established, I decided that now wouldn’t be a bad time to adjust the stop loss levels upwards.

I place my stops below the low of the last trough in the uptrend and move it up to just under the next trough every time a new high is made for the trend.

Colin Nicholson
Weekly Chart of the ASX 200 Index – incrediblecharts.com

For February 2021, there were falls in the growth oriented Slack Portfolio due to rising long-term bond yields. But stock prices have always fluctuated above or below a “fair price” – for one reason or another. Slack Investor is still on the couch.

Tech stocks are susceptible to rising yields because their value rests most heavily on future earnings, which get discounted more negatively when bond yields go up.

From The Bull

Despite the end of month sell off, there were modest rises in all followed index funds (ASX 200 +1. 0%, S&P 500 +2.6%, and the FTSE 100 +1.2%). All Index pages and charts  have been updated to reflect the monthly changes – (ASX IndexUK IndexUS Index).

Financial Year 2020 Slack Results

Peter Lynch

“If you can follow only one bit of data, follow the earnings — assuming the company in question has earnings. … What the stock price does today, tomorrow, or next week is only a distraction.”

Peter Lynch, One Up On Wall Street:

The great investor Peter Lynch had plenty of “solid gold” insights that Slack Investor has tried to incorporate into his investing. I have long extolled the virtues of growing companies with high Return on Equity (ROE). But, before I invest, I look at the earnings and projected earnings of each company at an aggregate site such as the most excellent Market Screener – Registration is free!

For example, the current market darling Afterpay (APT) is an excellent business idea and has performed extremely well for those who own it (Up 163% FY2020). APT may be a very successful company – but it is not expected to have positive earnings till 2022. From the earnings table below, both Slack Investor and Peter Lynch would be reluctant to stump up $66 to earn $0.28 in 2022.

June FY
EPS
2017
2018
-$0.04
2019
-$0.18
2020
-$0.16
2021
-$0.01
2022
$0.28
Annual Earnings per Share (EPS) for ASX listed Afterpay (APT) from MarketScreener

Slack Investor tries to get things “mostly right” and fills his portfolio with companies that Peter Lynch would hopefully approve of – There are no Afterpay’s, but many other growing companies that have an established earnings record – There will probably be some temporary downgrades to earnings in the Slack Portfolio this year due to the virus. I could never match Peter Lynch’s legendary performance, where he grew his Magellan Investment Fund from 1977 until 1990, at an average 29.2% annual return – roughly twice the gains of the S&P 500 at the time.

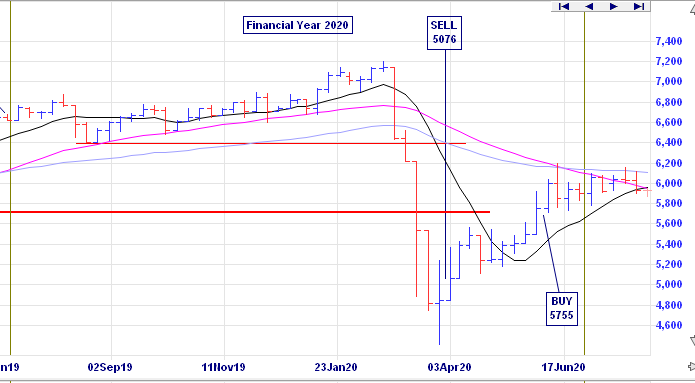
Things were going along swimmingly for FY 2020 till mid-February and the rapid spread of COVID 19 around the world. For FY 2020, the worst performing followed index was the UK, with the FTSE 100 Total Return Index down 13.8%. Dividends helped the Australian Accumulation Index to be down 3.7% for the financial year. These Americans really believe in their stock’s ability to keep earning during this recession (maybe Slack Investor has a twinge of doubt here) … the S&P 500 Total Return Index was UP 12.0% for the same period. All of these Total Return Indexes include any accumulated dividends, wheras the chart below of the ASX 200, just shows stock prices.

ASX 2oo Weekly chart for FY 2020 – started at 6618 and finished at 5897 (30 June 2019 – 30 June 2020) – Incredible Charts

Slack Portfolio Results FY 2020

Slack Investor has three financial pillars to keep himself steady. I will expand on these in a later post.

  • House – Home ownership gives me great security and pleasure. The bank owned most of this 30 years ago – but now I have the upper hand! (~30% of Net Worth)
  • Income – This used to be my job, but in retirement I have some stable income annuity style investment (~20% of Net Worth) that would pay my bills and maintain a basic Slack Lifestyle should Armageddon befall the stock markets for a few years. This income is supplemented by income from the Slack Portfolio.
  • Slack Portfolio Investments – (~50% of Net Worth) – Now currently in my Self Managed Super fund (SMSF) which is almost exclusively invested in growth companies. These are great businesses to be invested in if you have a long time horizon – as stock prices can be volatile in high Return on Equity (ROE) shares. I am currently retired and would not rely on the Slack Portfolio for stable income. Because of the stability of my other two pillars, I can be quite aggressive in the allocation of my investments in the Slack Portfolio – as I know I will not have to panic sell (for income) during any downturn.

All Performance results are before tax, given the circumstances, the Slack Portfolio annual FY 2020 performance of +9.4% was a pretty good result. Full yearly results with benchmarks are shown in the table below. A mediocre year for all benchmarks exposed to Australian and UK share markets (Median Balance Fund +0.3%, Vanguard Growth Fund +0.6%, ASX 200 Accumulation -2.7%). Real Estate was a good investment in the Brisbane and Melbourne markets for FY 2020 (+8.4% and +13.8%) – but the winds for these investments are blowing the wrong way now.

YEAR SLACK FUND MEDIAN BAL VGARD GROWTH ASX200Acc RES BRIS RES MELB CASH CPI
2010 6.6 9.8 12.3 13.1 10.8 26.9 4.2 3.1
2011 2.5 8.7 9.1 11.7 -2.4 0.9 4.4 3.7
2012 8.3 0.4 1.3 -6.7 1.3 -0.9 4.3 1.2
2013 26.5 14.7 18.6 22.8 7.7 8.3 3.2 2.4
2014 23.6 12.7 14.5 17.4 11.5 12.8 2.6 3.0
2015 2.4 9.6 11.8 5.7 7.7 15.6 2.5 1.5
2016 14.2 2.8 4.2 0.6 8.4 9.5 2.2 1.3
2017 19.5 10.4 8.8 14.1 6.5 17.7 1.9 1.9
2018 37.6 9.2 10.0 13.0 1.1 5.2 3.9 2.1
2019 19.7 7.2 9.8 11.2 1.7 -6.0 2.0 1.3
2020 9.4 0.3 0.6 -2.7 8.4 13.8 1.1 -0.3

The Slack Fund yearly progress vs BENCHMARKS. The Median Balanced Fund (41-60% Growth Assets)Vanguard Growth FundASX 200 Accumulation IndexCorelogic Residential Property total return in both Brisbane and Melbourne, and Cash (Australian Super Cash Fund) and Consumer Price Index (CPI)

The Five-year compound annual performance gives me a much better idea about how things are going and will smooth out any dud (or remarkable!) results.

The beauty of compounding with a succession of good performance results can be seen in the chart below showing the growth of an initial investment in June 2009 of $10000.

FY 2021 Resolutions

Image from the perceptive Gary Markstein.

The delusional President Trump provides many lessons to Slack Investor. The absence of these traits in Trump reminds me that humility and compassion are such worthwhile qualities. I will continue to work on these personal attributes this coming financial year and always be grateful for good fortune. I made plenty of mistakes this year and in hindsight sold some shares just before a decent price rise (e.g, IRI, CIP, VGE) – but Slack Investor accepts this as just the “normal path” of investing.

Slack Investor has no form in trying to predict the future … In the last 6 months I have tinkered with the Slack Portfolio and tried to get rid of any companies that would suffer severe setbacks in this COVID-19 led global recession. I have no great faith in my ability to time the exit and entry of exposure to sharemarkets, and I remain fully invested. Slack Investor is prepared to “ride this one out” with cash in the Portfolio at less than 1%.

In the wise words of Peter Lynch …

“Far more money has been lost by investors preparing for corrections or trying to anticipate corrections than has been lost in the corrections themselves.”

Peter Lynch, One Up On Wall Street:

2019 Calendar Review and, at last … some quality

Slack Investor’s in-depth reviews of performance are done at the end of the Australian financial year (30 June) – but a brief look at how things went in calendar year 2019 is in order. It has been a great year for the share investor. Roger Montgomery reports that the Australian All Ordinaries Accumulation Index delivered a return of 24.0% in calendar 2019 – more than double long-term average annual total return. Other World Index yearly changes for 2019 (without dividends) are listed below.

Indicies% Change
Australian All Ordinaries19.10%
S&P 50028.90%
Nasdaq35.20%
Nikkei 22518.20%
FTSE 10012.10%

Quality Street

Slack Investor puts a bit of time into initial stock selection. Before entry to the Slack portfolio, I comb the company universe for high Return on Equity stocks that have low debt and a proven track record of increasing dividends. Delighted to report that a couple of Australian ETF’s have recently emerged that do a similar thing, using parallel principles to the great Benjamin Graham in selecting quality stocks – automatically!

BetaShares Global Quality Leaders ETF – QLTY

QLTY provides access to the 150 highest quality global companies (ex-Australia) based on a combined ranking of four key factors – return on equity, debt-to-capital, cash flow generation ability and earnings stability.

VanEck Vectors MSCI World ex Australia Quality ETF – QUAL

QUAL has a similar objective screening process, to fill its stock register. Companies must have a high return on equity, stable annual earnings growth, and low financial leverage. 

There are common elements to the top 10 holdings for each ETF. Companies like Apple, Visa, Facebook and Alphabet feature on both registers. Either of these ETF’s would be a great addition to a portfolio but Slack Investor would lean towards BetaShares QLTY because of their slightly less expensive management costs (0.35% vs 0.40%). Past results indicate there is outperformance attached to this “quality” approach.

My only criticism is that both ETF’s have quality filters that do not seem take into account how expensive the stock is. When Slack Investor researches stocks, I usually dismiss a company if the forecast earnings (+2 years) produce a PE that is over 40. With QUAL and QLTY, it is quality first, regardless of price. I am mollified slightly by the determination that, in the past,

MSCI World Quality Index traditionally has its strongest relative performance during economic downturns

From Van Eck Whitepaper

Sometimes people ask me what stocks to buy – and I seldom have a good answer for them – particularly if they are just starting out on the path of buying shares and their portfolio carries the risk of just one or two stocks. These two ETF’s have given Slack Investor an easy answer.

  • Instant Diversification – International exposure
  • Access to high growth companies with a good track record of increased earnings
  • Rules based stock selection – no ‘active manager’ fees -this should keep expenses low ~ 0.4% … but could be lower!

The early results are not bad either with Morningstar listing one-year performance for 2019 for QUAL and QLTY at 35.8% and 34.5%, respectively.

These sort of products might just put Slack Investor out of a job!

Financial Year 2019 Slack Results

“You only have to do a very few things right in your life so long as you don’t do too many things wrong.”

Warren Buffet

The art of getting things mostly right is all that Slack Investor wants to do – this is a theme that echoes throughout this blog. Slack Investor does not aim for perfection – good enough is good enough. Along the way will be fantastic opportunities that I missed out on … but that’s OK too.

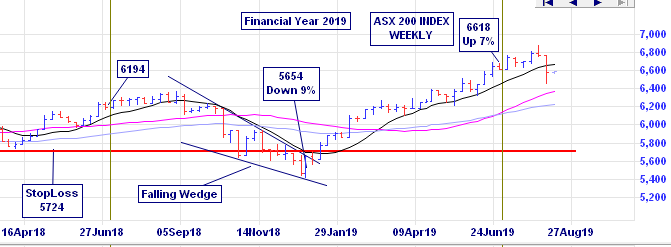
Though not in Mr Buffet’s league, stock pick failures are something that we both accept – providing that they are not too common! Mr Buffet probably has regrets about his $US14 billion stake in Kraft Heinz … but unlikely to be losing any sleep about it. The Slack stinkers were outlined last post – again, no sleep lost. There will be times when the entire Slack portfolio goes negative – A good example is the first half of last financial year, From July 01 till December 31 2018, things were grim with the Australian Market down 9% and the Slack Portfolio down over 10% and the journey so far this financial year has been “wild and woolly”.

ASX 2oo Weekly chart for FY 2019 (01 July 2018 – 30 June 2019) – Incredible Charts

Slack Performance Results FY 2019

Performance results are before tax and, despite being over 10% down at the end of December, the Slack Portfolio grew a creditable 19.7% for the year. Full yearly results with benchmarks are shown in the table below. I have changed the residential property benchmarks.I am now using Corelogic Total Returns. This benchmark accounts for yearly asset price change as well as the gross rental yield. This provides a better benchmark for me as it reflects total return and answers the question – Would Slack funds be better deployed in Australian real estate?

In a 6 out of 10 years, the median balanced fund has done considerably better than asset growth plus the gross rental return from median Melbourne residential property. In 8 out of 10 years, the Slack fund has done better than Melbourne Property returns.

YEAR SLACK FUND MEDIAN BAL VGARD GROWTH ASX200Acc RES BRIS RES MELB CASH CPI
2010 6.6 9.8 12.3 13.1 10.8 26.9 4.2 3.1
2011 2.5 8.7 9.1 11.7 -2.4 0.9 4.4 3.7
2012 8.3 0.4 1.3 -6.7 1.3 -0.9 4.3 1.2
2013 26.5 14.7 18.6 22.8 7.7 8.3 3.2 2.4
2014 23.6 12.7 14.5 17.4 11.5 12.8 2.6 3.0
2015 2.4 9.6 11.8 5.7 7.7 15.6 2.5 1.5
2016 14.2 2.8 4.2 0.6 8.4 9.5 2.2 1.3
2017 19.5 10.4 8.8 14.1 6.5 17.7 1.9 1.9
2018 37.6 9.2 10.0 13.0 1.1 5.2 3.9 2.1
2019 19.7 7.2 9.8 11.2 1.7 -6.0 2.0 1.3

The Slack Fund yearly progress vs BENCHMARKS. The Median Balanced FundVanguard Growth FundASX 200 Accumulation IndexCorelogic Residential Property total return in both Brisbane and Melbourne, and Cash (Online bank Interest) and Consumer Price Index (CPI)

The Five-year compound annual performance gives me a much better idea about how things are going and will smooth out any dud (or remarkable!) results.

The compounding nature of a succession of good performance results can be seen in this growth of an initial investment of $10000 chart.

Thanks to Vlad Kolarov for a good image that might sum up Slack Investors situation.

Well, so far so good … but trade wars, Trump, China and the constant press about the next recession are starting to make Slack Investor worry whether he has got any concrete shoes on. A momentary lie on the couch and a modest celebration for the good results this year and it might then be time for a review of the portfolio. A clean out of some of the companies that I am a bit doubtful about … and a think about what companies, or ETF’s, might do OK if a recession was to occur in the next 6 months to two years. Slack Investor has poor form in trying to predict the future … so wholesale changes are unlikely, but a tinkering around the edges of the portfolio might just be the right thing. In the wise words of Peter Lynch …

“People who succeed in the stock market also accept periodic losses, setbacks, and unexpected occurrences. Calamitous drops do not scare them out of the game.” 

Peter Lynch, One Up On Wall Street:

Slack Performance … Not So Slack

Last post I described a change to the Slack Method for managing Index funds. Index “whole market” funds are just a small part of my share portfolio – about 3%. The bulk of my share market exposure is in individual growth companies.

Slack Investor is a great believer in measurement and is most un-Slack when it comes to record keeping and recording his investment results.

Lord Kelvin at 22 (c) Glasgow Museums;

If you can not measure it, you can not improve it

Attributed to Lord Kelvin … his more verbose quote is here

My main cycle of measurement is at the end of the tax year in Australia, June 30. Because the results of one-year performance can be a bit misleading. I am much more focused on results over 5 years as these longer term measures are more meaningful to the investor. The benchmarks I have used have been mainly sourced from the excellent NetActuary site. A shout out to the low cost Vanguard Growth Index Fund. When I tire of investing in individual companies, this (or Vanguard ETF’s) is the type of vehicle that would be a good resting place for funds that require minimal supervision.

The SLACK FUND 5-yr average compound return vs BENCHMARKS. The Median Balanced Fund, Vanguard Growth Fund, ASX 200 Accumulation Index, Residential Property median in both Brisbane and Melbourne, and Cash (Online bank Interest)

A good way of measuring growth is comparing $10000 invested in the Slack Fund in the 9 years since 2009 against benchmarks.


The SLACK FUND growth of $10000 invested October 2009 vs BENCHMARKS. The Median Balanced Fund, Vanguard Growth Fund, ASX 200 Accumulation Index, Residential Property median in both Brisbane and Melbourne, and Cash (Online bank Interest) and Consumer Price Index (CPI)

Year by year results are presented in table form below. I will add results at the end of each financial year and put them on The Slack Way page.

YEARSLACK FUNDMEDIAN BALVGARD GROWTHASX200AccRES BRISRES MELBCASHCPI
20106.69.812.313.18.524.34.23.1
20112.58.79.111.7-3.6-2.04.43.7
20128.30.41.3-6.7-2.7-4.84.31.2
201326.514.718.622.83.73.33.22.4
201423.612.714.517.46.89.32.63.0
20152.49.611.85.73.47.82.51.5
201614.22.84.20.64.98.22.21.3
201719.510.48.814.13.013.81.91.9
201837.69.210.013.01.12.31.82.1

For this site I have only presented my share trading results since 2009. Any cherry-picking of data to avoid the terrible investing years of 2008 and 2009 is coincidental. Out of the ashes of the Global Financial Crisis (Great Recession), 2009 is the year that I started my Self Managed Super Fund (SMSF Slack Fund) and from which I have independently audited results. For the record, prior to 2012, I was not what I regard as a very successful investor. My investments for the 2003-2011 period performed worse than the Median Balanced fund on 6 out of 9 occasions.

What changed? I started to go to a local investment class which made me re-evaluate my investment method (Thanks Robbie Fuller!)

  • Took a more disciplined approach to investing by documenting everything and having weekly and monthly and yearly chart reviews of my investments
  • Tried to reduce confirmation bias from my portfolio – i.e. I bought this stock for a good reason … I am smart … the price has gone down … the market must be wrong! – I would score myself 5/10 on this goal!
  • Started using charts and stop losses extensively.
  • Started investing mostly in growth companies that have some barriers to entry for competitors (moats) – Companies with manageable debt, with future PE less than 25 -30, and with a return on equity (ROE) of >15%
  • Before investing in an individual company use both fundamental analysis (Thanks Market Screener) and technical (chart) analysis (Thanks Incredible Charts) before I make a buy order.
  • Tried to follow the Peter Lynch approach to my portfolio. Selling the bad performers (weeds) and trying to add to my position on stocks that are doing well (flowers).

You won’t improve results by pulling out the flowers and watering the weeds.

Legendary Investor Peter Lynch from quoteswise.com

Investing in growth companies can have its despairing moments and I cannot guarantee that the Slack Fund will continue to outperform the benchmarks … but, the results, so far, are good.

Financial Year 2018 – Slack Portfolio Review

Adapted from Pixabay

As Slack Investor is a student of the financial arts and a lover of measurement, the end of the financial year is a great time to review and see how the Slack Investments performed. The Index funds were reviewed last post. Index funds are a great way to start investing in shares – as you are spreading your risk over at least a hundred companies.

The next step, as you become more familiar with investing and can start running a critical eye over individual companies, is to invest in individual stocks.

Over 75% of Slack Investor’s share investments are in individual stocks. See Portfolio

Most of my holdings are in growth stocks. These stocks usually have a high Return on Equity (ROE>15%) – with a track record of increasing dividends. By their nature, they have a relatively high PE ratio and are usually punished in the markets during reporting season if there is any bad news affecting future earnings. This I accept.

Slack Investor Stinkers – FY 2018

From Pixabay

Each year I expect a few stinkers and dont beat myself up about them when they occur. If they breach the monthly stop loss – I usually sell at the start of the next month.

Print

-24%

A special mention for IPH. Although some investors have done well with this stock. this company has a prawn heads in the bin on a hot day type of stink for me. Slack Investor likes the idea of the company -and it seems to be making a bit of a recovery since I sold it! However, I have had difficulty trading it successfully as it would go into long periods of declining price immediately after my buys. I should have learned my lesson years ago with Slater and Gordon – Never trust Lawyers!

-22%

HSO has got caught up with a tightening on government health spending and a decline in private health care admissions.

-21%
RHC is also in the healthcare sector and has the same challenges as HSO. But, it is a well managed company and Slack Investor will look for an opportunity to get back in this stock.

Slack Investor Gold Nuggets – FY 2018 

The wonderful thing about owning growth companies is that sometimes they surprise on the upside and grow faster than expected. Altium is the “Welcome Stranger” of gold nuggets.



+166%   ALU makes software for the designing of integrated circuit boards that are used widely in a range of technology products. Some analysts fear that the stock is overpriced. Its PE ratio is currently an eye-watering 74 – but this is rapidly reducing with projected earnings over the next few years. I am still holding as we go into the reporting season – the optimist in me thinks that there may be more good news on future earnings. There are even rumours of a takeover by  larger company. But if not, my end of month stop loss is $19.61.

+71%   A2M’s brand relies on a patented process that makes milk with only the A2 protein. A2M has been the subject of a previous post, and it is true that I’m yet to be convinced of the health benefits attributed to A2 Milk – But their marketing is very good and the trend is more powerful than logic in my book!  Slack Investor was stop-lossed out of this stock earlier this year, but has bought in again -and hope for good news this reporting season.

Honourable mentions for Slack Investor portfolio stocks that increased more than 30% in this remarkable financial year. These nuggets include APX, CSL, MQG, NCK (no longer held), PMC, REA, SEK and WOR.

Slack Investor SMSF performance – FY 2018 

I have written extensively on calculating Portfolio returns. I run a few separate portfolios but only quote the SMSF annual returns as this portfolio is externally audited. All percentage earnings quoted include brokerage and portfolio costs. Both raw and franked dividends are included as income. So essentially, the percentage returns include costs but are before tax. This raw figure can then be compared with other investment returns.

In what can only be described as a high-water mark for Slack Investor’s SMSF portfolio investing prowess. (and the luck of holding ALU inside it), Portfolio return FY18 was 37.6%.

One-year high returns are welcome but Slack Investor puts more weight on multi-year performance. The past 5-yr progress of the Slack Portfolio is 23.6%, 2.6%(whoops!), 14.2%, 19.5%, and 37.6%. This gives a compounding annual 5-yr return for the Slack Investor SMSF portfolio of 18.9%.  The benchmark ASX 200 Accumulation Index (Including dividends) 1-yr and 5-yr compounding annual returns are 12.7% and 9.9% , respectively.

“Good luck is a residue of preparation.”

Jack Youngblood – Hall of Fame American Footballer

Slack Investor readily acknowledges the luck factor in the stock selection process and realises that this FY18 as an extraordinary year for the portfolio (I expect more moderate returns!). I have found that a disciplined stop loss process, a bit of effort and research on stock selection, and following of trends on share charts (technical analysis) can yield very good results.

Over the next year I will post on how to start investing and the specific techniques that Slack Investor uses – It is not difficult … Empower Yourself!