– Portfolio Performance Calculation
– Benchmarking
– Incredible Charts
– Directional Movement System
– Travel
Portfolio Performance Calculation
Measuring your portfolio performance can do your head in … but Slack Investor thinks that it is important that you set aside a time to evaluate your investments at least once a year. I choose the end of the financial year in Australia (June 30) as a good time for these calculations … but you can chose your own date … and, if whatever you do, you do it consistently … you are going to be OK.
I present various ways to do your calculations … in increasing difficulty. Because I am an “Excel Wonk”, I use an Excel spreadsheet to do the calculations for me and mostly use Internal Rate of Return (IRR). The IRR measures the actual return achieved by an investor’s money in a portfolio.There are also good arguments for using the Time Weighted Return (TWR), Both IRR and TWR take into account the time value of money … The arguments are presented here – but, it doesn’t really matter provided you are consistent with your calculations.

I usually calculate returns before taxes, this is sometimes referred to as “gross of tax”. An important reason to do these calculations is to compare your investments with other investments, such as a managed fund, super fund, ETF or another benchmark. With few exceptions, performance figures are usually reported pre-tax. In Australia, we are lucky enough to have our dividends mostly “franked” or tax paid at the rate of 30% Thanks Paul Keating … you legend!
So I include these franking credits in my return calculations as they represent tax already paid on my Australian Dividends..
- Portfolio with no inflows or outflows
Lets start simply … supposing your have the most basic portfolio that reinvests its earnings with no external inflows (“cash in”, contributions, or transfer) and no external outflows (“cash out”, pension payment, or transfer) from your investment portfolio during the year and you want to do a performance calculation to benchmark yourself with other funds and investments. Most people can come up with a starting value and an ending value of their portfolios at the year (financial year) end – this includes the value of your stocks and any portfolio cash.
Whatever happens inside this portfolio – buys and sells, reinvested dividends, interest, portfolio taxes, expenses, brokerage and fees – are just part of the portfolio business and will be reflected in its finishing value. Dividends and Interest must be reinvested
A downloadable Excel spreadsheet that will make this job easier is here … SlackPerformanceWeb
2. Portfolio with inflows and outflows – Approximation
However, for most real portfolios, there is money transferred into or out of your portfolio account during the year. Your investment portfolio might include stocks, managed funds, bank accounts and consider them just one big entity … transfers between these portfolio parts are internal portfolio business. Your inflows are money that flows from a private account (or other source) to your investment portfolio e.g. contribution. Your outflows track money moving from your investment portfolio e.g. if you don’t reinvest dividends (i.e. send them to a private account), count these as withdrawals or outflows.
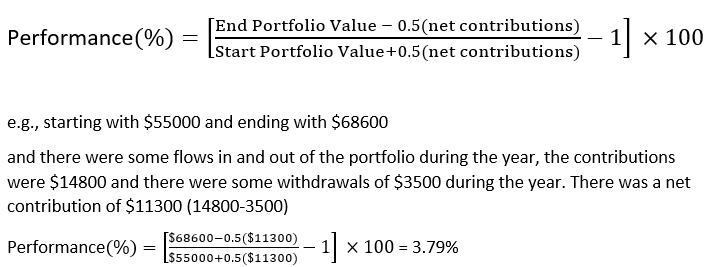
If you want the least amount of work and it is enough to calculate your portfolio return approximately – the way below will work a treat. A net contributions figure is obtained (inflows – outflows) to give an ‘average’ amount of capital invested during the year and by subtracting 50% of net additions from the ending value and adding 50% to the beginning value – we get an approximate percentage return.
A downloadable Excel spreadsheet that will make this job easier is here … SlackPerformanceWeb
Of course, in real life, rather than using averages, Portfolio returns depend greatly in the timing of when you had capital available. The above is an approximation. Slack Investor chooses to go into more detail to reflect the time value of money for his portfolio.
3. Portfolio with inflows and outflows – Internal Rate of Return (IRR)
Slack Investor has a complicated set of portfolios with inflows and outflows during the year and, for an accurate performance figure it is necessary to account for the time that your money is available for investment. For example, an additional $10000 invested at the start of the year should add more value to your portfolio compared to an addition in the last week of the year.
Slack Investor likes to do things accurately … but easily! The TWR requires a portfolio valuation after every inflow/outflow and this adds an extra step to the calculation. With a spreadsheet, the IRR calculation is a simpler process. So Internal rate of Return (IRR) is what I use.
The IRR is also known as the “money weighted rate of return” and the calculation is complex as it involves trial and error mathematics – for the enthusiasts further details can be found here.
The good news is that with an Excel spreadsheet, all this is taken care of by the XIRR function and you only have to enter the start value of your portfolio, dates of inflow/outflows and end value. I have included the rather complex set of inflows and outflows based upon my SMSF portfolio and hope that your portfolio is simpler. Just use the lines that you need, but it is important that you have an initial date and balance, and a closing date and balance- (scroll down to the bottom of the spreadsheet). Inflows are entered as positive numbers and outflows as negative.
To download the Excel spreadsheet that that performs these calculations can be found at this link … SlackPerformanceWeb
Of course, if this is too difficult, you can always get a bit of software to do your portfolio management and return calculations. Slack Investor likes to keep the costs of investing on the down low and Sharesight in Australia is an excellent choice for the starting investor. They offer free monitoring of investments, capital gains and performance reports if you have 10 or less investments to track. Slack Investor monitors his shares with the retired but excellent (and free) “Sunset” international version of Microsoft Money Australian Version, UK Version, US Version linked into share prices with MSMoneyQuotes. The latter is not freeware but it is $10 US well spent.
In the USA, Personal Capital is recommended.
Benchmarking
Incredible Charts
Without Incredible charts I would not have been able to take a broad view of stock trends … and set sensible stock losses.
This is a great (free end of day data – available at midnight onwards) charting program. A charting program is essential for using this Directional Movement System – Download from incredible charts.com
Install Incredible charts and fill out registration with email address. Write down userID and password.
Setup Monthly Project View (Refer to Screenshot Below)
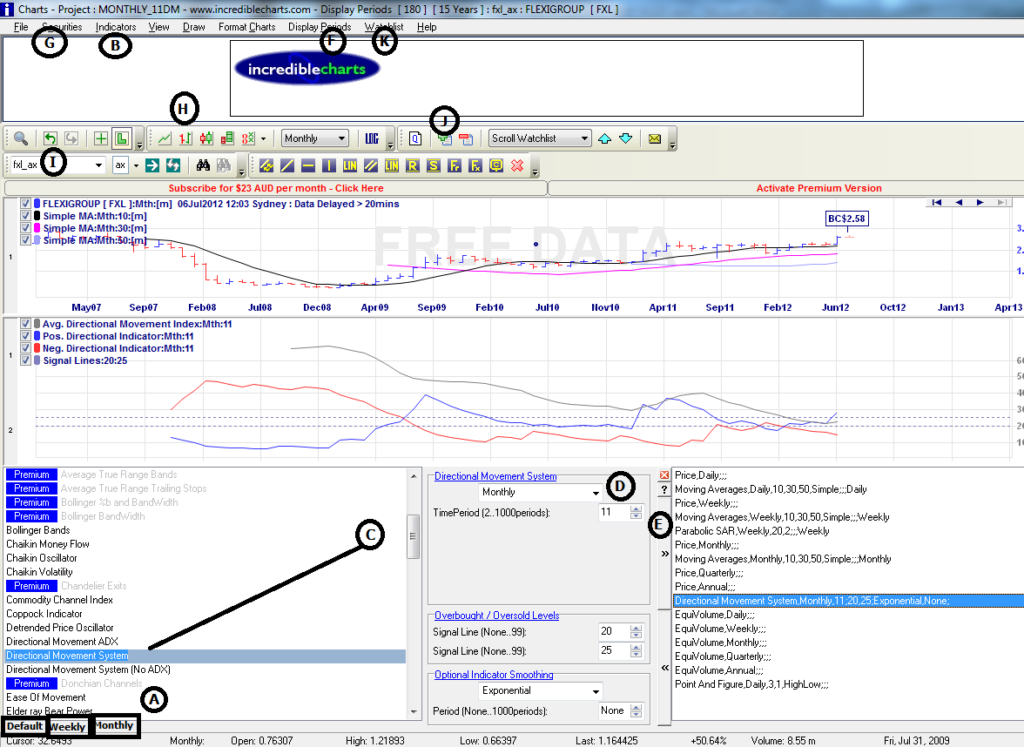
- Go to Monthly Project view A
- Open the indicators window by clicking on B
- Scroll down to “Directional Movement System” C and click on “Directional Movement System” in left panel. On the middle pane D select “Monthly“, and Time Period “11”, Signal lines “15” & “25”, Indicator Smoothing “Exponential”, Period “None”
- Click on the right pointing arrow at E to move this indicator to the chart indicator window on the right pane.
- Scroll down to the “Moving Averages” in the left pane C and click on the middle pane D and select “Monthly“, Time Period “10”, “30”, “None”, and “Simple”.
- Click on the right pointing arrow at E to move this indicator to the chart indicator window on the right pane.
- Close the indicator window by clicking on B.
- From the “Display Periods” F pick 10 years.
- From “File” G , select “Project Defaults” and select ” “None” for Default Security and “Use Current ” for all other values in the table then OK
**
Setup Weekly Project View (Refer to Screenshot Below)
- Go to Weekly Project view A
- Open the indicators window by clicking on B
- Scroll down to “Directional Movement System” C and click on “Directional Movement System” in left panel. On the middle pane D select “Weekly“, and Time Period “11”, Signal lines “15” & “25”, Indicator Smoothing “Exponential”, Period “None”
- Click on the right pointing arrow at E to move this indicator to the chart indicator window on the right pane.
- Scroll down to the “Moving Averages” in the left pane C and click on the middle pane D and select “Weekly“, Time Period “10”, “30”, “None”, and “Simple”.
- Click on the right pointing arrow at E to move this indicator to the chart indicator window on the right pane.
- Close the indicator window by clicking on B.
- From the “Display Periods” F pick 3 years.
- From “File” G , select “Project Defaults” and select ” “None” for Default Security and “Use Current ” for all other values in the table then OK
**
Setup Daily Project View (Refer to Screenshot Below)
- Go to Default Project view A
- Open the indicators window by clicking on B
- Scroll down to “Directional Movement System” C and click on “Directional Movement System” in left panel. On the middle pane D select “Daily“, and Time Period “11”, Signal lines “15” & “25”, Indicator Smoothing “Exponential”, Period “None”
- Click on the right pointing arrow at E to move this indicator to the chart indicator window on the right pane.
- Scroll down to the “Moving Averages” in the left pane C and click on the middle pane D and select “Daily“, Time Period “10”, “30”, “None”, and “Simple”.
- Click on the right pointing arrow at E to move this indicator to the chart indicator window on the right pane.
- Close the indicator window by clicking on B.
- From the “Display Periods” F pick 6 Months.
- If you pefer OHLC Indicators rather than the default Candlesticks press H
- From “File” G , select “Project Defaults” and select ” “None” for Default Security and “Use Current ” for all other values in the table then OK
**
Setup Watchlist
- Go to K Watchlist/New Watchlist and give your Watchlist a name.
- Type in your 3 letter stock code in I and press Enter or the green/white arrow.
- Your stock chart should display and you can add this to your previously named Watchlist by pressing J and scrolling down to your named Watchlist and left clicking the mouse.
- Keep repeating 2. and 3. with all your stocks.
Directional Movement System
The DM peak-trough/crossover system that is outlined below has been tested using ~30 years of past market data and seems to provide a good decision framework for individual (not all!) stocks and index stocks for daily, weekly and monthly periods. Through back-testing of various DM systems using different periods (7,9,11-period/Daily-Weekly-Monthly) the system that gave the best results with the least number of trades (suited my trading strategy!) was the 11-period DM system using weekly entry points and monthly exit points. Daily and Weekly systems also work well, but monthly systems suit my temperament as the charts and signals only have to be observed at the end of each month and BUY/SELL signals are to be acted upon early in the next month. An advantage of the monthly (rather than weekly or daily) system is that the number of trades is greatly reduced and you are more likely to be exposed to the deep trends rather than more shallow fluctuations of stock price. The usual caveats apply to this strategy and the system is best applied to a portfolio of stocks (5-20) as not all individual trades will be winners – but hopefully your portfolio will increase overall. Also, it is best to select from a portfolio of fundamentally sound stocks – to avoid unnecessary concern over daily fluctuations between monthly chart reviews. If you have funds available and no fundamentally sound stocks show an entry signal, then stay in cash.
The DM system consists of 3 indicators:
- +DM Positive Directional Movement Indicator – Indicates Buying pressure – Also called +DI and indicates the percentage of time the stock has had an upward directional movement over the time period.
- -DM Negative Directional Movement Indicator – Indicates Selling pressure – Also called -DI and indicates the percentage of time the stock has had a downward directional movement over the time period.
- ADX Average Directional Index – Combines and smoothes the above and indicates the strength of the trend – for the time period– it could be a positive or a negative trend!
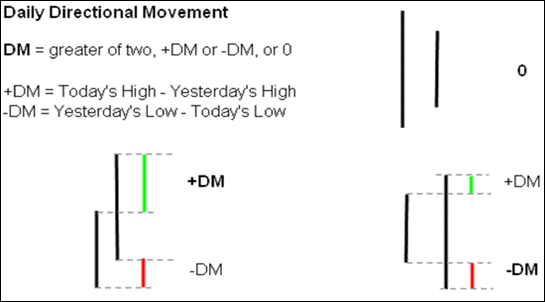
GENERAL RULES
- To ENTER a trade look for peaks or troughs in the grey ADX line
- To EXIT a trade wait for the +DI line to cross over the -DI line from above
1. POSITIVE PHASE +DI (blue) > -DI(red)
- In a positive phase, for entry, look for ADX troughs.
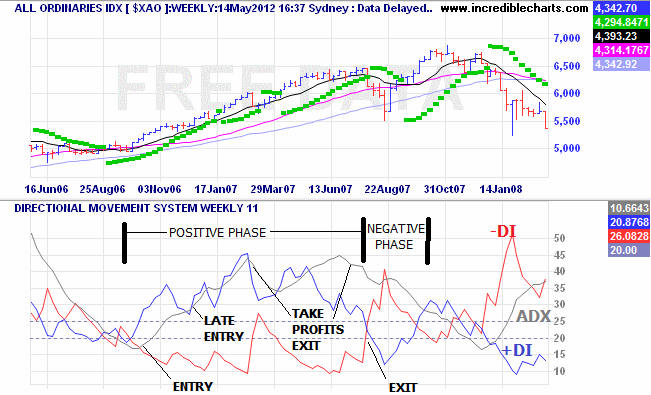
POSITIVE PHASE ADX TROUGH ENTRY
During a positive phase ( buying pressure(Blue +DI) exceeds selling pressure (Red -DI)). When the ADX (Grey) changes from a downhill to an uphill slope and the ADX rise is 0.6, or greater, this is an ENTRY or BUY signal – the strength of the buying pressure is increasing.
LATE ENTRY (Seldom used)
If the initial entry is missed but the ADX takes on a steeper upward slope then this is a possible ENTRY or BUY point. This LATE ENTRY carries much more risk than the conventional ENTRY as the trend is already underway. As with other trend systems, the safest strategy is to be as close to the start of the trend as possible.
POSITIVE PHASE ADX PEAK (TAKE PROFITS) EXIT
For more speculative stocks, if the ADX moves sharply downwards from a high value peak with accompanying downward movement of +DI and upward movement of -DI. Then this is a useful EXIT point as it signifies that the impetus for the initial “buying pressure” trend is weakening and might be a good point to sell all or part of your stock. This exit is good to take for a more speculative (or low dividend) stock.
CROSSOVER (NORMAL) EXIT
During a positive phase, when the +DI crosses over the -DI from above then this is the end of the positive phase and negative sentiment on the stock is stronger than positive sentiment. If you are still in the trade, this is the exit point ALWAYS for your trading stock. This CROSSOVER EXIT is preferred for a fundamentally sound stock or a stock paying good dividends. As it allows you to stay in the trend as long as possible.
2. NEGATIVE PHASE -DI(red) > +DI (blue)
- In a negative phase, for entry, look for ADX peaks.
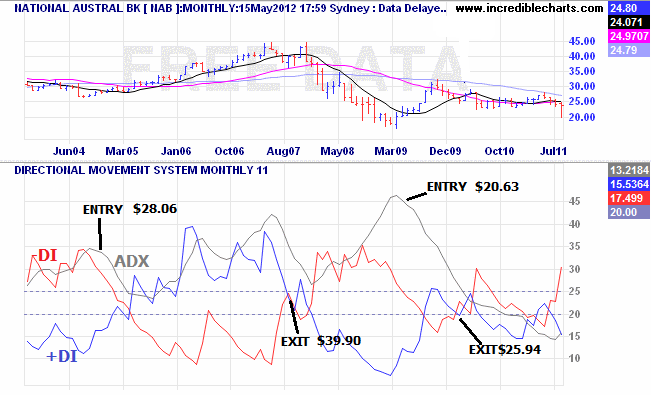
NEGATIVE PHASE ADX PEAK ENTRY
During a negative phase – where selling pressure (Red -DI) exceeds buying pressure (Blue +DI) – After a peak of the ADX (Grey) and the ADX falls at least 0.6 units with a corresponding fall in -DI and rise in +DI then ENTER or BUY. This represents a change in market sentiment – usually a pivot point on share price.
CROSSOVER (NORMAL) EXIT
After the ADX Peak, the negative phase usually ends and leads into a positive phase(* See ADX RECURVE EXIT below for exception). Once in a positive phase, it is just a matter of waiting till the +DI crosses over the -DI from above signalling the end of the positive phase. If you are still in the trade, this crossover is the exit point ALWAYS for your trading stock.
*NEGATIVE PHASE ADX RECURVE EXIT
During a negative phase, after an ADX peak ENTRY, and a the ADX starts to recurve upwards while still in the negative phase, this is a stop loss EXIT point. This represents a change in market sentiment as the selling pressure starts to increase – This could be a good time to get out! However, I tend to stay in this trade if the stock is paying a good dividend and the end of month price has not gone below the previous price trough(Nicholson stop loss rules)
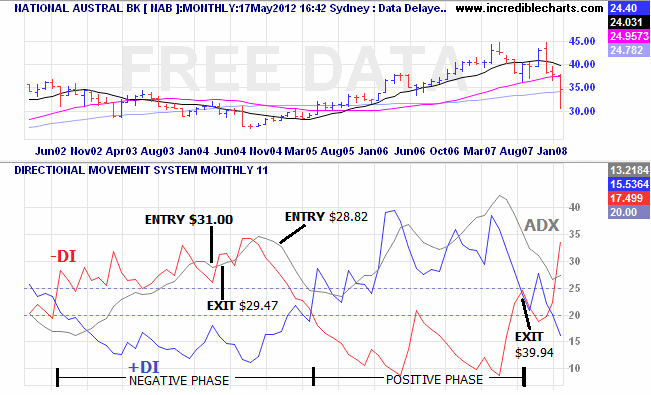
In the 11-period Monthly Directional Movement System chart above, A small peak is seen near Apr03 but it is not an entry as the movement from the peak did not exceed 0.6 ADX units. An entry at $31.00 is signalled after Jan04 but before Jun04 the ADX recurves upwards while still in the negative phase this is a NEGATIVE ADX RECURVE EXIT. The exit point marked at $29.47 is usually a stop loss sell signal. Another entry is signalled after Nov04 at $28.82. The DM system chart then quickly moves into a positive phase where you can usually relax until the crossover near Aug07 where an exit is taken at $39.94. The positive phase also contains some ADX peaks which would be a POSITIVE ADX PEAK (TAKE PROFITS) EXIT if this suited your strategy.
**
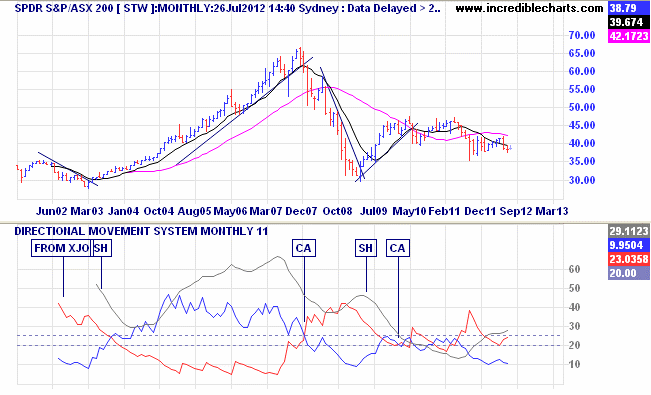
The peaks and troughs of the ADX and the Directional Movement crossovers often coincide with the BUY signal of the closing price rising above a downward trendline (drawn through at least 3 price peaks)and the SELL signal when the closing price breaks through a an uptrend line (drawn through at least 3 troughs e.g., Dale Gillham – How to beat the Managed Funds by 20%) – The DM system is just another way of visualising these changes of market sentiment (trendline breakouts/breakthroughs).
Travel
What can I say … It broadens the mind. Not only the beautiful places in this magnificent world – but the broad and fascinating cultures that humans have brought to it. Some destructive things too … but mostly good. I hope we can become better at looking after this wonderful planet in a sustainable way.
I visited 57 countries of the United Nations (29.5%) out of 193.
Create your own travel map .
Source Map for Visited Places is here


