Retirement Income

The Art Institute of Chicago

I am hoping that your retirement does not upset as many people as in this James Gillray (1756-1815) painting of “Integrity Retiring From Office”. You can hopefully avoid this by leading a good life and providing yourself with income for this wonderful stage of your life.

There are lots of ways to do this – Slack Investor likes to separate his non-house assets into a Stable Pile and an Investment Pile in his Self Managed Super Fund (SMSF). Most of the commentary on this website has been about the Investment pile as this is the most exciting – and produces the most gains – and lately, the most losses. My Investment pile is volatile as there is greater risk (and opportunity for growth) in this part of the portfolio.

The Stable Pile is mostly to supply me with guaranteed income during the market downturns. Slack Investor’s Stable pile consists of Cash, Term Deposits, An Annuity, Fixed Interest, Real Estate and Bond ETF’s, and some dividend-producing consumer-staple shares.

If the previous financial year has been a good year for investments, my next years annual income requirements can be withdrawn from the investments pile. If you get a bad year for investments, then, I dip into the stable income pile. I try to keep my ratio of Investment Pile to Stable Pile at about 70%:30% and I roughly rebalance at about this time of year (July/August/September).

Using this method, you are always selling from your investments pile when the market is high and buying when the market is low

Slack Investor – A Further look at three pile theory

This method suits Slack Investor, but there are other ways to provide yourself with income in retirement.

Dividends

The well known Australian investor Peter Thornhill, is a great proponent of using dividends to provide retirement income. His MySay articles are well worth a read. Peter maintains that dividends supply an inflation-protected, income that doesn’t vary as much as stock prices do. He supports this strategy by keeping sufficient cash in his superannuation account to fund the next 3 years minimum pension withdrawals (For the Australian superannuation system) – this helps avoid forced selling. The rest of his fund is in Industrials and Listed Investment Companies (e.g. Argo (ARG), Whitefield (WHF)). He has tested his strategy through market cycles and his strategy has been vindicated through the Covid-19 downturn with even some LIC’s using maintained profits to keep dividends going.

Whitefield Ltd is a Listed Investment Company (LIC) that has generally maintained its dividend Per Share (DPS – blue columns) for the past 50 years – even during periods of downturns where the Earnings Per Share (EPS – Red line) of its contributing companies were declining. From Peter Thornhill

Lifetime Annuity Payments

There are many different types of annuity. Annuities have not been very popular in Australia due to their pricing, relative complexity and inflexibility. Challenger has a few of these products available in Australia with rates at September 2022 for a lifetime inflation-protected annuity of $5104 for a 65-yr-old male for every $100000 invested. There are other options for payments that can be either deferred or market linked. Although you can access these annuities directly through their website, the current model that Challenger prefers is access through a financial advisor.

Retirement Income Stream products

Way back in the Australian 2016/17 government budget, Treasury proposed a series of reforms that included removing barriers to innovation in retirement income stream products. This tinkering was brought about by the realisation that the Australian Super model was mostly fit for purpose in the “accumulation” stage – but was lacking in retirement income stream products that address Longevity Risk – the risk of outliving your savings.

Hopefully, with the benefit of compulsory superannuation, most people would have a pile of superannuation money when they retire – and a desire to turn that pile into income (after paying off any debts). Everybody wants to maintain their standard of living in retirement and would prefer something to invest in that would give them the peace of mind of having a guaranteed income stream for life.

At last some new products are staring to emerge from the super funds. Slack Investor was excited to come across the MyPension income stream from Equipsuper. It is a “set-and-forget” investment strategy that nicely mixes a bit of risk assets (to keep your pension fund growing) with more conservative elements (to maintain a more steady income). This fund uses a similar method to the Slack Investor strategy of using “piles” or “buckets”.

To use the Equip MyPension, you would have to roll your existing super into their fund on retirement. Your super is separated into three distinct investment ‘buckets’. The automatic rebalancing of this product would suit those who want to be a bit more “hands off”.
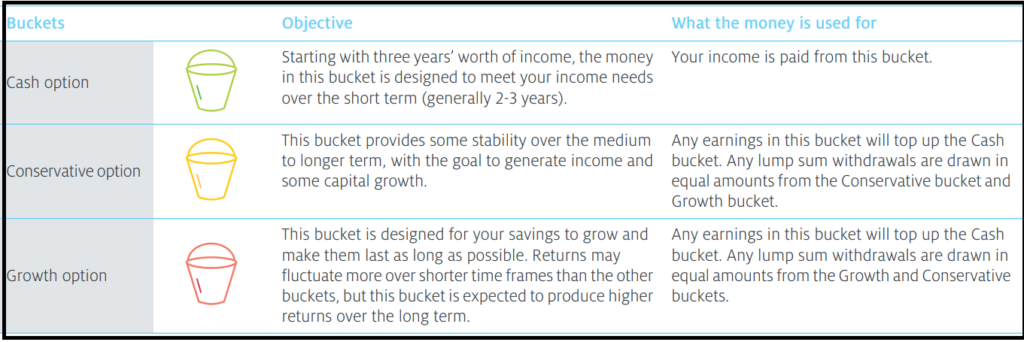
Equip MyPension option for maintaining a retirement income stream.
  • Cash – For regular income payments, usually comprised of three years income  – about 20% of investment.
  • Conservative – Investments in low risk categories including cash and bonds  – about 40% of investment.
  • Growth – Investments to grow your savings, subject to short term fluctuations – about 40% of investment.

The clever thing is how these buckets work together over time. When investment markets are good, any earnings in the conservative and growth buckets go into the cash bucket, locking in your gains (Automatically). If markets experience a downturn, we’ll leave any buckets that lose value untouched at the end of year, to allow them to recoup losses in future years.

EquipSuper MyPension

Slack investor has just two piles for his retirement – the Stable Income pile (Cash and Conservative) option and an Investments pile- and I do my own annual rebalancing. My investment pile is a bit more aggressive than the EquipSuper offering – more volatile, but Slack Investor likes to meddle and, is developing a “strong stomach”.

Spurious Correlations … and April 2022 – End of Month Update

Cheese Before Bed Will Not Give You Nightmares

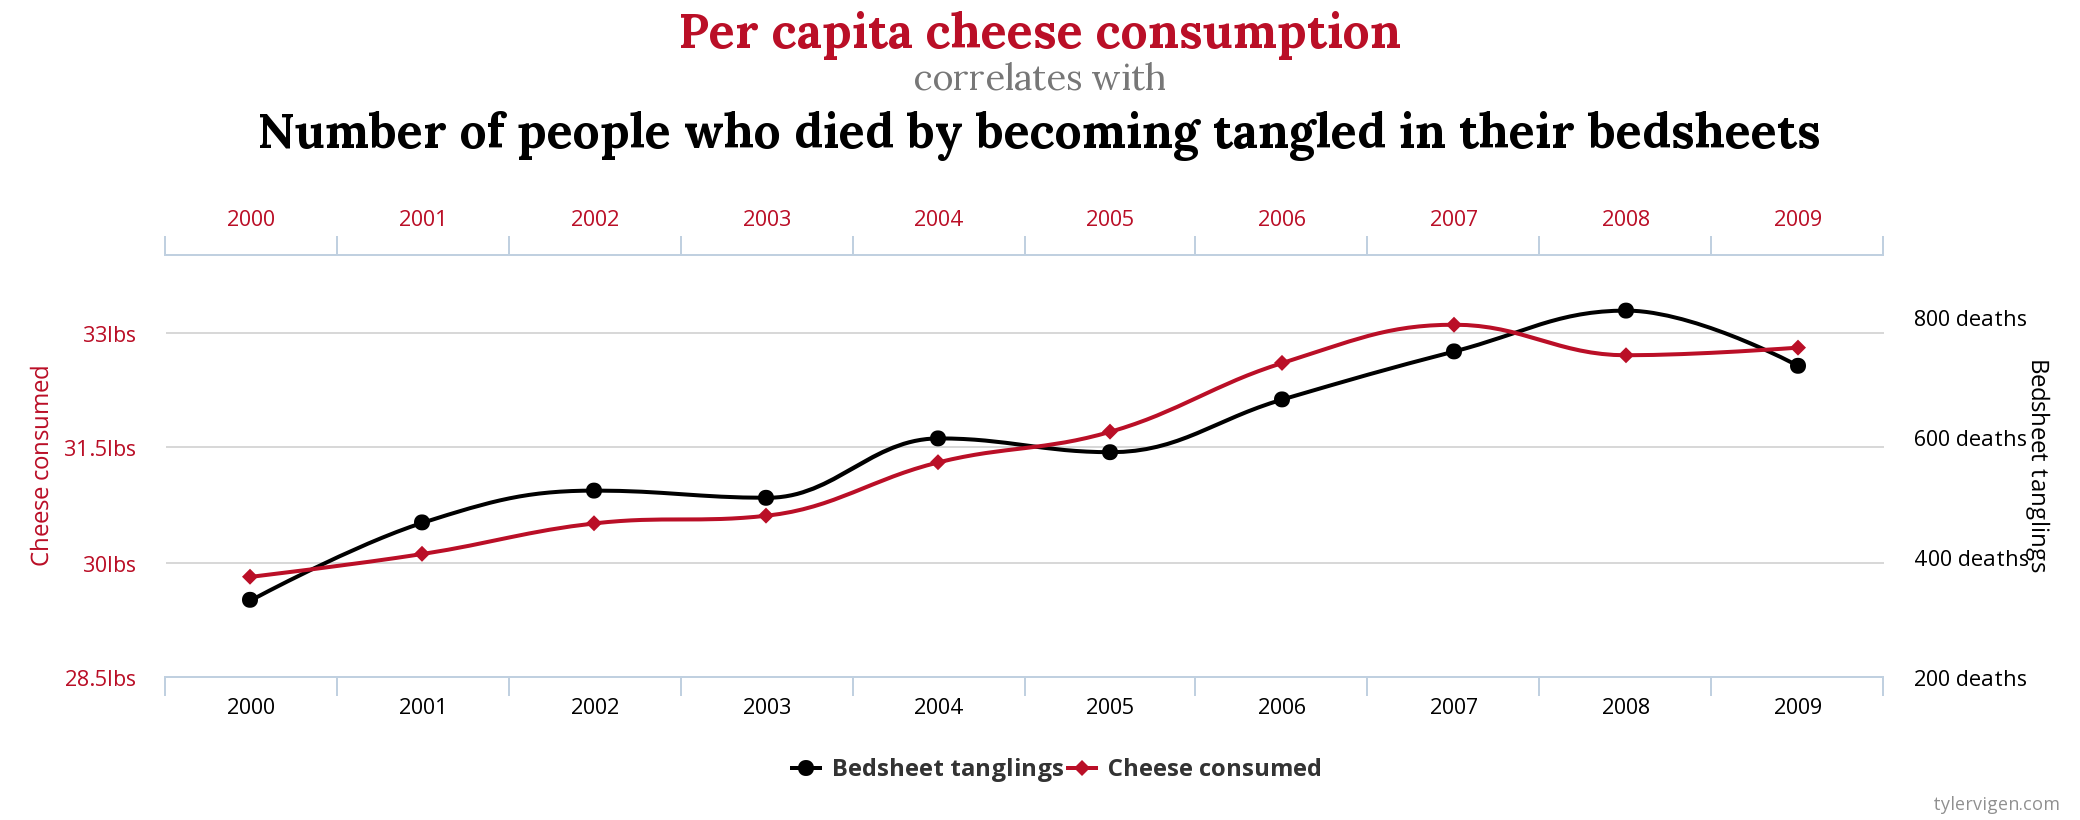
Slack Investor is a lover … of cheese. He follows all cheese related literature and was shocked by the revelation that “Death by Bedsheet Entanglement” is highly correlated (0.95 Pearson R correlation) with cheese consumption. The thought that over 800 people died in the US in 2008 at the hand of their sleeping equipment is terrifying.

A quick explainer on the correlation coefficient, it is just a way to measure how strong the relationship is between two variables. The correlation coefficient ranges between +1.00 (perfect positive correlation) through zero (no correlation) to -1.00 (negative corrrelation)

The close association between cheese and bedsheet deaths – Click Image for more detail – Data sources: U.S. Office of Management and Budget and Centers for Disease Control & Prevention – From tylervigen.com

Slack Investor salutes Tyler Vigen here – a bloke who wrote a program that crawls through unrelated government data sets to find spurious correlations. The above chart is one of these random pairs of data that were thrown together by his program. Almost 50 000 of these graphs that show unlikely correlations have been found so far – and one more is produce every minute! Hats Off Tyler.

Correlation does not mean causation

First lecture in Statistics 101

In the cheese consumption case, it is hard to think that eating cheese actually causes bedsheet entanglement. The first step when trying to establish a link between two variables is correlation. Then, most importantly, experiments must be done to show that A actually causes B – Is there a reason that makes sense? Some people link cheese to nightmares, but there is no scientific evidence linking cheese to death by bedsheet … so, this high correlation is probably just due to chance and a limited data set (10-yr). There is likely to be a missing other variable that’s the true driver that causes the correlation. I would speculate that both variables might be linked to general population trends – but this would have to be tested.

Using Sector Correlations in Investing

Slack Investor has been banging on a bit about “Sectors” lately. and despite not feeling the need to match his portfolio with the sectors of the S&P 500 (Or ASX 200), sector analysis can be useful.

My Investments portfolio consists mostly of “growth stocks” in the Technology and Healthcare sectors. The table below shows a high correlation of these sectors with the total market – they will tend to move with the general market during an occasional downturn. The Nasdaq Composite is down about 23% from its November 2021 high – the Slack growth portfolio is down about 7 % so far this financial year – Not fun, but I do expect the occasional down year.

Sector correlations with the US stock Market – A Sector that would exactly move up and down with the US stocks would have a correlation of 1.00. Low scores ie Utilities do not move up and down the same way as stocks. – From Morningstar 2000-2018 data

However, I want my Stable Income pile, 30% of non-house wealth, to be much more conservative. It holds annuities, fixed interest products and some shares. The shares in the Stable pile need to have a low correlation with the general stock market – as, when the stock market does poorly, I want this pile to be OK.

For my Stable pile, I choose stock sectors that are not highly correlated with stock market fluctuations (circled in red below). I already have some REITS (Listed Real Estate – Correlation 0.59), and some Consumer Staples (Correlation 0.57) which Perhaps I should buy some more Utilities and REITS (real estate). When I get an opportunity, I would like to buy some Utilities (Correlation 0.40) for the Stable pile.

I am always on the lookout for spurious correlations and the 19-year data set, in the above table seems sufficient (would like longer!). Do the correlations make sense? For example, it seems reasonable that Utilities would have a low correlation with the general market. It is a sector that would be able to keep its earnings and maintain its stock price – even during a market downturn.

An asset that has an even lower correlation to the S&P 500 is Gold – and is often seen as a “hedge” to to the stock market. Over a 20-yr period (2000-2020), Gold has a correlation of -0.28 with Australian Equities and -0.12 with Global Equities

Gold has a low (and at times, negative) correlation to other assets

ETF Securities

Smarter people than Slack Investor provide compelling reasons for including Gold in your portfolio – to improve long term returns. But the pig-headed Slack Investor has not yet overcome his old fashioned view that Gold is a speculative investment that does not earn a dividend or interest.

April 2022 – End of Month Update

Slack Investor remains IN for Australian index shares and the FTSE 100 but OUT for the US Index S&P 500 due to a sell – back in January 2022.

Despite some big daily fluctuations, the FTSE 100 (+0.4%) and The ASX 200 (-0.9%) ended relatively flat this month. All is not well in the USA where inflation fears and some mixed results from the Tech sector allowed the S&P 500 to fall -8.8%.

All Index pages and charts have been updated to reflect the monthly changes – (ASX IndexUK IndexUS Index).

The Slack Buying Process … and August 2021 – End of Month Update

The moneychanger and his wife, by Marinus van Reymerswaele, 1538, Public Domain, via Wikimedia Commons

As much as Slack Investor hates retail shopping – he loves to have the opportunity to buy into companies. Like any new relationship, when you buy a stock, you are not really sure about how its going to work out – but its exciting!

I have never been good at predicting when the stock market will have a correction … and the current high valuations (PE Ratios well above the long term average) do make me nervous. However, Slack Investor would much rather be in the game than out of it and I have been looking for a few companies that would hopefully not suffer too greatly if a correction occurred in the stock market.

This is not advice … just an insight to the Slack Investor bumbling buying process. My rate of converting bought shares into winners of 55% is not that impressive – but my overall performance results are good.

I get heaps of buying ideas from investment sites such as Motley Fool, Livewire, ShareCafe. But I will always, always, check things out for myself before parting with any Slack Dollars. This involves a rigorous screening of the fundamental financial metrics PLUS a look at how the stock chart is going on Incredible Charts. This technical analysis consists of a quick scan to see if the chart is in a continual growth trend … or has just had a “breakout”, or broken out of a downtrend.

Let’s put on the buying boots. As well as the companies below, Slack Investor has also recently added to some small positions in PPK.ASX and TNE.ASX.

Slack Investor Buys Alphabet (GOOGL.NASDAQ)

Half of my buying cash went into an existing holding – Alphabet (GOOGL), This money making juggernaut is part of the new economy and I could buy this company all day. The first step is to go to the phenomenal MarketScreener.com. Registration is free on this site and they allow you to look at analyst data for up to 5 stocks a day.

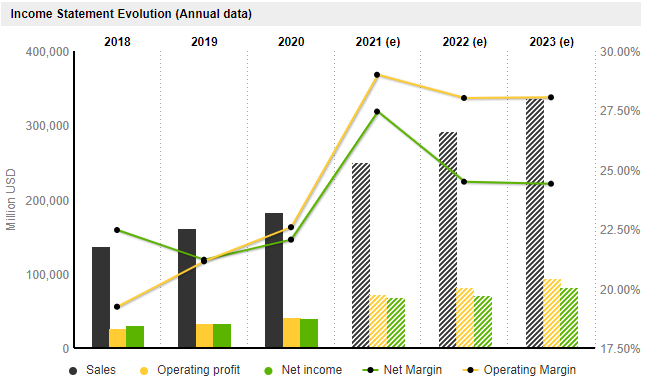
Search for your stock and then finding the Financials Tab for that company. Firstly, I look at the chart Income/Sales and Earnings per Share. An increasing trend is good and, if the estimated earnings (2021 – 2023) are also increasing, I’m acutely interested. I do a quick check on debt levels. Alphabet is a cash king – has more cash than debt – solid tick.

Income statement for Alphabet (GOOGL on the US NASDAQ exchange) – from MarketScreener

I continue with MarketScreener to extract the Return on Equity (ROE), both past and forecast. I hope that it is above 15% – Big Tick. The final bit of vital information is the Price Earnings (PE) Ratio and it is here that I gauge whether the stock price is too high for Slack Investor. For a good growth stock, I try not to buy into companies that have a projected PE of more than 40-(50 at a pinch). The analyst estimates for GOOGL is a forecast PE of 23.0 in 2023 – Tick

YEAR2018201920202021(e)2022(e)2023(e)
ROE18.619.319.027.225.825.2
PE Ratio23.927.229.928.026.623.0
Table of fundamental financial metrics for Alphabet. The documented Return on Equity (ROE) and Price Earnings (PE) Ratio are shown for 2018-2020. Analyst estimates are shown for later years – MarketScreener.com

Slack Investor Buys NASDAQ 100 ETF (NDQ.ASX)

Not everyone has access to direct access to US shares – if you only have an ASX broker, then to get exposure to Alphabet, a good substitute is to buy the BetaShares NASDAQ ETF (NDQ) – Alphabet represents 8.1% of this ETF – and you get profit machines like Apple, Amazon, Microsoft and Facebook thrown in. I topped up my holding here as well.

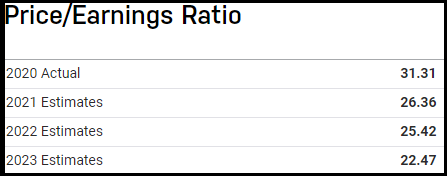
The ROE for the NASDAQ Index is 17.7 and increasing (30 June 21) – Above 15, Tick. The projected 2023 estimate for the Price/Earnings Ratio for the NASDAQ Index is 22.47 – Below 40, Tick – Very reasonable for growth sector companies.

NASDAQ 100 Index 2020 PE Ratios and Forward Estimates of PE for 2021, 2022. 2023 – From nasdaq.com

Slack Investor Buys Coles Group (COL.ASX)

YEAR201920202021(e)2022(e)2023(e)2024(e)
ROE29.832.837.034.933.334.3
PE Ratio12.422.922.423.422.821.4
Table of Fundamental metrics for Coles Group . The documented Return on Equity (ROE) and Price Earnings (PE) Ratio are shown for 2019-2020. Analyst estimates are shown for later years MarketScreener.com

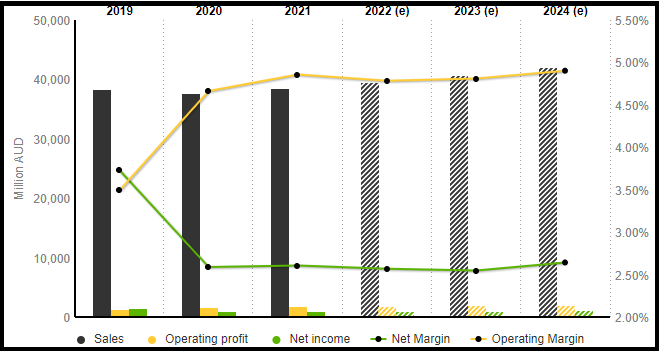
The Return on Equity (ROE) for this retail business is pretty impressive and, the PE Ratio would be pretty good for a growth company – but the Income Chart below reveals that Coles is not really a “growth” company – so the expectation is that the PE Ratios should be much lower, in the early 20’s or below would be the Slack Limits for slow growth companies.

Income statement for Coles Group (COL.ASX) showing a very gradual increase in projected income – Compare this with the Alphabet chart above – from MarketScreener

The income chart shows some pretty shallow growth and the slow earnings per share (EPS) growth makes the Coles Group something that Slack Investor would not usually be interested in. But, I go to Coles Supermarket at least twice a week and I actually like going there as a company part owner. Coles is in the “stable income” section of the Slack Portfolio rather than “Growth”. Even if the worst of times was thrust upon us and there was a recession in the next few years, a business like Coles will keep on performing. I would much rather put up with the price fluctuation of shares and have my money in a business like this at a projected yield of 3.5 – 4% p.a. than have Slack Dollars tied up in cash for 2 years in a Big 4 bank term deposit at 0.3%.

August 2021 – End of Month Update

Slack Investor remains IN for Australian index shares, the US Index S&P 500 and the FTSE 100.

There were significant rises in all followed markets (S&P 500 +2.9%, and the FTSE 100 +1.2%). The Australian stock market is also in record territory (ASX 200 +1. 9%). This is all happening during extensive COVID-19 related lockdowns in the populous South Eastern part of Australia.

Slack Investor is normally relaxed about most things, but I am moving to the edge of my couch and starting to get ready for action. Looking at the monthly charts for all the indexes, in these boom times, the index prices have been getting too far ahead of my stop losses for comfort. I have tightened up my rules for adjusting stop losses upwards.

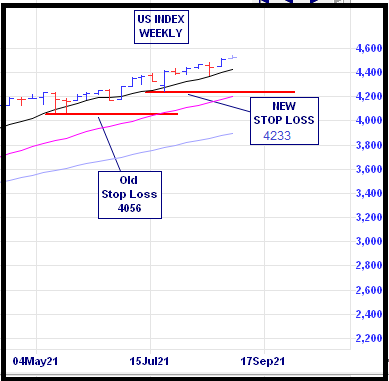
All Stop Losses are live and are being moved upwards every month if the index price exceeds the stop loss by 10% or more. All Indexes have got this treatment this month – It is sometimes difficult to work out where to put the stop losses on the monthly chart. I usually go to the weekly charts and find a minimum on the weekly price range that is within 10% of the current price (see below). If the stock price is below the stop loss at the end of the week – I will usually sell at the next opportunity.

The weekly US S&P 500 Index chart showing an upward adjustment of the stop loss from 4056 to 4233 – Thanks Incredible Charts

All Index pages and charts have been updated to reflect the monthly changes – (ASX IndexUK IndexUS Index).

Three Pile Theory

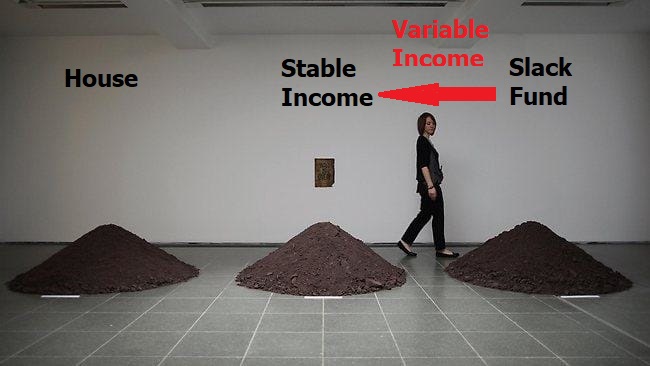
– Adapted from  ‘Three Mounds’ by Yoko Ono is displayed at the Serpentine Gallery on June 18, 2012 in London, England – From Getty Images.

With apologies to Yoko for interfering with her art, but Slack Investor first thought of his own “Three Pile Theory” back in 1989 when I had got myself a “Proper Job” and enough stability in my life to make the big plunge into Real Estate. At that time, I owned a few grains of dirt in my House pile (the Bank owned the rest), My income was OK, and my investments (which would later morph into the Slack Fund) contained a few thousand dollars in shares.

Now, 32 years later, Slack Investor still has these three financial pillars to keep himself steady.

  • House – Home ownership gives me great security and pleasure. The bank owned most of this 30 years ago – but now I have the upper hand! (~30% of Net Worth)
  • Stable Income – This used to be my job, but in retirement I have some stable income annuity style investment (~20% of Net Worth) that would pay my bills and maintain a basic Slack Lifestyle should Armageddon befall the stock markets for a few years. This income is supplemented by income from the Slack Portfolio.
  • Slack Portfolio Investments – (~50% of Net Worth) – Now currently in my Self Managed Super fund (SMSF) which is almost exclusively invested in growth companies. These are great businesses to be invested in if you have a long term horizon – however, stock prices can be volatile in these high Return on Equity (ROE) companies. I am currently retired and do not rely on the Slack Portfolio for stable income. Because of the stability of my other two pillars, I can be quite aggressive in the allocation of my investments in the Slack Portfolio – as I know I will not have to panic sell (for income) during any downturn.

Slack Investor didn’t really invent “Pile theory” – it has been around for a while in various guises – Three Buckets is a tried and true way to manage your retirement expenses by dividing your retirement stash into buckets of cash, conservative investments and more risky, growth investments.

House

My home may not feel like a palace to you, but to me, it is a whole Kingdom.

Prerona Chatterjee

There are some who argue that you are financially better off by renting over a 10-year period rather than buying. But for Slack Investor, the tax advantages – no capital gains tax on your own home in Australia; the leverage – banks are usually willing to lend at least 80% of the house value; the forced saving – your mortgage payment is a big monthly portion of your income which you set aside for a long period; and, the stability provided by home ownership make this a clear winner for me. “The Serenity” is just a bonus.

Stable Income

To cover living expenses and to give yourself “peace of mind” it is so important to have a slab of money that is not subject to the vagaries of the sharemarket. In Australia, if you haven’t enough super to go independently, you might qualify for a full or part pension.

If going the fully self-funded route, many advisors recommend your stable income should be in two parts. You should work out your living expenses for a year and then keep between 2 and 5 years worth of expenses in stable cash deposits – Let’s start with 3 years of expenses in accessible cash. The rest of you stable income pile can be in longer term cash deposits, bonds or REITS. Because the investments pile (Slack Portfolio) is in growth shares that can be very volatile, my stable income must be something that is not highly correlated to to the sharemarket.

Term Deposits– although interest rates are woefully low now on bank term deposits, it is still possible to get ~1% p.a. from some of the minor banks that still have the Government Guarantee for the first $250 000.

Vanguard Australian Fixed Interest Index ETF (VAF)

MER (0.20%) – Annual performance over 1/5 years – (3.81%/4.41%)

Vanguard Australian Government Bond Index ETF (VGB)

MER (0.20%) – Annual performance over 1/5 years – (4.08%/4.49%)

Challenger Fixed Term Annuity – Rates are pretty low at the moment, locking away a deposit for 5 years will earn a measly 1.65%.

Real Estate or Real Estate Investment Trusts (REIT) – these are a bit higher up the risk curve but as they produce income (rent) and can be associated with longer term leases – are usually less volatile than the share market. For example, Vanguard Australian Property Securities Index ETF (VAP) – MER (0.23%) – Annual performance over 1/5 years – (-13.3%/6.23%)

Investments – The Slack Fund

Because the Slack Portfolio is mostly in growth shares, I have steeled myself that this particular pile is volatile and changes value every day. I am prepared for a few low performing (or even negative) years in a row for this pile. Even great investors that have much more knowledge than Slack Investor have the occasional bad year – during some periods, share investments just perform poorly. I am accepting of this truth.

Because this Investment pile is mostly in my Self Managed Super Fund (SMSF), I am usually obliged to withdraw 4% of its total value each year – this percentage increases with age – but this payment is currently tax free for those over 60. I can use this income in a discretionary way. My living expenses should be covered by income from the Stable Income pile – and any other income is gravy.

Pile Rebalancing

Once you are in a house that you are happy in and hopefully will be near paying off any outstanding loans as you get into retirement – other than maintenance, you can leave this pile alone.

The Stable Income cash pile might occasionally need a bit of topping up from the longer term stable Income or Investments fund. Any dividend or interest income from your investments is fair game. The investment Slack Fund usually produces 2 -3% income.

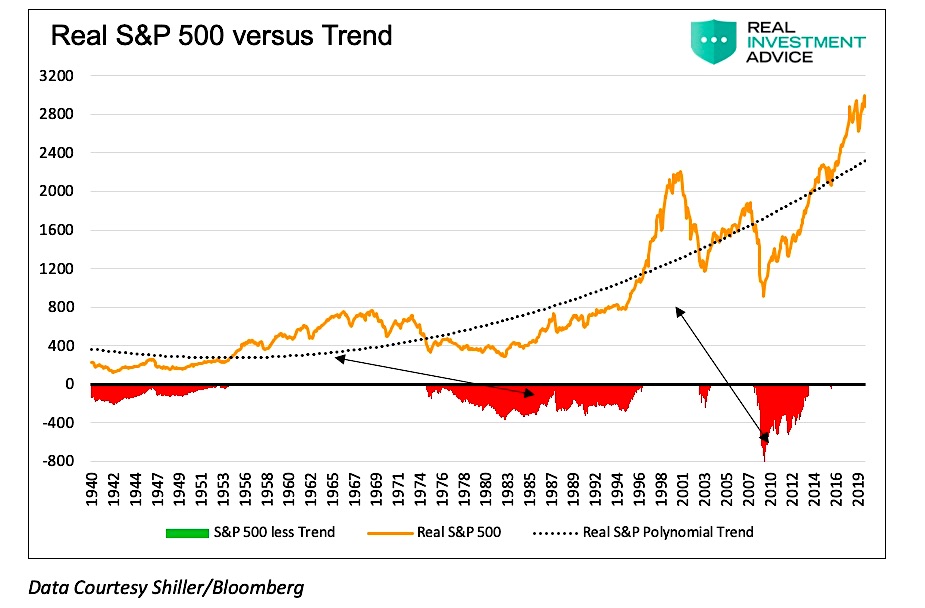
Hopefully, with 3-years worth of living expenses in the stable income pile, you can ride out a few bad years in the share market and only sell shares to top up the stable income pile when the share market has had a good run. Ideally, you would only sell share assets out of this pile when the share market is above the long term trend line. However, realistically, from the chart below (in red) there are long periods when the market is below trend. Have no fear, your basic expenses are always covered by a mixture of stable income, interest and dividends.

The long term chart of the US S&P 500 with the dotted inflation-adjusted long term trend line – from seeitmarket.com

There are other piles worthy of attention such as Health and Relationships but the finance stuff is necessary too. So get the shovel out … and start working on those piles!

Cash is not King

From memegenerator

My nephew is a carpenter and he would often gleefully say “Cash is King” when offered a cash job – no paperwork and no tax. This was fine for him as he was on a travel holiday and didn’t want the hassle of being on the books and claiming his tax back at the end of his holiday.

But, to the investor, Cash is not King.

If you hold too much of your wealth in cash, you won’t be able to keep pace with inflation, meaning your purchasing power will go down and it will be more difficult for you to achieve your goals.

Black Swan Capital

Slack Investor cannot argue that money in the bank is not safe, The government guarantees balances up to $250,000.

Cash is important for day to day expenses and your emergency cash buffer, “the cushion” to keep you going for about 2-3 months in an emergency. However, to get on the path to financial independence you must invest in appreciating assets.

Term Deposits, Bonds and Fixed Interest

For a relative, Slack Investor was trying to find a place where cash would earn a decent rate – without too much risk. There is not much around. Most transaction accounts pay no interest or 0.1% interest per year. If you are prepared to lock your money away for a year in a term deposit in a major bank, you might get 0.85%. One of the newer banks, Judo Bank, is offering 1.01%.

There are a few offerings in the bonds and fixed interest area. I ended up in the Vanguard Australian Fixed Interest Index Fund with a management fee of 0.24% and 1 and 3 year returns of 3.2% and 4.7%, respectively. The fund lends money to mostly government authorities – but, unlike term deposits, the returns are not guaranteed. A similar product is offered as an Exchange Traded Fund Vanguard Australian Fixed Interest Index ETF (VAF).

Growth Assets – Shares and Property

Higher up the risk curve are funds based upon share (equity) investments. In these funds or ETF’s the rewards can be higher – but the risks are also much greater. Only invest in shares or share funds with money that you can lock away for 3 to 5 years.

To grow wealth we must have exposure to growth assets such as shares and property.

Shane Oliver, AMP
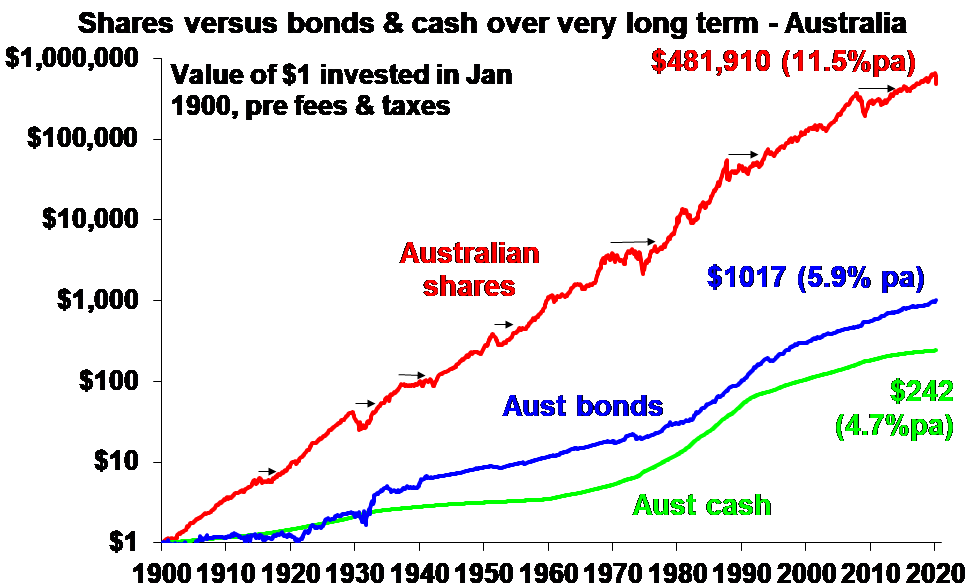
Asset classes shown on a logarithmic scale for the past 120 years – From “5 charts to help you through COVID-19 investment fear” – Shane Oliver

Australian shares have returned on average 11.5% per year from 1900 to 2020. The incredible value of sustained compounding over long periods is shown by the dollar amounts achieved over 120 years – A $ 1 investment yielded $481, 910 for Australian Shares, $1017 for Bonds and a paltry $242 for cash. But these high returns on investment in Australian shares did not come without risk. Since 1900, Australian shares have had negative returns for two years out of ten.

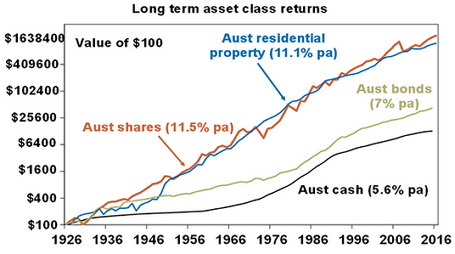
A similar chart with data to 2016 shows that Australian residential property has a similar trajectory to Australian Shares (11.1% p.a.). There are many hidden costs to owning property – but that is another story. Lower on the risk curve, are Bonds and Cash.

Slack Investor acknowledges that people have different appetites to risk, but if you are in the fortunate position to be sitting on some cash in excess of your emergency fund … the current rates for term deposits encourage a first journey up the risk curve and consider fixed interest funds or ETF’s. For money that you wont need for the next 3-5 years, then shares have the best long term returns. If your time frame is longer, then a well positioned property has been a good investment.

“Twenty years from now you will be more disappointed by the things that you didn’t do than by the ones you did do. So throw off the bowlines. Sail away from the safe harbor. Catch the trade winds in your sails. Explore. Dream. Discover.”

H. Jackson Brown Jr. from Goodreads