The obvious answer is … where there are fish.
Slack Investor is always on the lookout for growth companies … particularly when he is on the BUY! Since retirement, I haven’t had much chance to be on the Buy side of a transaction lately – as there isn’t that flow of fresh new money coming into the coffers from employment. Pre-retirement, any new money would flow into the cash reserves of my Super (SMSF -Self Managed Super Fund). When a sufficient amount of cash had built up, I would look around for some company shares to buy.
However, with the expected inflow of a bit of cash with the impending sale of Altium, I am starting to look around for suitable receivers of Slack Investor loot. Slack Investor is “Going Fishing”. The first thing I want in my pond is profitable companies – but I also want them to have a record of growth. In the second part of this fishing series, I will try to narrow things down to companies that I would actually like to buy.
Measures of Profitability
Slack Investor likes a company, that he invests in, to not only make a profit – but to use its shareholder funds in the best way to make a profit. There are many ways to look at profitability, but Slack Investor is pretty lazy in this regard and you won’t find him forensically gazing over profit and loss statements from a company report. I prefer couple of simple ratios to get an overview – I am no expert accountant.
Return on Equity (ROE)
ROE = Net Income/Shareholder Equity
I have always used Return on Equity (ROE) as a simple measure to give an idea on how a company is growing. Strictly speaking, the ROE is more a measure of profitability and how well it grows each dollar of company funds.
The higher the ROE, the more efficient a company’s management is at generating income and growth from its equity financing.
Investopedia
This metric is very easy to find in market aggregator sites such as Yahoo.com, Morningstar, or Investing.com. For a deep dive, I prefer Marketscreener.com – which has the advantage of showing Predicted ROE for the next few years on each companies financial page. One of the problems with ROE is that, companies with debt can present an inflated ROE.
Return on Invested Capital (ROIC)
ROIC = Net Profit (After Tax)/Average Invested Capital
The purest way of looking at how good a company is in converting shareholders money into profit is the ROIC. Unfortunately, this figure is harder to come by on the generic financial aggregator sites. This ratio is superior to the ROE as it accounts for the debt levels of a company – as the Average Invested Capital is the Average Equity – Average Debt.
Measure of Growth
Compound annual growth rate (CAGR)
A quick way of determining if a company is growing is the CAGR. It is often constructed from past , data. The “Compound Annual Growth Rate”—is the annualized rate of growth in the value of the Earnings, or Revenue, over a stated period. The maths is a bit complicated and best done on a spreadsheet or a search around the financial sites. I found limited CAGR data for stocks at Morningstar and finbox.com
CAGR is defined as the annualized growth rate in the value of a financial metric – such as revenue and EBITDA – or an investment across a specified period.
Wall Street Prep
Putting together Profitability and Growth
Fortunately there are some really nice blokes in the financial world that share the burden of responsibility to educate people about the share market as well as operating a profitable business. A shout out to Owen Raszkiewicz of the RASK Group. A great place to start your financial education with Owen is his Australian Finance podcast that he co-hosts with Kate Campbell. Slack Investor will often tune in to their discussions.
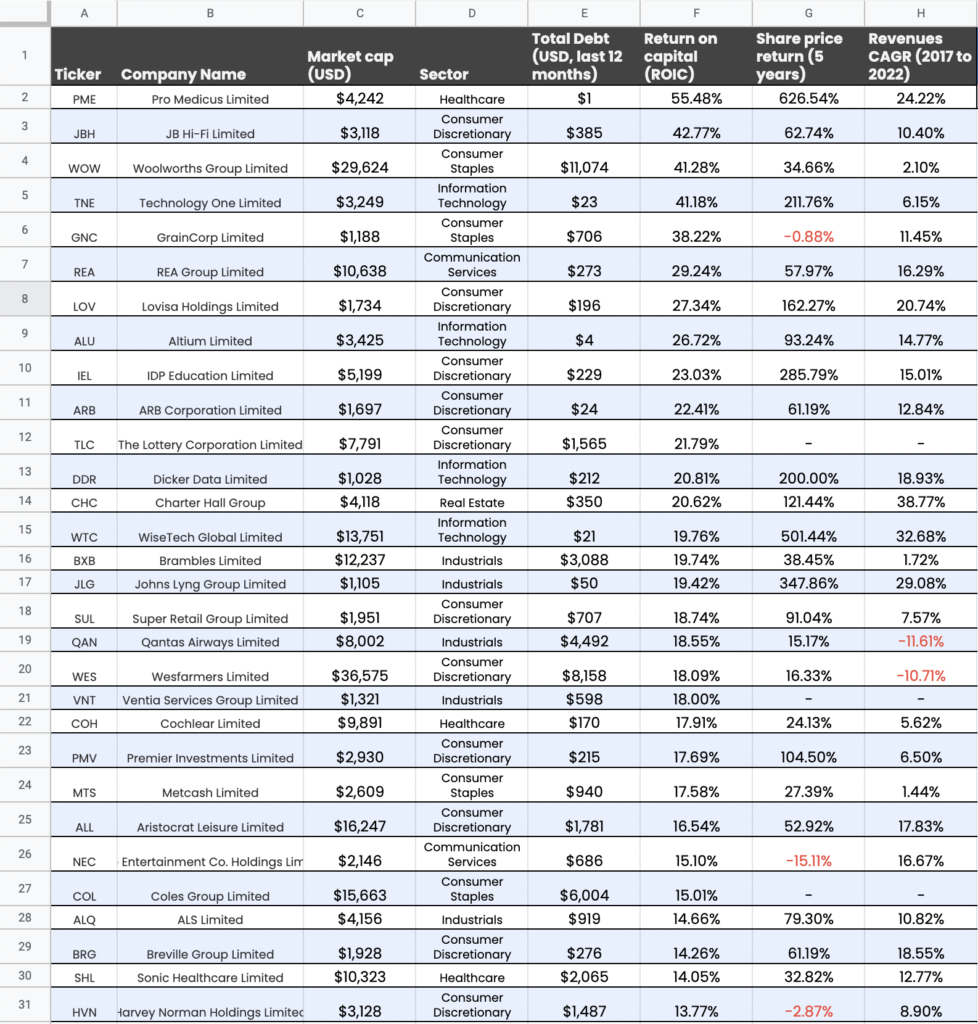
Below is a table Owen prepared in August 2023 that ranks Australian stocks in terms of their profitability (ROIC – Return on Invested Capital – Column F). He also shows, in the last column, the stock’s historical growth rate for the 5 years 2017-2022.

This is a great place to start fishing, metrics for profitability and growth in one place. Pro Medicus is standing out here – High profitability (ROIC 55.48%) and high historical growth (5-yr CAGR 24.22%). A complete picture needs both of these metrics. For example, Woolworths has a high profitability (ROIC 41.28%) but is laggard in historical growth (5-yr CAGR 2.10%).
The next article in this series will look at how Slack Investor narrows these stocks down and then screens them further with the P/E Ratio to try to make sure that each potential buying stock is not overpriced.
