Alignment

Four of the planets that are visible to the naked eye – Saturn, Mars, Venus and Jupiter were aligned on April 24, 2022 at 4.40am visible from Southbank, Melbourne – SBS Australia

We have 8 planets in our solar system (sorry Pluto!) all whizzing around the sun at different rates, occasionally they “align” when the planets line up or appear close together in a small part of the sky .

Planetary Alignment is a special thing, depending on which planets are involved – and their order. Sadly, Slack Investor wasn’t paying attention when 4 of the 5 planets visible to the naked eye (Mercury, Venus, Mars, Jupiter and Saturn) appeared in a line around the world on April 24 2022.

The bright string of lights in the morning sky (in April 2022) is thought to be a one-in-1000-year event.

Australian Geographic

Slack Investor is coming to the planetary alignment party very late and is now setting his sights on September 8, 2040, when five naked-eye planets (Mercury, Venus, Mars, Jupiter, and Saturn) will be within a circle of 9 degrees in the sky.

Investing alignment

Slack Investor may be a poor astronomer but one of his skills is noticing when two of the most important attributes in the stock market have an alignment – Value and Momentum.

Value investing involves looking at stocks that appear to be trading for less than what they are worth using a value screener like “book value” or the Price/Earnings ratio. Slack Investor likes to use the Cyclic Adjusted Price Earnings Ratio (CAPE) as a broad indicator of value – the lower the CAPE, the better the value.

Momentum investing just uses charts and indicators to pick out the current movement of a stock. Based upon the theory that – If the trend is upwards … it is likely to continue upwards. This is tricky though … the trend is your friend … until it isn’t!

Because trend trading is difficult, I always like a bit of assurance or alignment with value. Ideally, I like value and momentum in a stock before parting with Slack cash.

Value

It has been 6 months since I produced a set of index value charts based upon CAPE to look at how the markets are travelling.

As with individual companies, the whole share market will oscillate between overvalued and undervalued. Slack Investor has written about the Cyclically Adjusted Price to Earnings ratios (CAPE) which use ten-year average inflation-adjusted earnings. By plotting this CAPE over a period of time, we can look at how the whole sharemarket is currently valued in terms of historical data.

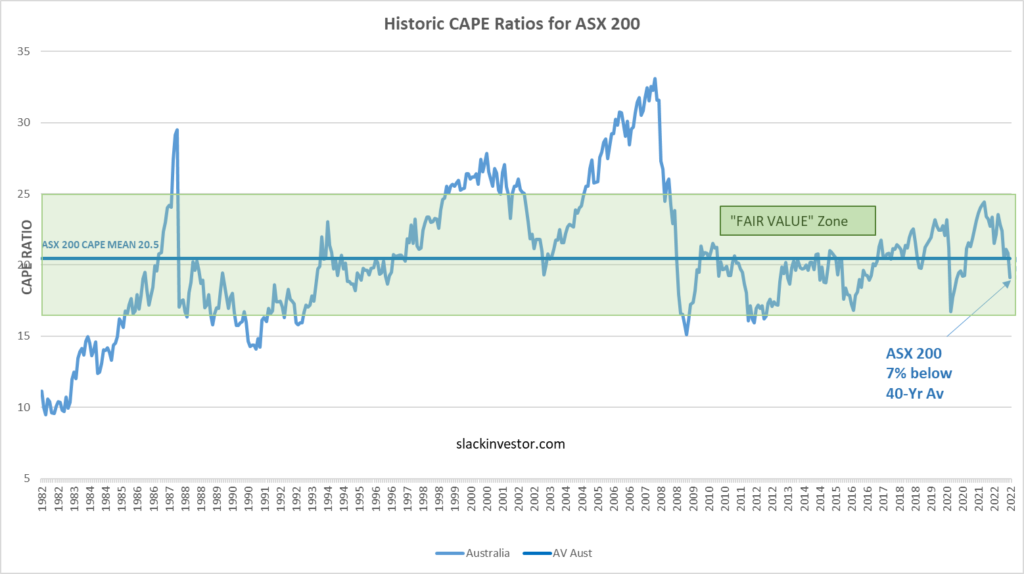
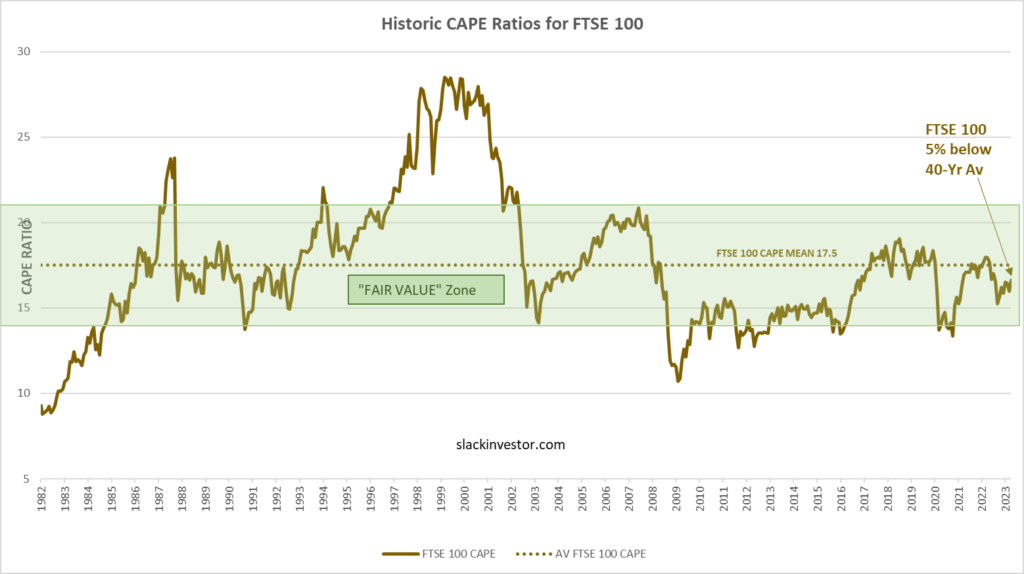
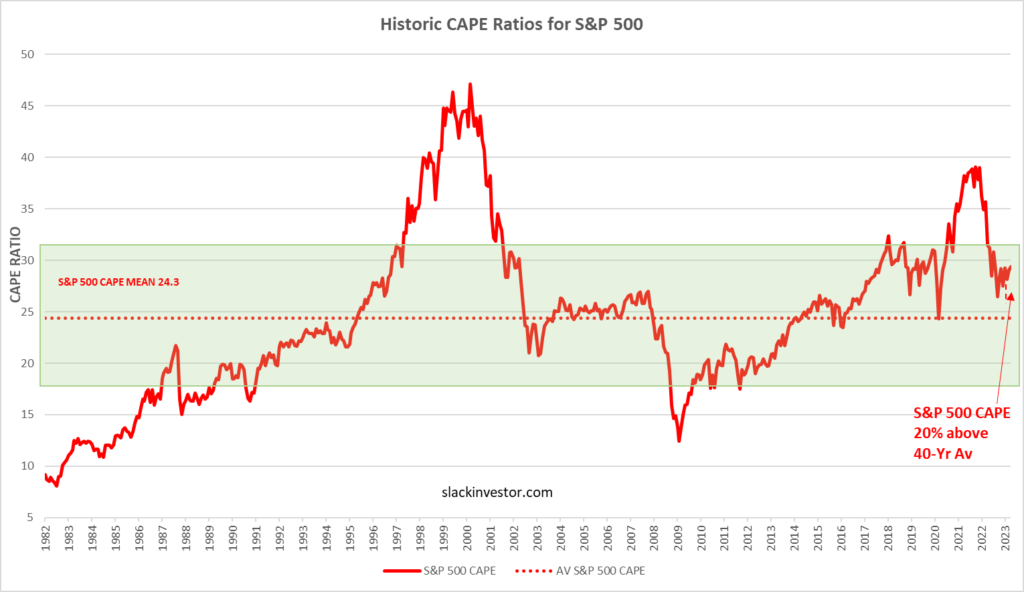
Using monthly CAPE data from Barclays, the 40-yr mean is calculated and plotted together with the CAPE values. A “fair value” zone is created in green where the CAPE is within one standard deviation of the mean.
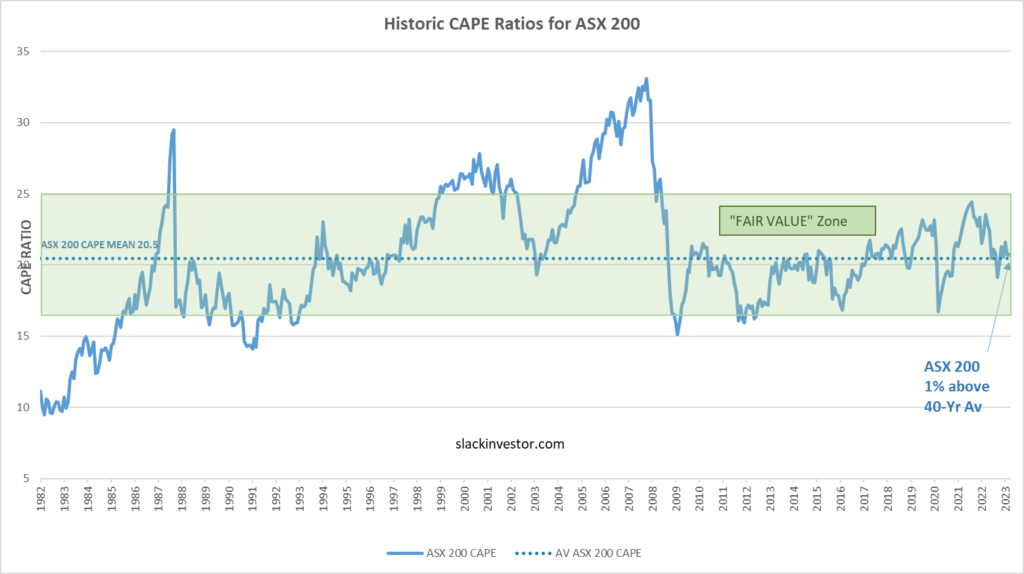
Historic CAPE ratios for the ASX 200 – From 1982 to April 2023– Click the chart for better resolution.
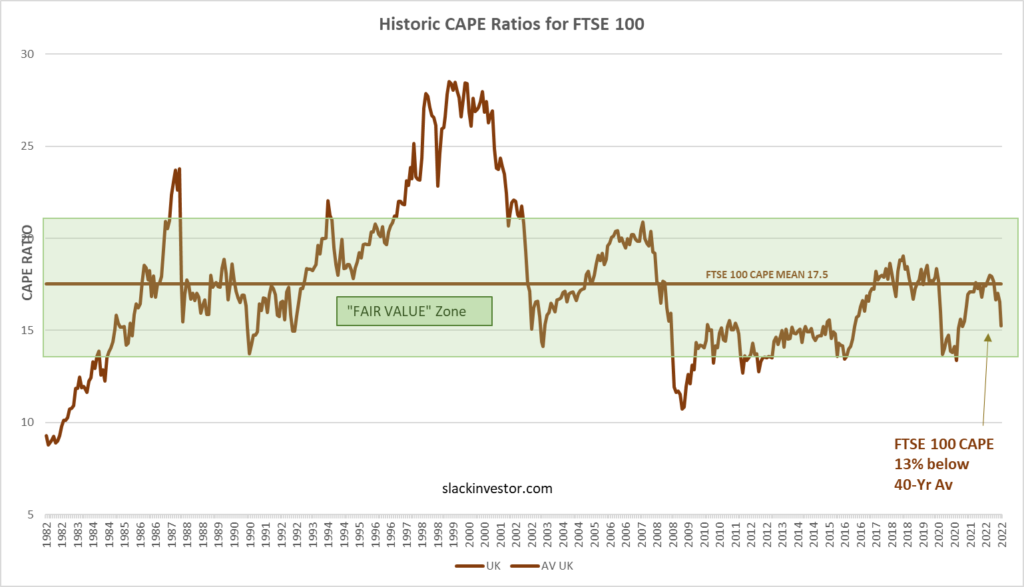
Historic CAPE ratios for the FTSE 100 – From 1982 to April 2023– Click the chart for better resolution.
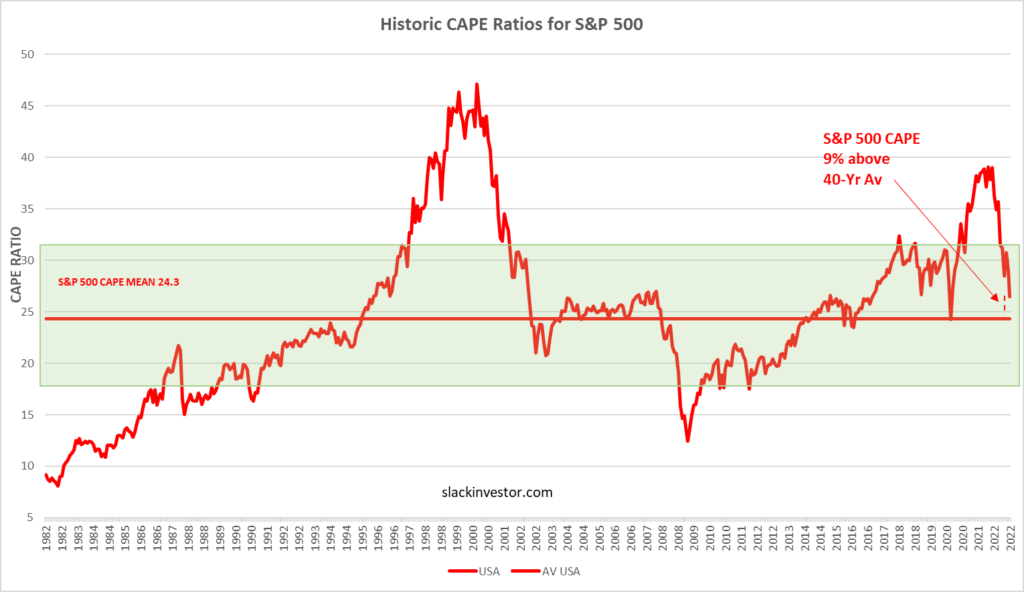
Historic CAPE ratios for the S&P 500– From 1982 to April 2023 – Click the chart for better resolution.

From the above, The ASX 200 is right on fair value (1% above av.) and the FTSE 100 is cheap (5% below av.). Both are worth looking at for the moment as their CAPE values are at, or below their long-term averages. The S&P500, is still in the “Fair value” range, but at 20% above the long term average – so, no bargain here.

Momentum

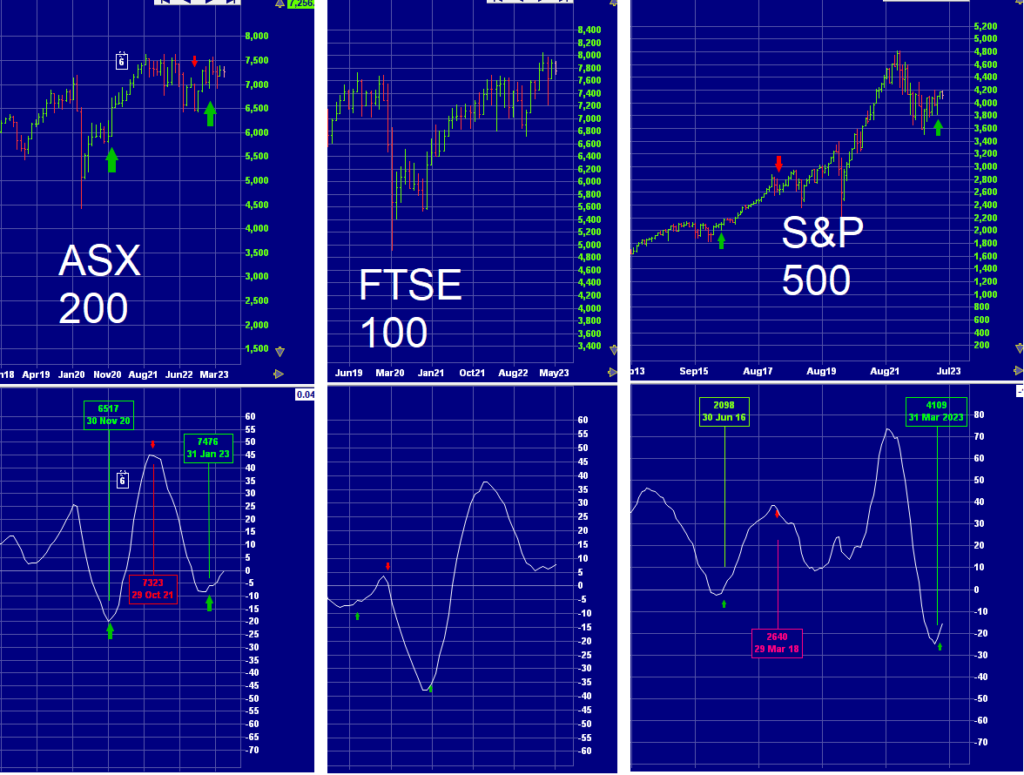
There are lots of stock indicators that track momentum. Slack Investor has blogged about The Coppock Indicator before. It has had an incredible track record in signalling the end of a “bear market”. The signal (Green Arrow) is triggered when the indicator (shown in the lower screens below as a white line) bottoms from under the zero line and then slopes upwards.

Monthly charts of the ASX 200, FTSE100 and S&P500 together with the Coppock Indicator (White Line) in the lower section of each chart. The green arrows show the “bottom of the market” predictions using the Coppock Indicator. The red arrows show a possible time to sell – Click the chart for better resolution – Incrediblecharts.com

The ASX 200 (Since 31 Jan 2023) and the S&P 500 (Since 31 Mar 2023) are showing signs of recovery from the bear market with the is well into the Coppock recovery cycle. The FTSE 100 is also showing signs of recovery, but as the Coppock indicator did not get below the zero line, this is not a proper Coppock reversal.

Alignment of Value and Momentum Together

Slack Investor will again rant about how market timing is difficult and that the best time to buy stocks is “all the time” – by automating your investments so that their is no decision inertia. Use dollar cost averaging.

However, the Coppock Indicator has been reliable so far in predicting stock gains. This is not advice, but the ASX 200 currently has the alignment of both value and momentum indicators. Alignment is good … If I wasn’t already fully invested, I would have a crack!

Finding Value … and October 2022 – End of Month Update

Widewalls

In amongst the general carnage of the market, Slack Investor has been doing a little buying. An opportunity came up with an existing holding. Dicker Data (DDR). DDR is an Australian-based technology hardware, software and cloud distributor.

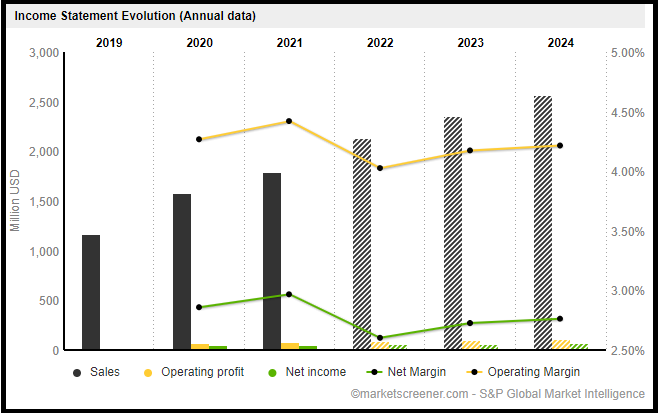
From time to time, a company will go to institutions and shareholders to raise a bit of working capital using a Share Purchase Plan (SPP). Dicker Data (DDR) needed to expand its warehouse facilities. Fair enough – but does Slack Investor want to part with more cash to invest in this company? Lets take a fresh look using the excellent Market Screener Financials Page. The Slack “basics” of a high return on equity (38.7% in 2022) and projected growth – on top of an established period of growth – are still intact – Tick

DDR – Historical (Black)and analyst projected income growth (grey) till 2024 – Market Screener

The price of DDR has been generally “beaten up” in the last 6 months as interest rates have risen and growth stocks have suffered. There are probably some more tough times ahead … but Slack Investor likes to take the “long view”. This business has a long term growth strategy and will probably persevere despite current headwinds – Tick.

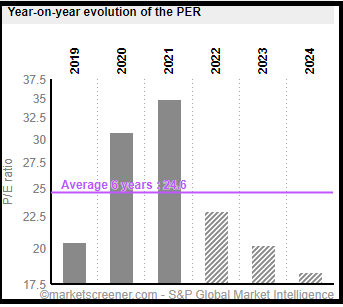
DDR – Analyst projected PE ratio till 2024 – Market Screener

The current DDR Price/Earnings ratio is 22.9 – below recent values and projected to reduce further as income increases. – Tick.

Although analyst predictions can be wrong, on balance, the miserly Slack Investor was happy to part with a few dollars in this Share Purchase Plan as he could find some value in this business. There is every prospect that the DDR share price will increase in the next few years.

Finding Index value using CAPE

As with individual companies, the whole share market will oscillate betwee overvalued and undervalued. Slack Investor has written about the Cyclically Adjusted Price to Earnings ratios (CAPE) which use ten-year average inflation-adjusted earnings to take out some of some of the volatility of annual earnings. By plotting this CAPE over a period of time, we can look at how the whole sharemarket is currently valued in terms of historical data.

Using monthly CAPE data from Barclays, the 40-yr mean is calculated and plotted together with the CAPE values. A “fair value” zone is created in green where the CAPE is within one standard deviation of the mean.
Historic CAPE ratios for ASX 200 – From 1982 to September 2022
Historic CAPE ratios for FTSE 100 – From 1982 to September 2022
Historic CAPE ratios for S&P 500 – From 1982 to September 2022

From the above, The ASX 200 (7% below av.) and the FTSE 100 (13% below av.) are “On Special” at the moment as their CAPE values are below their long-term averages. Even the S&P500, after a long 2-yr period of being “Over valued”, is now getting close to being “Fair valued”.

October 2022 – End of Month Update

Slack Investor remains IN for Australian index shares though it is still on watch after breaching its stop loss at the end of September 2022.

My last post described how I had left the UK and US Index in the middle of October 2022. I am now back IN to the US Index – and, for the moment, OUT of the UK Index. Although, I am keeping a weekly watch on the FTSE 100 in case there is a signal to return to the market.

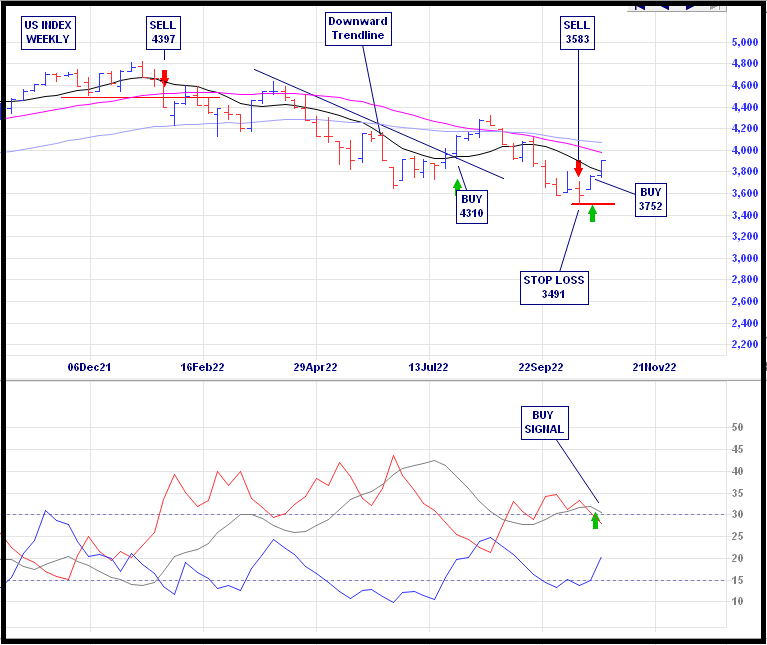
This month illustrates why I feel glad that my 20-yr index timing experiment is coming to an end in 2024. After exiting the US and UK markets only 2 weeks ago, there has been a rally in both the US Index S&P 500 and (to a lesser extent) the FTSE 100. The momentum has been sufficient for Slack Investor to be “whip-sawed” back into the US Index on a weekly buy signal – I am starting to get “really over” this timing the market experiment.

For the experiment, Slack Investor uses a trend following (or momentum) system called the Directional Movement Index. The buy signal shows itself as a downward dip in the ADX (grey line) of the lower panel below. There are many ways of setting up this system. Slack Investor likes the “smoothing” that is enabled by a system that looks back over the previous 11 periods – but the complexities are best left for the Resources page.

S&P 500 Weekly chart showing a BUY signal on the Directional movement Index weekly chart. The weekly price ranges are at the top and Average Directional Movement Index (ADX) patterns below – From Incredible Charts

This month, there are positive movements all round. The ASX 200 +6.0%, the FTSE 100 +1.6% and the S&P 500 +8.0%.

All Index pages and charts have been updated to reflect the monthly changes – (ASX IndexUK IndexUS Index).