The last time Slack Investor wrote about how he buys shares was two years ago, and The Slack Buying Process is worth a read for the detail. I must admit that not much has changed in the method that I use. Two of the shares that I bought back then Alphabet (US:GOOGL) and Betashares NASDAQ 100 (ASX:NDQ) have done OK in that time period, but Coles (ASX:COL) has lagged a bit, but because of dividends, is not on the losing pile yet.
| Buying Price AUG 2021 (AUD) | Current Price SEP 2023 (AUD) | |
| US:GOOGL | $195.45 | $214.53 |
| ASX:NDQ | $34.09 | $36.28 |
| ASX:COL | $17.94 | $15.85 |
Regardless of these preliminary two-year results, nothing fundamentally has changed for these companies and will stick things out for at least a 5-yr period – and then judge performance.
Since retiring, not much buying and selling goes on in my stable pile. For the investing pile, as I am now mostly a fully-invested “Buy and Hold” type of bloke, I don’t get to buy very often. The only opportunities come when I sell something, or my dividends build up beyond my living expenses.
The first thing to do is get a list of companies that you might be interested in. Slack Investor is an avid reader of the financial press. I get heaps of buying ideas from investment sites such as the AFR, Livewire, Morningstar, ShareCafe, InvestSmart, Motley Fool, etc. I pay particular attention when any articles I read mention “growth”.
Unlike when I am buying fish, for buying shares, I really want to look at the “guts” of a company. For this purpose, my best friend is the excellent Market Screener site. I type in the company name and then look at the Financials Tab. This gives me an overview of what the company has done and what analysts project that a company will do. There are lots of things to look at when evaluating a company – Management team, past performance, level of debt, projected sales, etc. However, if I could boil down a company to its essence with just two financial measures, it would be these two discussed below.
Return on Equity (ROE)
The ROE is usually expressed as a percentage and is the Companies
ROE = Stated Net Income/ Shareholder Equity.
For an instant way to look at whether a company is profitable, they will report a positive ROE. It is an indicator of how well the company uses shareholder funds. If I was getting a 5% return on my money in the bank, my ROE for that investment would be 5%. Obviously a high ROE is good. Slack investor likes his investments to have an ROE of at least 15%.
Sadly, the ROE can sometimes be manipulated by the management team by using a number of tricks. They might use accounting loopholes to distort earnings, or hiding assets off the balance sheet – both of these tricks will inflate the ROE.
As the denominator of the ROE equation is just shareholder equity, it ignores the effect of borrowings. Companies can boost their ROE by taking on large loans (risk). Also, a company with a large cash reserve (desirable for potential take-overs and share buy backs) will be penalised in the ROE calculation.
By screening out companies with large debt and including only companies with a track record of good management,- you can try to mitigate these risks in ROE calculation. Slack Investor is always looking forward, and he likes to use the Projected ROE of Future Income/Shareholder Equity.
Price/Earnings Ratio (PE)
The PE Ratio is defined as a companies share price to its earnings per share.
PE Ratio = Current Share Price/ Current Earnings per Share.
Slack Investor is usually looking at “growth” companies with a relatively high PE Ratio. A high PE ratio could either mean that a company’s stock is overvalued, or that there is an expectation that there might be high growth rates in the future.
By itself, the PE Ratio can be misleading. Sometimes, the earnings of a company can be manipulated through accounting measures and, there is a flaw in this ratio as it does not account for the assets and liabilities of a company.
A PE ratio is best used when compared against similar companies in the same industry or, for a single company across a period of time. Slack Investor usually gets the jitters when the projected PE Ratio is over the 40-50 mark.
Putting it all together
| PE 2026 | ROE % 2026 | |
|---|---|---|
| ASX | 20 | 14 |
| CPU | 16 | 33 |
| TNE | 38 | 34 |
| XRO | 62 | 20 |
| SEK | 25 | 11 |
| COH | 38 | 23 |
| RMD | 18 | 22 |
I put all my possible “growth” stock buying options into a table and used Market screener Financials to get the projected (future) values for PE Ratio and ROE for 2026. I rejected XRO as it was too expensive (PE Ratio greater than 40) and ASX and SEK for low ROE ( <15%). TNE is a great company with good ROE and no debt, but slightly expensive (ROE 38). COH was also slightly expensive (ROE 38).
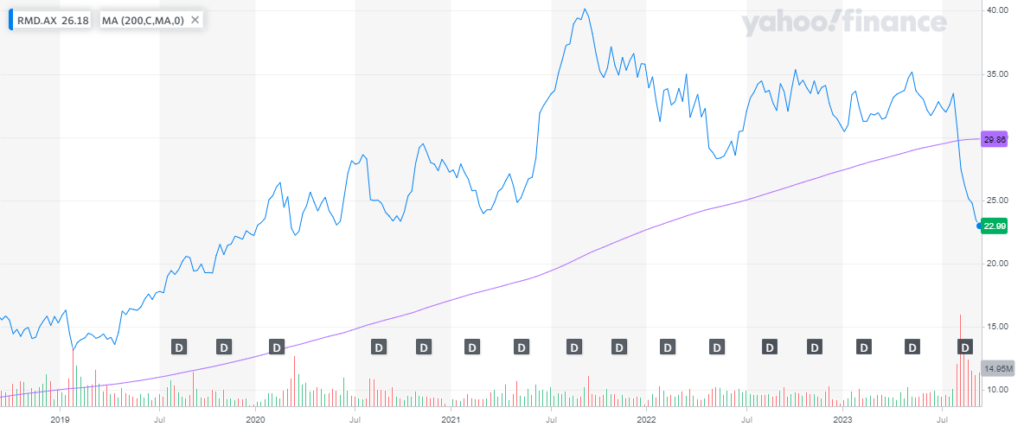
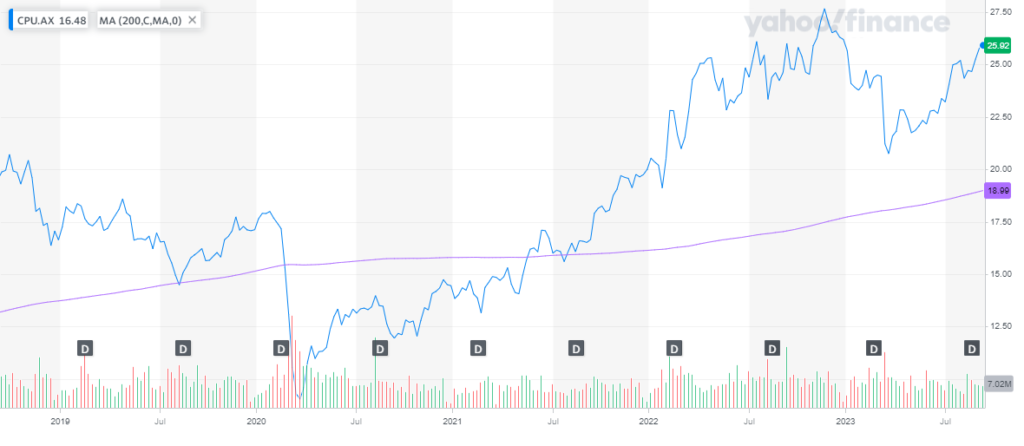
This left me with CPU (Computershare) and RMD (Resmed). Both good companies with good prospects. Lets have a look at the charts.


For now, Resmed (RMD) seems to be on a downward trend – and Computershare (CPU) on the up. The trend is your friend. This is not advice, but I bought some Computershare on the basis of the above analysis – slightly worried about the debt levels of CPU (which would tend to inflate the ROE), but I bought a small amount and will give this investment 5 years – then re-evaluate.
