Where to go fishing? – Part 1 – Profitablity and Growth

A Day’s Fishing (circa 1923)Edward Henry Potthast

The obvious answer is … where there are fish.

Slack Investor is always on the lookout for growth companies … particularly when he is on the BUY! Since retirement, I haven’t had much chance to be on the Buy side of a transaction lately – as there isn’t that flow of fresh new money coming into the coffers from employment. Pre-retirement, any new money would flow into the cash reserves of my Super (SMSF -Self Managed Super Fund). When a sufficient amount of cash had built up, I would look around for some company shares to buy.

However, with the expected inflow of a bit of cash with the impending sale of Altium, I am starting to look around for suitable receivers of Slack Investor loot. Slack Investor is “Going Fishing”. The first thing I want in my pond is profitable companies – but I also want them to have a record of growth. In the second part of this fishing series, I will try to narrow things down to companies that I would actually like to buy.

Measures of Profitability

Slack Investor likes a company, that he invests in, to not only make a profit – but to use its shareholder funds in the best way to make a profit. There are many ways to look at profitability, but Slack Investor is pretty lazy in this regard and you won’t find him forensically gazing over profit and loss statements from a company report. I prefer couple of simple ratios to get an overview – I am no expert accountant.

Return on Equity (ROE)

ROE = Net Income/Shareholder Equity

I have always used Return on Equity (ROE) as a simple measure to give an idea on how a company is growing. Strictly speaking, the ROE is more a measure of profitability and how well it grows each dollar of company funds.

The higher the ROE, the more efficient a company’s management is at generating income and growth from its equity financing.

Investopedia

This metric is very easy to find in market aggregator sites such as Yahoo.com, Morningstar, or Investing.com. For a deep dive, I prefer Marketscreener.com – which has the advantage of showing Predicted ROE for the next few years on each companies financial page. One of the problems with ROE is that, companies with debt can present an inflated ROE.

Return on Invested Capital (ROIC)

ROIC = Net Profit (After Tax)/Average Invested Capital

The purest way of looking at how good a company is in converting shareholders money into profit is the ROIC. Unfortunately, this figure is harder to come by on the generic financial aggregator sites. This ratio is superior to the ROE as it accounts for the debt levels of a company – as the Average Invested Capital is the Average Equity – Average Debt.

Measure of Growth

Compound annual growth rate (CAGR)

A quick way of determining if a company is growing is the CAGR. It is often constructed from past , data. The “Compound Annual Growth Rate”—is the annualized rate of growth in the value of the Earnings, or Revenue, over a stated period. The maths is a bit complicated and best done on a spreadsheet or a search around the financial sites. I found limited CAGR data for stocks at Morningstar and finbox.com

CAGR is defined as the annualized growth rate in the value of a financial metric – such as revenue and EBITDA – or an investment across a specified period.

Wall Street Prep

Putting together Profitability and Growth

Fortunately there are some really nice blokes in the financial world that share the burden of responsibility to educate people about the share market as well as operating a profitable business. A shout out to Owen Raszkiewicz of the RASK Group. A great place to start your financial education with Owen is his Australian Finance podcast that he co-hosts with Kate Campbell. Slack Investor will often tune in to their discussions.

Below is a table Owen prepared in August 2023 that ranks Australian stocks in terms of their profitability (ROIC – Return on Invested Capital – Column F). He also shows, in the last column, the stock’s historical growth rate for the 5 years 2017-2022.
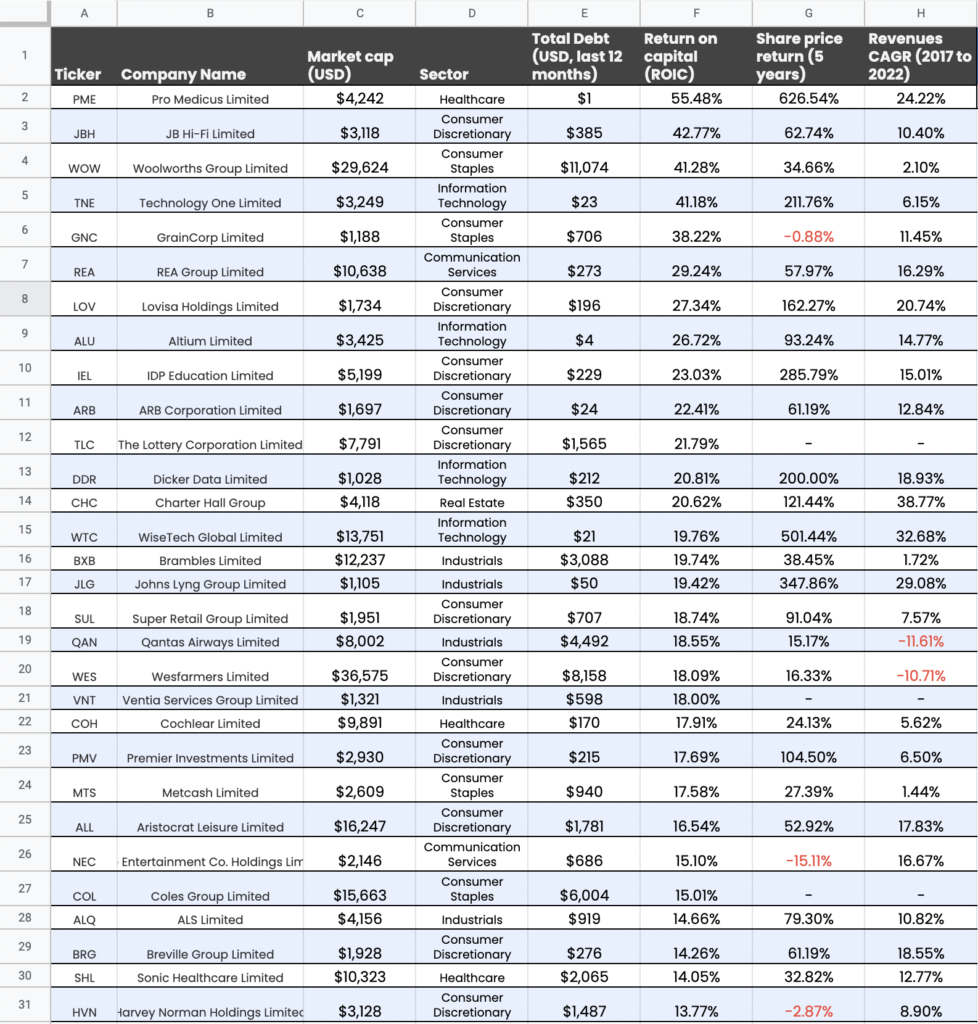
From Rask Media – ASX’s best companies published August 2023 – ranked in order of ROIC- Click on image to enlarge

This is a great place to start fishing, metrics for profitability and growth in one place. Pro Medicus is standing out here – High profitability (ROIC 55.48%) and high historical growth (5-yr CAGR 24.22%). A complete picture needs both of these metrics. For example, Woolworths has a high profitability (ROIC 41.28%) but is laggard in historical growth (5-yr CAGR 2.10%).

The next article in this series will look at how Slack Investor narrows these stocks down and then screens them further with the P/E Ratio to try to make sure that each potential buying stock is not overpriced.

Altium (ALU)- Thanks, so sad to see you go … and March 2024 – End of Month Update

Renesas CEO Hidetoshi Shibata (left) and Altium CEO Aram Mirkazemi (right) firming up the takeover deal – From Business News Australia.

It is with very mixed feelings that Slack investor reports on the likely takeover of Altium (ALU) – one of his major holdings (16.6% of total Portfolio) – by the Japanese Renesas Electronics Corporation.

Renesas will acquire all outstanding shares of Altium for a cash price of A$68.50 per share, representing a total equity value of approximately A$9.1 billion

Altium Press Release – February 15, 2024

Although this represents a tidy profit, as I first bought into Altium about 10 years ago when they were trading at $3.30, I will be genuinely sad to stop being a shareholder of this wonderful company. I envisaged holding Altium shares for a very, very, long time!

Slack Investor’s 10-yr journey as an Altium shareholder – Monthly price chart from incrediblecharts.com – click chart for better resolution

Why I originally bought into Altium?

Let’s get this straight, Slack Investor is no stock picking genius. My portion of profitable sold shares is only about 55%. That is, I have made losses on 45% of them – it is not that impressive! – but my overall performance results are good.  This is because I follow the Peter Lynch philosophy – where you try to stay in the stocks that are performing well and “weed out” the stocks that are not doing well.

“Some stocks go up 20-30 percent – and they get rid of it and hold onto the dogs. And it’s sort of like watering the weeds and cutting out the flowers. You want to let the winners run.”

Peter Lynch – Legendary Investor and Fund Manager. From 1977 until 1990, he ran the Magellan fund where he averaged a 29.2% annual return for those years.

Slack Investor is always on the lookout for growth companies … and Altium poked up its head and looked at me in 2014 from one of the financial sites that I read. The next step is a bit of independent research. My “go to” here is the most excellent Market Screener site. I went through my usual process for buying and checked the Market Screener/Financials tab for a reasonable projected Price/Earnings ratio, an established record of improvement in earnings, and a forecast Return on Equity (ROE) above 15%. Altium stood out here with no debt and a ROE of between 35 and 50. This company was growing!

After my initial purchase, I bought more parcels of ALU over the next two years as the shares continued to grow and their outlook projections were confirmed.

The Altium Story

Altium is an Australian-based software company that provides electronics design software to circuit-board engineers. These circuit boards are in every bit of technology that we own.

By the time Slack Investor had woken up to the Altium story, Aram Mirkazemi was the established CEO of Altium Limited. He came to Australia from Iran as a refugee in the 1980’s after a 6-month stint in a refugee camp in Pakistan. He did not speak English. After gaining qualifications in IT and engineering, he met Nick Martin, the founder of Altium, at a soccer game and Nick offered him a job. After an eventual falling out, Aram left to start his own software company. When Nick steeped down as CEO, Aram returned to Altium with a vision to make Altium a world player in printed circuit board design.

… in order to be able to change the way the electronics industry works you need to be able to standardise on one platform, like the graphics industry did with Photoshop or Microsoft’s dominance of the operating system and productivity tools market.

After several years of growth and gaining market share. The Altium board rejected an offer of $38.50 per share from Autodesk Inc back in June 2021 as they thought that the offer ‘significantly undervalues’ the companies prospects. The 2024 Renesas offer is yet to be approved by shareholders, but it seems that all the significant players are already “on board”. The offer A$68.50 per share in cash. represents a premium of approximately 34% to the pre-offer price.

All I can say is, it has been an honour to be part-owner (shareholder) of this great company – Thank you Aram and his team. I will be selling part of my holding this tax year (to spread the capital gain over two tax years) and wait for the cash offer to come through in 2025 for the remainder.

March 2024 – End of Month Update

More Happy Days in the stock market. As the troubled world marches on, all Slack Investor followed markets rose this month. The ASX 200 up 2.6%, the FTSE 100 up 4.2%, and the S&P 500 up 3.1%,

Slack Investor remains IN for the FTSE 100, the ASX 200, and the US Index S&P 500.

All Index pages and charts  have been updated to reflect the monthly changes – (ASX IndexUK IndexUS Index). The quarterly updates to the Slack Portfolio have also been completed.

2023 – Hope You Were Strapped In …  and January 2024 – End of Month Update

From Boredpanda.com

Slack Investor usually just assesses stock market returns at the end of the financial year. However, calendar year 2023 was some ride.

The 2023 ASX 200 Chart

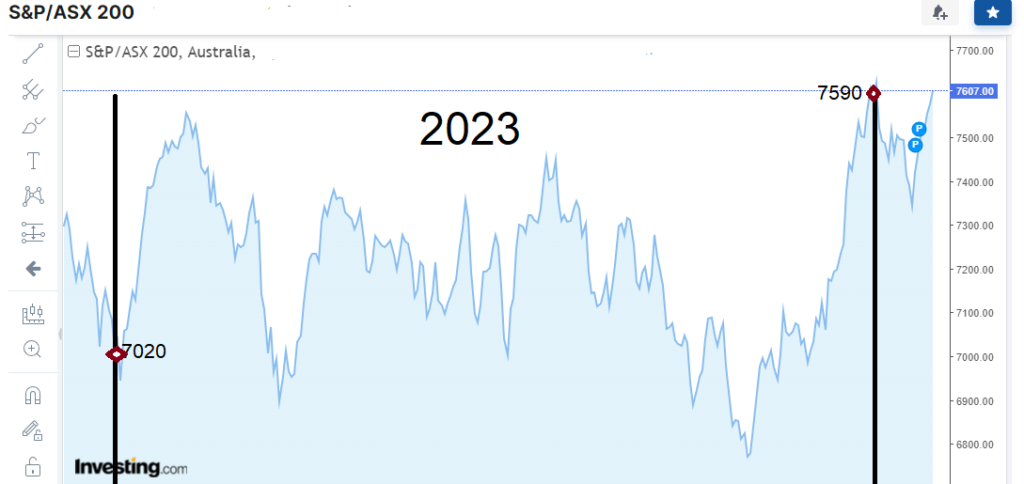
For the 2023 calendar year, the ASX 200 Index started at 7020, and ended up at 7590 – a 12-mth increase of about 8% – but, on the way, it fell to a year low of 6751 – a temporary fall of 3.8%.

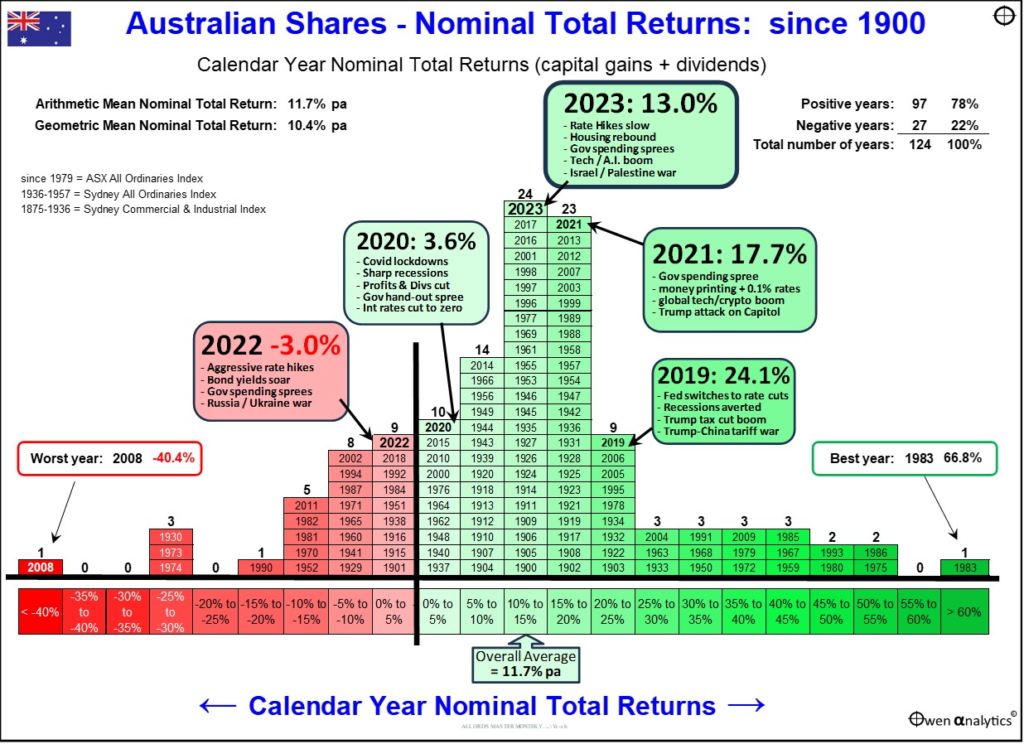
Of course, If you did not look at the charts daily, these fluctuations would mean nothing. If you ony looked at the Australian Index at yearly intervals, 2023 would probably bring some joy. As well as the overall 8% gain for the year, when you include dividends, the ASX 200 Index total return for calendar year 2023 was 12.2%. The ASX “All Ordinaries” Index (Tracking Australia’s largest 500 listed companies) had a total return of 13.0%.

Slack Investor will again emphasize the joy of investing and mostly doing nothing – and trying to focus on longer term returns. One of the best summary charts I have seen for a while that shows calendar year returns has just been updated and published by Ashley Owen. Ashley uses the “All Ordinaries” Index rather than the ASX 200 Index- as there is more historical data available for comparison.

Total ASX “All Ordinaries” calendar year returns – with the the last 5 years highlighted – From Ashley Owen – Owen Analytics – (Click to Enlarge)

The first thing that jumps out in this chart is the amount of “Green” positive years vs the “Red” negative years. In 78% of calendar years, ASX Index returns are positive. The overall average total return since 1900 for the Australian “All Ordinaries” Index is 11.7%.

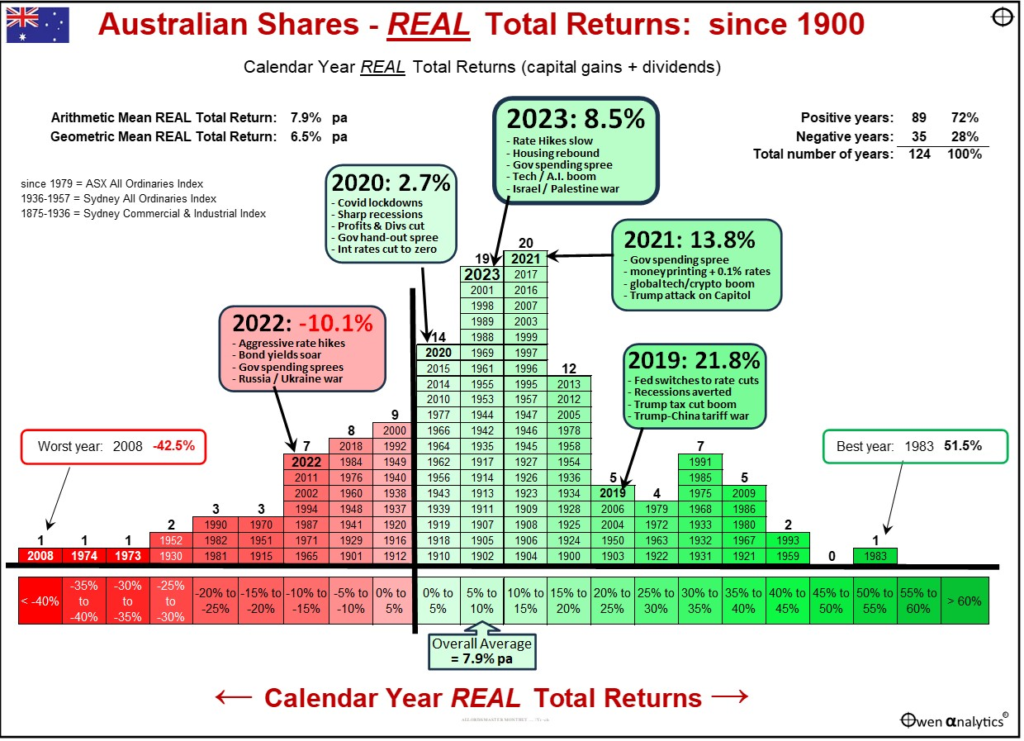
Inflation has been the topic of the day lately and Owen has kindly provided his calendar year chart in terms of Real Returns for the All Ordinaries Index – The total return minus the inflation rate (Consumer Price Index (CPI)). A certain amount of cash is worth holding to for liquidity – so that you can avoid selling stocks in a market downturn. Although cash can iron out some of the stock market fluctuations, being invested in cash is not a protection from inflation.

Total ASX “All Ordinaries” calendar year “Real” (minus inflation) returns – with the the last 5 years highlighted – From Ashley Owen – Owen Analytics – (Click to Enlarge)

Adjusted for cpi increases, the overall average “Real” total return since 1900 for the Australian “All Ordinaries” Index is 7.9%. Slack Investor is willing to put up with the volatility of share markets for an average “after inflation” return like this.

For financial independence and as a hedge against inflation, it is important to own growth assets – such as the Australian Share market. Sure, there will be the occasional negative annual returns ahead … but let’s not worry about this while the Australian stock market is rising. Long-term overall results are the important thing.

January 2024 – End of Month Update

Slack Investor is IN for Australian index shares, the US Index S&P 500 and the FTSE 100.

After a big Christmas Rally, things have settled down a bit with modest gains for the ASX 200 (+1.2%) and the S&P 500(+1.6%). The FTSE 100 had a small fall ( -1.3%)

It was time to adjust the stop loss for the S&P 500 as the current value is over 15% greater than the stop loss. Slack Investor has long believed the US market is overvalued and, while enjoying the journey, is happy to have his stop loss a little tighter. It is difficult to do the adjustment on the monthly chart, so I had a look at the weekly chart for the S&P 500 below. I am looking for a dip in the chart that represents a “Higher low”. The new stop loss now stands at 4682 – only 3% below the current value.

Extract from the S&P 500 weekly chart – From Incrediblecharts.com

All Index pages and charts have been updated to reflect the monthly changes – (ASX IndexUK IndexUS Index).

Get your old Photo Albums converted to improved digital images with GIMP … for free

Slack Investor at age 18 near Albany W.A. – Before and After the GIMP treatment

Slack Investor likes to have a rounded life that is full of things that are not finance related. Occasionally, I will write a blog about something that I think is useful that I think that other people can also benefit from.

1975

49 years ago … Cripes! I had just finished High School and a mate and I went of on a Summer car surfing adventure from Melbourne to Western Australia before Uni started. As it turns out, 1975 would have been a good year to start investing … but life is much more rich and exciting than just investing.

Dusting of my old Photo Albums revealed that my memories had deteriorated to the standard below. It must have been the state of the art of photo emulsions in the 70’s.

The first thing to do is to scan the album page with your colour scanner/printer. I wanted to capture as much as I could of the original photos and played around with resolutions on my A4 scanner – as I eventually wanted to throw out the original albums. The scanning resolution that worked best for me was at about 400 dpi. In my case, increasing the resolution did not help the clarity of my original images. The above scan worked out to be about 4 Mb. I labelled the scan “Year Taken”_”Album Name”_”Page #”

I then cropped each individual image by pasting the scanned image into Microsoft Paint – but any photo edit software will do this. I labelled the image “Year Taken”_”Album Name”_”Page #”_”Photo #”

Get the GIMP

Not to be confused with the gimp from Pulp Fiction . Warning: this link is not not for the feint-hearted – Quentin Tarantino can go in a few sick directions!

However, this GIMP is software that is a fantastic cross-platform image editor available for Linux, macOS and Windows. It is free software that can be downloaded here … I used version 2.10.36 … and it can perform miracles!

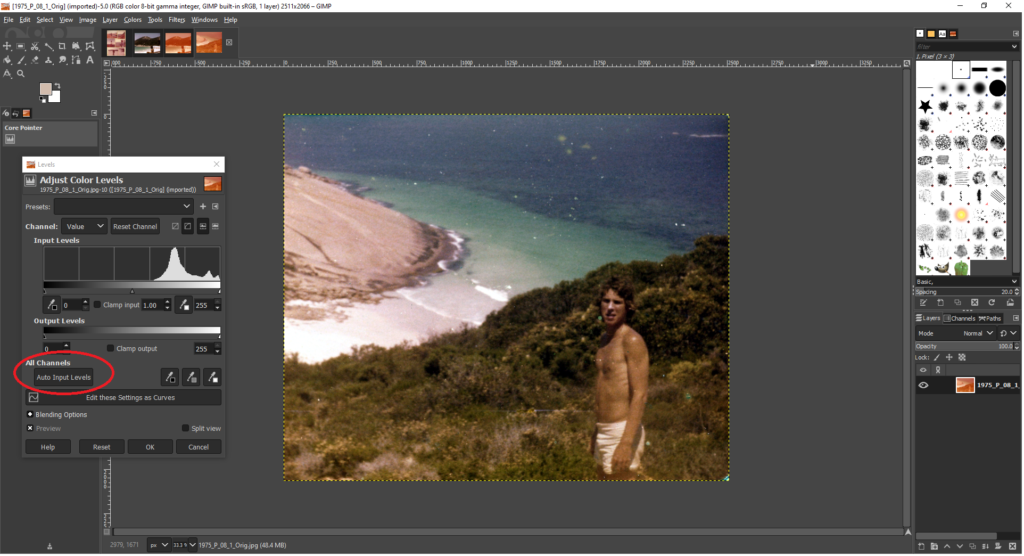
Open up GIMP and find your individual image, cropped from your photo album, to be transformed . Select File/Open – Then open up the Color/Levels Dialogue box

The magic happens here when you press the “All Channels/Auto Input Levels” Button inside the pop-up Levels Dialogue Box (Below).

A miracle has been performed with one click of a button – and you can save the new image in .jpg format by clicking File/Export as …

There are simple ways to clean up the image of any blemishes … but we have done enough for today. Will have another go at another non-finance instructional post later this year.