Financial Year 2023 Slack Results

“I believe in evidence. I believe in observation, measurement, and reasoning, confirmed by independent observers. I’ll believe anything, no matter how wild and ridiculous, if there is evidence for it.

Isaac Asimov – US Author and Biochemist

Good fortune has prevailed in FY 2023. After the tough investing year of FY2022, Slack Investor has stuck to his strategy of investing with growing companies that have an established earnings record and forward P/E ratios <50 (Mostly!). As always, there have been a few lapses, but that’s just part of being an investor.

I expect a bit of volatility in my (mostly “growth”) investment portfolio and I try to reassure myself that, despite the odd negative year in the Slack Investment Portfolio the Stable Income portfolio is doing its job and keeping Slack Investor with enough cash to keep things running. In the world markets, the FTSE 100 Total Return Index was up 7.8% (last FY up 5.7%). Dividends helped the Australian Accumulation Index to be up 10.6% for the financial year (last FY -7.5%). The S&P 500 Total Return Index is again full of optimism – and was up 19.7% (last FY -10.7%) for the same period. All of these Total Return Indicies include any accumulated dividends.

Slack Portfolio Results FY 2023

All Performance results are before tax. The Slack Portfolio is Slack Investor’s investment portfolio and, after the first negative year since starting this portfolio in 2010, I am delighted to be “Back in the Black” – with an annual FY 2023 performance of +17.9%. Full yearly results with benchmarks are shown in the table below.

FY2022 was another bumper year in real estate – particularly Brisbane -but there has been a welcome pause in housing prices for FY2023. For property, the actual falls in asset values is greater than that shown as Slack Investor is using the Total Return values supplied by CoreLogic. The Total Return is calculated from value change as well as the gross rental yield. I would have preferred calculations that include the net rental yield, but this will have to do. The Total Return is a more realistic figure when comparing real estate returns to stock market total returns, as it treats both asset classes as investments.

The share market was the place to be for FY 2023, with the Australian Share market Total Return Index (ASX200 Acc) up 10.6% and the Vanguard Diversified Growth ETF (VDGR), comprising mostly (68%) of International and Australian Shares, increasing by 11.2%. Inflation is again coming in big – with the CPI at +6.0% – reinforcing the need to have exposure to “growth assets” such as shares or property.

Yearly Performance (%) results since 2010

YEAR SLACK FUND MEDIAN BAL VGARD GROWTH ASX200Acc RES BRIS RES MELB CASH CPI
2010 6.6 9.8 12.3 13.1 10.8 26.9 4.2 3.1
2011 2.5 8.7 9.1 11.7 -2.4 0.9 4.4 3.7
2012 8.3 0.4 1.3 -6.7 1.3 -0.9 4.3 1.2
2013 26.5 14.7 18.6 22.8 7.7 8.3 3.2 2.4
2014 23.6 12.7 14.5 17.4 11.5 12.8 2.6 3.0
2015 2.4 9.6 11.8 5.7 7.7 15.6 2.5 1.5
2016 14.2 3.1 4.2 0.6 8.4 9.5 2.2 1.3
2017 19.5 8.1 8.8 14.1 6.5 17.7 1.9 1.9
2018 37.6 7.2 10.0 13.0 5.2 3.9 3.9 2.1
2019 19.7 6.2 9.8 11.5 1.7 -6.0 2.0 1.3
2020 9.4 0.3 0.6 -7.7 8.4 13.8 1.1 -0.3
2021 21.7 13.0 20.3 27.8 17.9 10.7 0.2 3.8
2022 -14.3 -2.5 -13.0 -6.5 25.6 3.1 0.3 6.1
2023 17.9 6.9 11.2 10.6 -4.1 -2.6 2.6 6.0

The Slack Fund yearly progress vs BENCHMARKS. The Median Balanced Fund (41-60% Growth Assets)Vanguard Growth FundASX 200 Accumulation IndexCorelogic Residential Property Home Value (Total Return) Index in both Brisbane and Melbourne, and Cash (Australian Super Cash Fund) and Consumer Price Index (CPI)

Although I collect yearly figures, the 5 and 10-year compound annual performance gives me a much better idea about how things are going and will smooth out any dud (or remarkable!) results. The Slack Fund is still ahead of Benchmarks – but currently being challenged by Brisbane Residential real estate over a five-year period.

5-yr Average Annual Performance
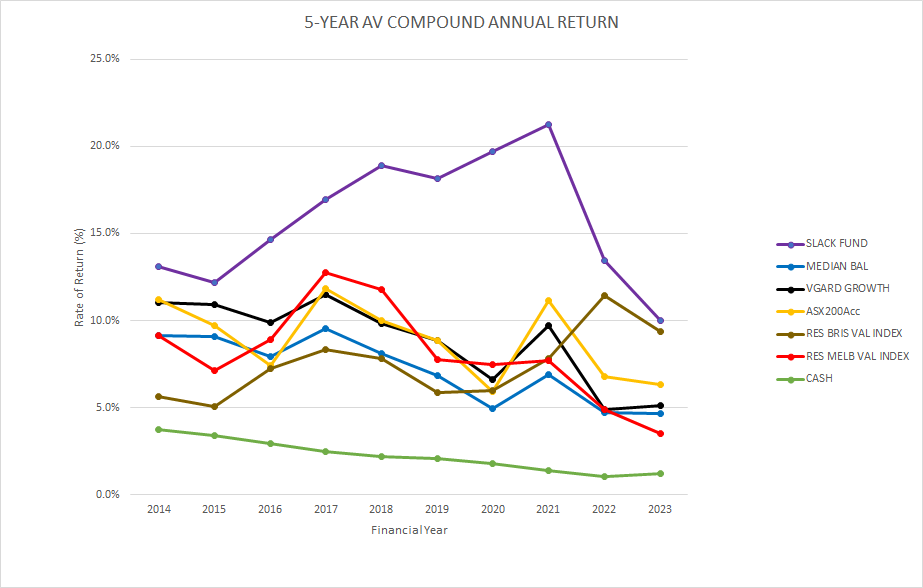
Slack Investor 5-year compound annual rate of return – compared to benchmarks – Click for better resolution.

The beauty of compounding with a succession of good performance results can be seen in the chart below showing the growth of an initial investment in June 2009 of $10000.

Growth of a $10000 Investment Since 2009
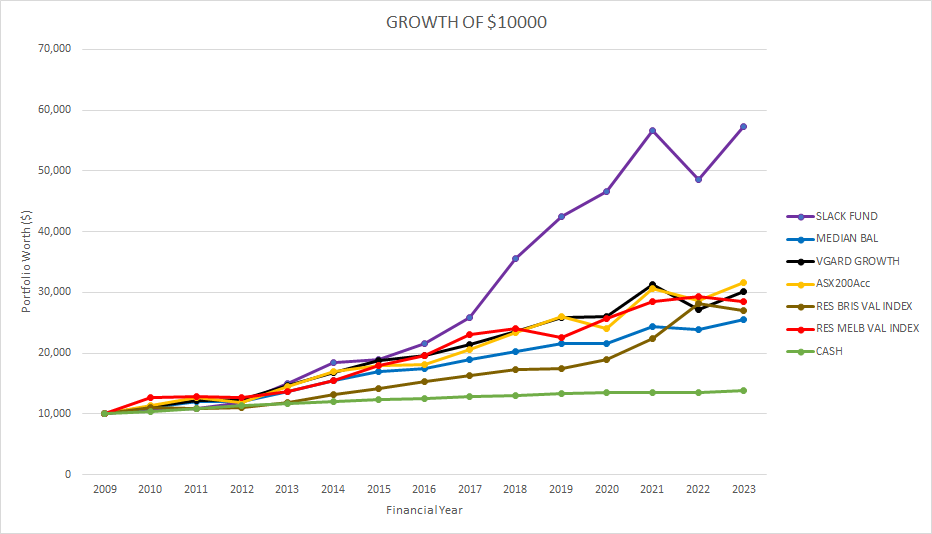
The rate of growth of $10000 invested by Slack Investor in FY 2009 – compared to benchmarks – Click for better resolution.

10-year compound annual rate of return

The Slack Fund has been around a while and, at last, I am generating some long term data (10-year compound “rolling” annual rate of return). Over this time frame, the Slack Fund has been performing very well. A 10-year annual rate of return of over 14% – Go Slack Fund!

However, the 10-yr rates of return of the Median Balanced Fund, Vanguard Growth fund, ASX200, and residential property in Brisbane and Melbourne are also great long term investments, generating a 10-year compound annual rate of return of 6-9% p.a. From the figures below, although it can add stability to a portfolio, Cash as a long term investment, is a poor choice.

Average 10-yr compound yearly return

YEARSLACK FUNDMEDIAN BALVGARD GROWTHASX200AccRES BRISRES MELBCASH
2019 15.6 8.0  10.0 5.8 8.5 2.9
2020 15.9 7.0  7.8 5.5 7.3 2.6
2021 17.9 7.4  9.3 7.5 8.3 2.2
2022 15.2 7.1 8.1 9.3 9.9 8.7 1.8
202314.4 6.4 7.4 8.2 8.6 7.6 1.7

The Slack Fund average 10-yr compound yearly return vs BENCHMARKS. The Median Balanced Fund (41-60% Growth Assets)Vanguard Growth FundASX 200 Accumulation IndexCorelogic Residential Property Home Value (Total Return) Index in both Brisbane and Melbourne, and Cash (Australian Super Cash Fund) and Consumer Price Index (CPI)

FY2023 Nuggets and Stinkers and … July 2023 – End of Month Update

 Life is not a bowl full of cherries, there’s good and bad stuff 

Fuzzy Zoeller (American professional golfer)

Fuzzy Zoeller does not always say wise things, but his quote above is on the money. Slack Investor takes the good with the bad.

The trampoline effect of stinkers becoming nuggets in consecutive years reared again, with REA making the transition this year. Also, Nuggetsmight end on the Stinker pile the year after. Slack Investor puts more emphasis on growth over a multi-year period, but compiles the yearly Nuggets and Stinkers list …. because its fun!

Growth stocks (usually high Return on Equity (ROE >15%), as with other stocks, often have cycles of price – bouts of overvaluation followed by a period of undervaluation.

The percentage yearly returns quoted in this post include costs (brokerage) but, the returns are before tax. This raw figure can then be compared with other investment returns. I use the incredibly useful Market Screener to analyze the financial data from each company and extract the predicted 2o25 Price/Earnings (PE) Ratio, Dividend Yield, and Return on Equity (ROE), on the companies below. This excellent site allows free access (up to a daily limit) to their analyst’s data, on the financials tab for each stock, once you register with an email address.

Slack Investor Stinkers – FY 2023

Financial year 2023 was a welcome recovery in the technology sectors. All of Slack Investors followed markets Australia, the UK and the US having gains over the financial year 2023. However, Slack Investor is always ready for lessons in humility and still managed to pick up a few stinkers along the way.

Integral Diagnostics (IDX) -19% (Sold Oct 2022)

Integral Diagnostics | Medical Imaging Services | Australia | New Zealand

(IDX 2025: PE 18, Yield 3.8%, ROE 10%) Integral Diagnostics provides medical imaging services at a number of urban and regional locations in Australia and New Zealand. This company was also one of my stinkers last year (FY2022 -39%) The sinking feeling that I got during my monthly chart reviews was just too much … and I finally gave into that negative energy in October 2022 – and sold. This, unfortunately, turned out to be the bottom of the market – and IDX has made a modest recovery since.

Computershare (CPU) -18% (Sold May 2023)

(CPU– 2025: PE 16, Yield 3.8%, ROE 29%) Computershare is well known to owners of some Australian shares as they run the registry for many Australian companies. It started as an Australian technology business in 1978 and since has become a major global player in financial services. Slack Investor just bought at a bad time … and I sold in May 2023 to make another share purchase. CPU seems to be a solid global business though – Will look at buying this one again.

Dicker Data (DDR) -18% (Still held)

(DDR 2025: PE 14, Yield 6.8%, ROE 42%) Dicker Data is the only Australian owned and ASX-listed major IT provider. It is a hardware, software and cloud distributor for most of the well known US IT companies (Microsoft, Cisco, HP, etc). The business is projected to continue to grow and, as the share price seems to have “bottomed out”, Slack Investor will continue to hold on because of the companies excellent projected PE, Yield, and ROE.

BetaShares Asia Technology Tigers ETF -7% (Sold Sep 2022)

(ASIA – 2023: PE 17, Yield 2.6%,) Growth in Asia … What could go wrong! Plenty it seems. These “technology tigers” that make up this ETF have been part of a global selloff of tech-related shares in Asia since 2021 as many US investors take flight from the China market due to US/China tensions. 

This company was also one of my stinkers last year (FY2022 -33%) and was “on watch” during my monthly chart reviews. Sadly, the pain became too much and I unloaded near the bottom of the market again … and, it has since made a modest recovery. I have maintained at least some exposure to the Asian tech sector with with Vanguard FTSE Asia ex Japan ETF (VGE.ASX).

Slack Investor Nuggets – FY 2023

Nuggets made a comeback this Financial Year. Slack Investor continues to invest in high Return on Equity (ROE) companies with a track record of increasing earnings, Companies with these qualities sometimes behave as “golden nuggets”.

Technology One (TNE) +48%

(TNE 2025: PE 37, Yield 1.5%, ROE 34%) This Software as a Service (SaaS) and consulting company continues to be profitable. This great business was also a nugget last year (+17%). A high 2025 PE of 37 (Expensive) is a little scary but, if the high Returns on Equity (34%) remain, on balance, this is OK. I found this company through the writings of Rudi Filapek-Vandyck – a great Australian Investor and writer, when he talks, Slack Investor listens.

Altium (ALU) +40%

(ALU 2025: PE 34, Yield 2.3%, ROE 32%) Altium is an Australian based developer and seller of computer software for the design of electronic products worldwide. It focuses on electronics design systems for 3D printed circuit board (PCB) design. Slack Investor has part-owned this business since 2009 and has enjoyed the increasing value that ALU has created. This sector is very now … and remains a favourite of Slack Investor.

CarSales.com (CAR) +37%

(CAR 2025: PE 28, Yield 3.0%, ROE 10%) CarSales.com is the go to for selling cars, boats and other vehicles. It does, in an efficient way, what the classified ads used to do. I have noticed that the Return on Equity is dropping (Now 10%) and will keep this company on watch – but I cant argue with the recent price rises.

BetaShare NASDAQ 100 ETF (NDQ) +36%

(NDQ 2023: PE 26, Yield 1.0%) Exposure to the powerhouse of US Tech companies with the simplicity of an ASX ETF. Management fees are reasonable at 0.48% – Slack Investor remains a fan.

Pro Medicus (PME) +36%

(PME 2025: PE 78, Yield 0.6%, ROE 46%) Pro Medicus is a developer and supplier of healthcare imaging software and services to hospitals and diagnostic imaging groups. Slack Investor actually met the CEO and co-founder of Pro Medicus, Dr Sam Hupert, at an investment seminar last year. His modesty, US foothold, and debt-free approach to expanding his business impressed me – I’m obviously glad I bought in – but the very high PE ratio (+78) is worrying – expensive.

REA Group (REA) +30%

(REA 2025: PE 39, Yield 1.5%, ROE 29%) Like Carsales.com, REA has dominated the space left by the old newspaper classifieds in selling real estate in Australia. REA has expanded into India and other global locations. A high PE ratio (39) but while projected Return on Equity (ROE) remains high (29%), this is OK.

VanEck Wide Moat ETF (MOAT) +30%

(MOAT – 2023: PE 19, Yield 2.6%,) The Wide Moat ETF run by VanEck is a rules-based selection of “attractively priced US companies with sustainable competitive advantages” Sounds good doesn’t it. The management expense ratio of 0.49% is OK for such curated US exposure. 

Slack Investor Total SMSF performance – FY 2023 and July 2023 end of Month Update

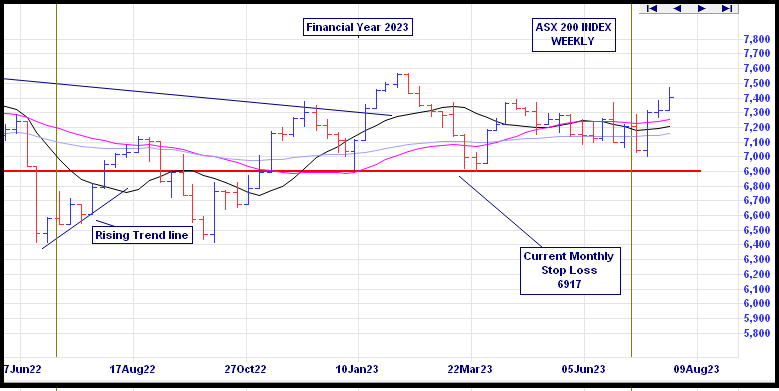
After a difficult 2022, FY 2023 is described by J. P. Morgan as being “kinder to balanced portfolios”. True That! The growth stocks that were punished last year bounced back strongly. In the Australian superannuation scene, the median growth fund (61 to 80% in growth assets) returned +9.2% for FY 2023. The ASX 200 chart shows a gradual climb for the financial year.

ASX 200 Weekly chart for FY 2023 – From Incredible Charts

After a tough FY 2022, the FY 2023 Slack Investor preliminary total SMSF performance looks like returning to form and coming in at around +18%. The 5-yr performance is a more useful benchmark to me – as it takes out the bouncing around of yearly returns. At the end of FY 2023, the Slack Portfolio has a compounding 5-yr annual return of around 10%.

The new financial year started of positively for Slack Investor markets. The ASX 200 + 2.9%; FTSE 100 +2.2%; and S&P 500 +3.1%. He remains IN for all index positions.

All Index pages (ASX IndexUK IndexUS Index) and charts  have been updated to reflect the monthly changes.