Slack Investor is delighted to report that the ‘Wedgie’ has returned. The ‘Wedgie’ is a chart pattern that is less entertainingly called the ‘breaking a long-term downtrendline’. Looking for chart patterns can be confusing and belongs to the ‘dark art’ world of technical analysis. However, Slack Investor has some faith in the ‘Wedgie’. The chart pattern was first discussed by Slack Investor back in 2019 and he has done a small-scale analysis on whether it works 1-yr on. His conclusion, yes, mostly!
The top of the wedge downtrend line should be drawn for a period of at least 3 months (preferably 6 months) and connect at least 2 (and preferably 3) descending high points.– Slack Investor
Telix Pharma (TLX.AX) weekly chart showing the ‘Wedgie’ in blue and the price bars breaking out of the ‘Wedgie’ – incrediblecharts.com
There is a reason why I think it works. Firstly, there is a long-term decline in price, usually because of some bad news in reporting season. Then there comes a point when the market starts thinking that things have gone too far … the stock is relatively cheap … and people start buying the stock again. Slack Investor likes owning stocks that other people want. The price has a real reason to increase.
It brings some pain to Slack Investor to revisit the chart above as Telix Pharmaceuticals (TLX.AX) has been one of his biggest losers this financial year. He should have got out much sooner! But, to Slack Investor’s credit, he will try to judge this case without hard feelings – as the breakout from the downtrend looks to be quite strong.
Naturally, having been burnt once on TLX, he revisits the important numbers from Market Screener Finance. There are a number of traits that Slack Investor looks for before investing in a company. A good summary can be found here with the definitions of the Slack Factor and Slack Ratio. As a rule of thumb, Slack Investor likes the Slack Ratio to be greater than 0.7 and the Slack Factor to be greater than 10. For TLX, the Slack Ratio is below this – but I have bought a parcel of shares anyway on account of the strong projected annual growth (greater than 100% p.a.). Note: for all his Slack Factor calculations he limits the projected growth to 30% p.a. to try to avoid the far too heroic forecasts.
Due to past disapointments, he will be keeping a close eye on TLX but the recent regulatory hurdles for their products seem to have been mostly cleared. Slack Investor is heartened by the recently announced collaboration deal with Regeneron Pharmaceuticals Inc (NASDAQ: REGN).
The ‘Wedgie’ below for NDQ says it was time for Slack Investor to also enter the NASDAQ 100 again via the Betashares Nasdaq 100 ETF (NDQ.AX). I like being involved with the 100 largest tech companies in the US. This index really aligns with innovation and growth. There are similar ‘Wedgie’ outbreaks on some of Slack Investor favourite companies – PME and TNE.
Betashares Nasdaq 100 ETF (NDQ.AX) weekly chart showing the ‘Wedgie’ in blue and the price bars breaking out of the ‘Wedgie’ – incrediblecharts.com
Sitting
Similar patterns are beginning to show on my weekly review of the charts of stocks in the Slack Portfolio. Slack Investor also looks at stocks that he would like in the portfolio that may have got caught in a downtrend – and have recently shown signs of positive momentum. Of course, with the ‘Orange Buffoon’ still in a powerful position – anything could happen! But this won’t stop me from investing in good companies.
CAR Group (CAR.AX) weekly chart showing the ‘Wedgie’ in blue and the price bars hopefully breaking out of the ‘Wedgie’ soon. – incrediblecharts.com
Slack Investor is patiently sitting with a bit of cash and hopes to take advantage of any further ‘Wedgie’ opportunities that present themselves. In addition to CAR, the ‘Wedgie’ is in its pre-breakout form for companies with prospects such as WTC, GMG, REA, SNL and XRO.
Warren Buffet and his offsider the late Charlie Munger are dead set Slack Investor Heroes – and a reminder that the USA offers a crucible for outstanding qualities to emerge in individuals – as well as, in some presidential types, some not so good qualities. Mr Buffet is a great investor and philanthropist and full of insightful but humble advice that is worth heeding. Every November he writes a letter to his Berkshire Hathaway shareholders and it is a delight to read in full. This will be his last shareholder letter as he is retiring at the grand age of 95.
‘Our stock price will move capriciously, occasionally falling 50% or so as has happened three times in 60 years under present management. Don’t despair; America will come back and so will Berkshire shares.’ – Berkshire Hathaway 2025 Newsletter
Even investors as great as Warren Buffet are not immune to large market swings. After all, it is your long-term performance that is the most critical for a lifetime investor.
‘Since 1965, shares of Warren Buffett’s conglomerate, Berkshire Hathaway (BRK.B), have delivered a compounded annual return of 19.9% — almost double that of the S&P 500 over the same period.’ – Investopedia using data from the Berkshire Hathaway 2024 Newsletter
Warren Buffet liked to look at current market valuation (S&P 500) as a ratio with the current US Gross Domestic Product (GDP). At 30 June 2025 the ratio was 217%. A long way above the trend line and a warning that the S&P 500 was growing at a rate much faster than the general economy – this is a danger sign.
The Buffet Indicator is the ratio of the total United States stock market to GDP. The ratio is now two standard deviations away from the historical trend line – from Current Market Valuation
Market Value – November 2025 Update
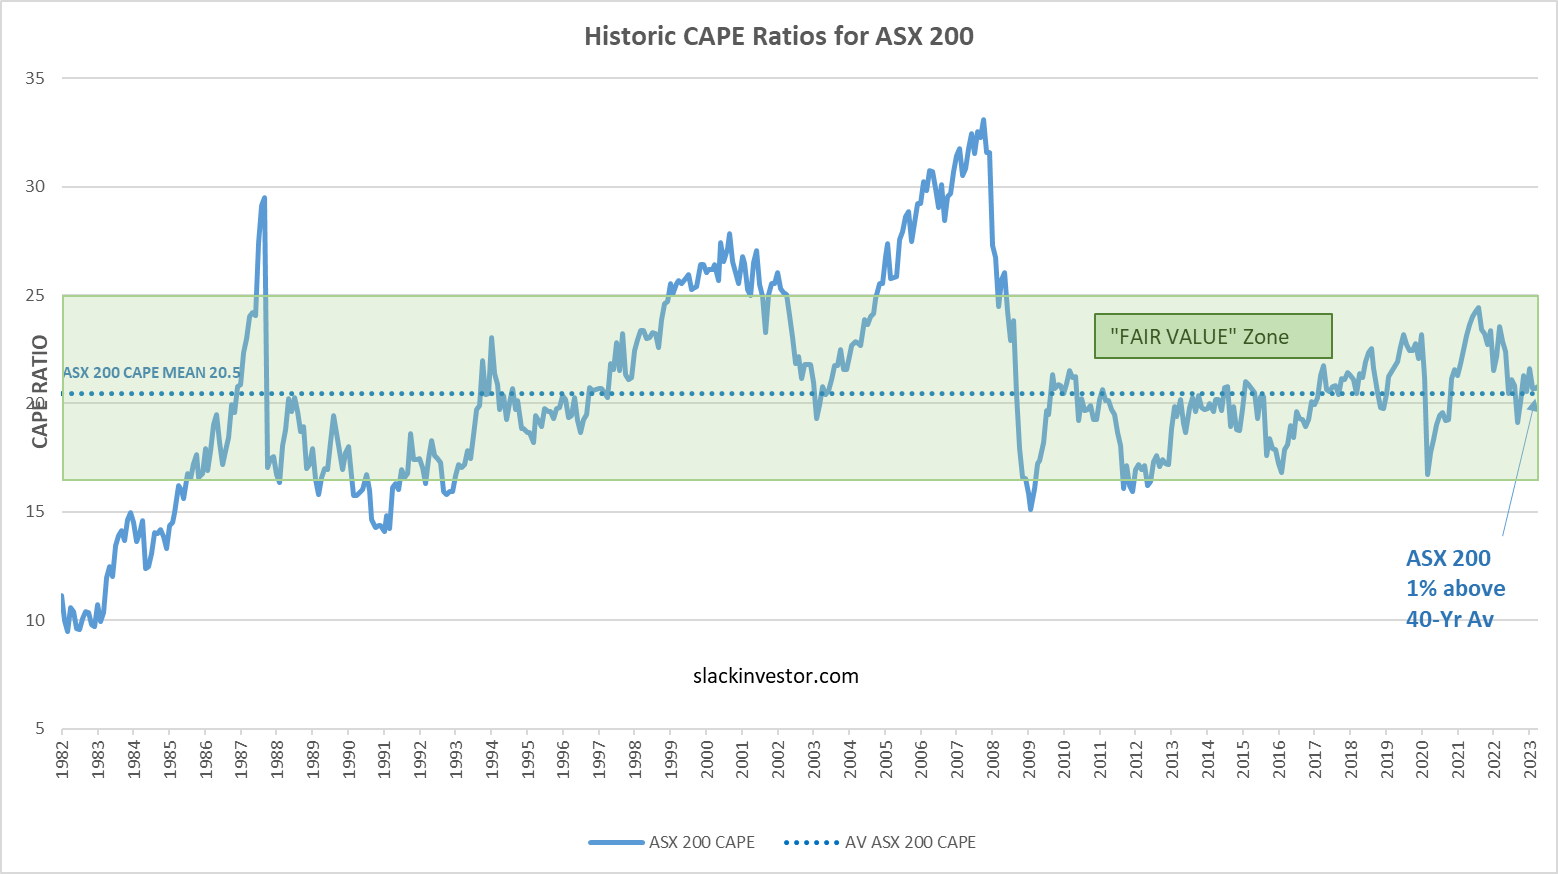
Slack Investor also likes to keep up to date with how the markets are travelling for value and he has been using charts for the Cyclically Adjusted Price to Earnings ratios (CAPE). This value is also known as the Shiller P/E Ratio after Robert Shiller the economics professor that made this measure popular. Slack Investor first started using CAPE as a ‘value’ tool in September 2021. The most recent post on Market Value was mid-April 2025 about 6 months ago.
For the following charts, Slack Investor uses monthly CAPE data from Barclays, the 40-yr mean is calculated and plotted together with the latest actual CAPE values up until 31 October 2025. A ‘fair value’ zone is created in green where the CAPE is within one standard deviation of the mean (average) – click images for better resolution.
ASX 200 CAPE Value 22.89 (11% above long-term av.)
ASX CAPE values – up to 31 October 2025
FTSE 100 CAPE Value 18.24 (5% above long-term av.)
UK CAPE values – up to 31 October 2025
S&P 500 CAPE Value 39.76 (59% above long-term av.)
US CAPE values – up to 31 October 2025
The UK and Australian markets are not too overvalued. However, in terms of the Shiller P/E the S&P 500 has entered some lofty territory. Unfortunately, whenever the S&P 500 has a large correction the effects are usually felt in other markets.
There is some good research that links CAPE to long-term returns … and future returns are what gets Slack Investor excited. The predictive skill of the Schiller CAPE is not very good over 1-yr and 5-yr periods. However, it does show some skill for periods of 10 years and longer. The tight spread around the trend line indicates that the Shiller P/E might have some predictive skill.
Shiller P/E and S&P 500 10-year annualised forward returns since 1983. The data shows 41 years of S&P 500 10-year average annual returns based upon the Shiller PE ratio (from 10 years ago). Slack Investor has modified the chart and circled the 10-year average returns based upon the times when the Shiller P/E was previously around 40 – From Invesco.com
If this relationship holds, the average S&P 500 10-year annualised forward returns are predicted to be close to zero or negative. This indicates that now is not a good time to start buying the S&P 500. Tech stocks (with high P/E) have fallen sharply lately and this could be early signs of a readjustment.
Slack Investor is not one with predictive skills. He just plods along – staying mostly invested and knowing that he has his stable income pile to ride out any market gyrations. Cripes … even the great Warren Buffet’s Berkshire Hathaway stock had 11 negative years between 1965 to 2024. Slack Investor could only dream of emulating the Buff’s long term compounded annual return of 19.9% over 55 years.
Slack Investor has just finished the inputs for his family tax returns and our SMSF tax return. All Good – and he was pleased that it was a painless procedure. After many years of investing, he has got himself organized.
A lot of the tax-time pain has been erased because of his disciplined rituals. As soon as he gets a communication about his shares (usually email) it is downloaded to one of Slack Investor’s Finance folders on his PC. The Finance folder has two sub-folders one for Transactions (Buy/Sell contract notes from Brokers) and, another for communications from Share Registries labelled DIVIDENDS_TaxStatements. He then saves items in these folders with specific notation Account_StockSymbol_Type of document_Date of issue (YYYY-MM-DD). For Tax Statements, Slack Investor will allocate the date for the end of tax year that the statement covered. After completing tax returns, Slack Investor will archive the files to the folder for the previous tax year – and start again for the current year.
To automate share price updates it is necessary to use a service like MSMoneyQuotes. The latter is not freeware but the $US10 lifetime licence is money well spent. MS Money is now a 20-yr old bit of software and is a bit clunky but there is a good installation guide at TechFinitive that will help you through – including some registry changes to work with windows 10/11. Slack Investor loves MS Money, and the many support sites, e.g. View from the Potting Shed which has a free support pdf available, Ameridan’s Blog and moneymvps.org. He has been using versions of MS Money for 30 years!
For those who don’t want to wander through the complications of the Microsoft Money path, it is really important to track your portfolio for capital gains and performance, and at least some sort of portfolio tracking is recommended. Slack Investor cannot stress this enough. The ATO will want information when you sell stocks. They require your sell date and price, and the harder to find, buy date and initial cost of your shares/ETF’s – in order to calculate any capital gains tax. This procedure can get complicated when you buy shares in different lots or, participate in a dividend re-investment program as the ATO require a cost-basis for each parcel. It will make your life easier if you have a portfolio manager or, at least, a capital gains tracker.
Portfolio Tracking with Monthly Fees
For Australians, the slickest products involve an annual/monthly cost as good financial software requires constant development.
A highly-rated financial portfolio tracker that includes tax statements and capital gains tracking for $228 annually for one portfolio or $348 annually for up to 4 portfolios. Sharesight used to have a free version that included tax reporting for one portfolio with under 10 shares. However, they have now dropped tax reporting privileges for free accounts.
Another nice looking and highly-rated product. A financial portfolio tracker that includes tax statements and capital gains tracking for $240 annually for one portfolio or $300 annually for up to 3 portfolios.
This is a US-based portfolio tracker so it will not help greatly with your Australian tax reporting. However, it is a highly-rated and a good looking way to track your Australian and US shares for around $130 AUD annually for one portfolio or $230 AUD annually for up to 10 portfolios.
Finance Tracking without Monthly Fees
Down at the budget end we have products that require a bit more work. There are a few other alternative finance products that are discussed in Whirlpool – but Slack Investor presents a few solutions below.
This is a very basic tracker that can track your overall portfolio performance if you enter your buys and sells and dividends manually. Slack Investor uses Yahoo Finance to keep an eye on the day to day movements of his portfolio plus watchlists. There is no tax reporting or help with capital gains, but Yahoo Finance is a free portal to track your portfolio and it will have your buy and sell information in one place.
An excellent free alternative to portfolio tracking is the google sheets based Stock Profit. There is a bit of a effort in setting it up but it will track your performance and capital gains with ease. This really is a good product.
If you are not worried about portfolio tracking you will make your life easier at tax time if you have some means of tracking capital gains and the free web-based but locally stored cgtracker will supply you with capital gains information and tax statements. Capital Gains Tracker is free to use but you must enter all your buy/sell information.
Personal taxes and Mytax
Firstly, a ‘Hats Off’ to the ATO who have made their online tax returns (MyTax) a very simple process with the ‘pre-filling’ of wages, dividends and distributions. Slack Investor usually waits till September to allow all the pre-filling documents time to trickle in to the ATO. It is now incredibly easy to fill in a tax return yourself and only those with very complex tax affairs should need an accountant.
By September, all of Slack Investor’s personal tax information was pre-filled, including the distributions from ETF’s that often have internal capital gains and foreign income. He had additional capital gains from share selling and opted to use their Capital Gains Worksheet which was part of MyTax – it already had the small ETF internal capital gains prefilled and he just had to add buy dates and costs for each lot of shares sold. Slack Investor had all of this information on MS Money – but any capital gains tracker would have this information in one place. For advice on any problems with MyTax, he went to the ATO community rather than the official ATO site – which often has opaque, or vague, solutions to your problems.
SMSF Tax Return
Slack Investor started the process in October when his provider (Esuperfund) prompted him to allocate categories to each of the transactions for his SMSF Bank account. All the dividends and distributions were pre-filled but he needed to label the type of contributions (concessional/non-concessional) and the relevant member of the SMSF. Also, he had to determine from which pension account any withdrawals came from. There was some head scratching to make sure the minimum amount withdrawal requirement (5% age 65–74, 4% age under 65) from each pension account had been fulfilled.
Slack Investor had to assure Esuperfund that he hadn’t bought any exotic assets outside of their monitored banks/brokers. He also had to upload Tax Statements from each of the ETF’s in the SMSF portfolio. Luckily, they were all in one place in my Dividends_Tax Statements folder. He submitted the checklist and now have to wait a long ~7 months – till May 2026. By which time, Esuperfund will have obtained an Auditor’s review and will present the trustees with the 2025 SMSF Tax Return to sign.
Apologies to all readers who may have jumped on the CSL train in the past 5 years due to Slack Investor continually ‘bigging up’ this grand old stock. He has always been impressed with companies that spend a good portion of their profits in Research and Development.
‘CSL have committed to spending 10% of global revenue on R&D for new and existing products.’ –Livewire
Slack Investor has been a holder of this company since the ‘good old days’ (before 2020). But has occasionally topped up when the price dipped below $300. So, he does share some of the recent pain.
The latest price slump was on the back of the FY 2025 results and the announcement that one of CSL’s components, CSL Seqirus, was to be demerged. The markets were not that impressed with the planned restructure and slowing growth momentum.
However, some sectors of the business are doing well. CSL Behring and CSL Vifor reported strong growth.
This CSL horse should have some good riding ahead
The 2025 AGM indicated that management were taking the knife to costs and staff in a restructure of the business that is underpinned by the Seqirus spinoff and $500 million in pre-tax savings.
‘Despite all the headwinds from competition and regulatory price cuts, they’re (CSL) still growing double digit. I think that’s a pretty good business.‘ Daniel Moore – IML, reported in Livewire
When nervous … Slack Investor will always go back to the numbers. Market Screener – Finance Tab for CSL supplies some of the answers. The Income chart looks healthy.
Income (Black) and projected income (Striped Grey) for CSL – Market Screener
Looking at the projected PE, ROE and growth from Market Screener – future predictions look OK.
Another wild month. The S&P 500 (+3.5%) and the FTSE 100 (+1.8%) remain in all time high territory. The ASX 200 sputtering and down 1.4% for the month.
Slack Investor remains IN for all markets.
The recent strength of the US market has pushed the closing monthly value to more than 15% above my old stop loss. I adjusted the stop loss upwards to a new ‘higher low’ of 6212 for the S&P 500.
All Index pages and charts have been updated to reflect the monthly changes – (ASX Index, UK Index, US Index).
The quarterly updates showing the current holdings and cash position of the Slack Portfolio have also been completed.
Slack Investor Hero John ‘Jack’ Bogle with a fitting ‘HOLD’ mantra.
Bogleheads and Vanguard
Slack Investor has paid tribute to the contribution that Jack Bogle has made to the investing world. He started Vanguard Investments in 1974. Bogle’s philosophy wasn’t about trying to beat the index and charging high costs – instead, he would offer a low-cost alternative fund based on the US index. Mr Bogle’s pioneering work with these low-cost funds has led to the popular low-cost Exchange Traded Funds (ETF’s) that proliferate today. Astonishingly, there are now more ETF’s listed in the US (4300) than actual companies (4200).
Slack Investor can well remember the days when a fund manager would charge you 4% of your capital for entry and then lift a further 2-3% in annual fees for the privilege of investing your money – that was not the ‘good old days’.
‘Bogleheads’ are a group of mainly US followers of Jack Bogle’s philosophy and they strive for long-term growth through low-cost, diversified index funds while minimizing fees. They are generally ‘Buy and Hold’ investors. One of their strategies is the three-fund portfolio – where investing is simplified into three low-cost funds – one for the local share market, one for international shares and one for bonds. For the US, the conservative recommended proportions are, your age defines the % in Bonds and the remainder percentage is split so that roughly 20% is in international equities.
In Australia, such a portfolio is a little more complicated as you need to cover yourself for currency risk – and hedge your international exposure for any fluctuations in the Australian dollar. Exposure to emerging markets is also recommended as a diversifier of risk. A Bogleheads type of portfolio is possible using 5 Vanguard funds.
The 5 ETF’s for an Australian Bogleheads portfolio. Management Expense Ratios (MER) ar shown for each ETF. For a younger person, Australian Bogleheads suggest proportions VAS: 20%, VGAD: 20%, VGS: 40%, VGE: 10% and VAF: 10% – From Passive Investing Australia.
Slack Investor can see the attraction that Bogleheads have in passive investing and, when he loses his mojo, will opt for a more simplified Boglehead-approved passive exposure to growth and cash/bond assets. Stockspot also offer diversified portfolios using just 5 ETF’s – with excellent performance so far.
Vanguard Financial Year Total Returns for major asset classes
Extract from the FY 2025 Vanguard Index Chart Brochure showing the total returns for each asset class for the financial years since 1996. Top performing asset class for the year is highlighted in green and the worst in pink.
Vanguard Annual Chart
It is now time for Slack Investor’s favourite chart – a succinct demonstration of long-term investing. The essence of successful investing is to be invested at leastsomewhere in appreciating assets – and then, let time do its work. Below is an extract from the Vanguard 2025 long-term investing chart. The numbers on the right are the results of investing $10,000 in the Index funds of the indicated asset classes for 30 years.
Extract from the 2025 Vanguard Index chart (Just the 2007-2025 portion is shown) – the dollar values on the right are the results of investing $10,000 in index funds in each asset class for 30 years (since July 1995). – Check out the full 30-year glory of the Vanguard 2025.PDF chart – Click image for the whole 30-yr chart.
August 2025 – End of Month Update
Slack Investor is IN for Australian index shares, the US Index S&P 500 and the FTSE 100.
The S&P 500 (+1.9%) continues its progress. Slack Investor is pleased to go with the flow but remains nervous for the US markets. For the ASX 200 (+2.6%) and the FTSE 100 (+0.6%), also some monthly gains.
The latest reporting season has brought a few shocks to the Slack Portfolio. Big falls in Botanix (BOT), Telix Pharma (TLX), and CSL. Not so worried about CSL, but looking to reduce holdings in the less established companies (BOT, TLX) when things settle down. Next blog, Slack investor will go into detail how he is dealing with a few sudden drops in individual stocks.
All Index pages and charts have been updated to reflect the monthly changes – (ASX Index, UK Index, US Index).
‘Do not judge me by my success, judge me by how many times I fell down and got back up again.’
Nelson Mandela
Slack Investor is obviously not in Nelson Mandela’s league … but I do admire President Mandela’s resilience. Learning to live with stock prices that go down is an important part of successful investing.
This post is a bit of an annual ‘poke around’ in the portfolio. The percentage yearly returns quoted in this post include costs (brokerage) but, the returns are before tax. This raw figure can then be compared with other investment returns.
I use the incredibly useful Market Screener to analyze the financial data from each company. This excellent site allows free access (up to a daily limit) to their analyst’s data, on the financials tab for each stock, once you register with an email address. Slack Investor extracted the predicted 2027 Price/Earnings (PE) Ratio and Return on Equity (ROE) and average forecast revenue growth for the financial years 2025, 2026 and 2027. He then condensed all this information into one number, the Slack Factor, to make things easy for Slack Investor’s limited brain. The Slack Factor is still ‘experimental’ but, increasingly, Slack Investor is using it to differentiate between stocks – the higher Slack Factor, the better.
Slack Investor Stinkers – FY 2025
Financial year 2025 was big on volatility. Despite this, Slack Investor’s followed markets all ended up with solid total returns when dividends are taken into account. Australia +9.0%, the UK +10.8%, and the US +15.2%. Slack Investor knows that stinkers are a part of the game, even in good years – and managed to attach himself to a few stinkers along the way.
Webjet (WEB + WJL) -46%
This is a complicated story as Slack Investor bought into Webjet (WEB) which then split into two entities. The ‘sizzle’ was that Web Travel Group contained a wholesale booking business that was growing fast. Suffice to say, that sales didn’t meet expectations and both companies sank. He then lost faith and sold both. When it comes to the travel business, Slack Investor wants to be only a consumer as there seems too much competition in this field.
CSL (CSL) -18%
(CSL – Forecast 2027: PE 22, ROE 18%, Av. Growth 14%, Slack Factor 12). CSL is a big holding for Slack Investor (10% of portfolio) and, for the past 6 years, has been rangebound between $230 and $330. It has not had the chart of a growth stock but, they have continued to spend on Research & Product Development at levels around 10% of revenue. This should be a good thing for future earnings. The eternal optimist in me is thinking … this is the year! But, I also thought this last year … and the year before … there is a strong chart signal this year though – the powerful ‘wedgie’! If it wasn’t already such a large part of my portfolio, now would be a good time to buy.
Botanix Pharma (BOT) -12%
Slack Investor entered the murky and volatile world of Biotechs with a small stake (0.2% of portfolio) in Botanix Pharmaceuticals. So far, not very good! It seems there is a lot that can go wrong in this field for startups.
Slack Investor also went backwards with his holdings in Dicker Data (DDR), GlobalX ACDC ETF, and Cochlear (COH) – all now sold. Wisetech (WTC) and Alphabet (GOOGL) were also on the slide but, thankfully now recovering.
Slack Investor Nuggets – FY 2025
Nuggets are a blessing in any portfolio – this Financial Year, there were some bewdies. Slack Investor continues to invest in high Return on Equity (ROE) companies with a track record of increasing earnings. If expectations are met, companies with these qualities sometimes behave as ‘golden nuggets’.
TechnologyOne (TNE) +124%
(TNE – Forecast 2027: PE 64, ROE 34%, Av. Growth 20%, Slack Factor 11). Technology One is a great Australian success story. It sells software as a service to other companies internationally. I first came across this company through Rudi Filapek-Vandyck – who included TNE as one of his ‘All Weather’ stocks. Glad to be an owner of TNE, as well as owning many other of Rudi’s All Weathers. Very highly valued (2027 PE 64) now though!
Pro Medicus (PME) +104%
(PME – Forecast 2027: PE 154, ROE 53%, Av. Growth 38%, Slack Factor 13). Pro Medicus is a developer and supplier of healthcare imaging software and services to hospitals and diagnostic imaging groups. The Price to Earnings ratio is frighteningly high (2027 PE 154) – but Slack Investor is enjoying the journey.
Codan (CDA) +75%
(CDA – Forecast 2027: PE 27, ROE 23%, Av. Growth 20%, Slack Factor 17). Codan is a technology company that specializes in communications and metal detecting. It is one of Slack Investor’s core holdings. CDA has had a checkered past – a nugget in FY 2021 (+161%), a stinker in FY 2022 (-58%), a nugget in 2024 (+54%), and again, a nugget (+75%) in 2025. What has kept me in the stock was its low debt, (generally) increasing earnings, and the high profitability (ROE 23%).
Supply Network (SNL) +70%
(SNL – Forecast 2027: PE 30, ROE 38%, Av. Growth 18%, Slack Factor 23). Supply Network are a bus and truck parts distribution company using the Multispares brand. Although there are competitors in the big-vehicle parts business, what sets SNL apart from the rest is their great management and strict adherence to processes and efficiency. They have consistently held a profitability advantage over their rivals. They have maintained a high Return on Equity (ROE) of 36% even as the company has expanded and grown in price. What a well-run company!
Megaport (MP1) +52%
(MP1 – Forecast 2027: PE 74, ROE 18%, Av. Growth 55%, Slack Factor 13). Megaport provides software that helps other companies tocreate and manage secure network connections between offices and the cloud. They must be doing something right as their average predicted revenue growth for the next 3 years is 55%! I’m in, but this is one of Slack Investor’s more risky buys!
Nick Scali (NCK) +43%
(NCK– Forecast 2027: PE 18, ROE 28%, Av. Growth 14%, Slack Factor 22). Nick Scali is well known in Australia for importing and retailing furniture. They have done an excellent job of expanding their business in Australia due to their fine management skills. They expanded into the UK in 2024 and have been quietly, and efficiently, getting on with the job. Future profitability remains good (ROE 28%), and PE not too high.
Some very honourable mentions to some top results this year that didn’t quite make the nuggets. BetaShares Global Cybersecurity ETF (HACK)+38%; Resmed Technologies (RMD.AX)+38%; XRF Scientific(XRF)+37%; Wesfarmers(WES)+35%; Coles (COL) +29% and REA Group (REA) +24%.
Slack Investor Investments performance – FY 2025
After a bonanza FY 2024, this was a wild ‘Trump affected’ FY 2025. In the Australian superannuation scene, the median growth fund (61 to 80% in growth assets) did manage to return+10.5% in FY 2025.
Slack investor has just two piles of funds for his retirement – the Stable Income pile (Cash and Conservative) and an Investments Pile. The Stable income represents around 25% of total retirement funds. I used to rebalance each of my piles after every year, but the stable pile now has enough in it that, together with dividends from my investments, could supply me with enough living expenses to last out an extended (3-yr) bad run of the stock markets. Slack Investor would not be forced to sell stocks. The stable pile has again produced a moderate return of nearly 5% (inflation plus ~ 2.5%).
The Investments Portfolio rise nicely with preliminary figures showing an 18.1% rise at June 30, 2025. A good result for Slack Investor in his growth investments pile. Including the relatively low returns from my stable income pile (4.7%), overall, the weighted return on all my retirement funds grew 14.6%.
For the most part, Slack Investor concentrates his annual performance details for the much more exciting Investments pile.
For Slack Investor, the 5-yr performance is a more useful way of measuring – as it takes out the fluctuations of yearly returns. At the end of FY 2025, the Slack Investments Portfolio has a compounding 5-yr annual return of around 15%. Full results and benchmarks expected next post.
July 2025 – end of Month Update
The new financial year has started off positively for Slack Investor markets. The ASX 200 + 2.3%; FTSE 100 +4.2%; and S&P 500 +2.2%. He remains IN for all index positions.
I have taken the opportunity to adjust upwards the stop losses on all followed index markets. The prices had crept up to around 15% above their old stop losses. See Index pages for details.
All Index pages (ASX Index, UK Index, US Index) and charts have been updated to reflect the monthly changes.
Slack Investor has a healthy regard for those who make a living based upon their performance. It is a general financial wisdom that, if you are following large companies, you will very probably be better off in the long term with passive index funds.
Percentage of active funds that underperform (orange) over a 15-yr period – Spiva
However, some active boutique stock pickers may have an advantage when it comes to smaller international companies. In this category, 33.65% of active funds are able to outperform over a 15-yr period.
Slack Investor is currently backing his own abilities on the stock picking front. But, there will come a time when I lack the ability or inclination to do the (admittedly limited) research work. Also, there are some Slack Investor readers who would like to outsource this task.
Hyperion Global Growth Companies Fund ETF (ASX: HYGG)
I don’t follow individual companies in overseas markets that closely – but there are those that do – and do it very well.
HYGG is not a low-cost fund as it has a Management Expense Ratio of 0.70% and an outperformance fee of 20% against benchmarks. The ETF, to date, has not paid a dividend. However, in this case, it seems that the managers are offering good value net of fees.
Growth of the Hyperion Global Growth Companies Fund after fees and costs have been extracted since 2014 – Hyperion
One-year performance (2024 May +47.3%) is impressive. However, Slack Investor is after the real grafters who can produce impressive results over the long-term. Hyperion is establishing a case for consideration.
5 and 10 year Performance of HYGG – net of fees – Hyperion
The advantage of an active fund manager is that they can be nimble and take advantage of any opportunities that the Hyperion analysts discover.
Holdings
% Portfolio Weight
1-Year Return
Forward P/E
Tesla Inc
12.29
65.9
166.67
ServiceNow Inc
9.42
34.16
60.98
Microsoft Corp
7.95
10.73
33.11
Palantir Technologies Inc Ordinary Shares – Class A
7.65
498.55
263.16
ASML Holding NV ADR
7.15
-20.81
28.74
Spotify Technology SA
7.1
143.26
71.43
Amazon.com Inc
7
12.14
33.67
Block Inc Class A
5.72
2.88
17.73
Meta Platforms Inc Class A
4.61
41.9
28.65
Table of the top holdings of HYGG, their portfolio weight, 1-yr return, and forward PE at May 2025.
When it is time to really ‘get on the couch’, Slack Investor would take a look at these blokes to invest his money. This Hyperion crowd seem to know what they are doing.
June 2025 – End of Month Update
The financial year closes and the Australian, UK and US markets are all in positive territory for the financial year.
Slack Investor remains IN for all followed markets. The ASX 200 (+1.3%) and FTSE 100 (-0.1%) moved modestly. It is a continuation of good times in the US with the S&P 500 rising 5.0%. Are our American friends delusional in an expensive US market? Or, is Slack Investor missing something.
All Index pages and charts have been updated to reflect the monthly changes – (ASX Index, UK Index, US Index). The quarterly updates to the Slack Portfolio have also been completed.
Examples of the reams of CHESS holding statements that have cluttered my mailbox for years
I have never had a dispute with my broker about how many shares I own in a company … and, I am sure, that by waving a paper CHESS Holding Statement that I couldn’t dispute a logged transaction or a contract note. But, in an unexpected (due to very low expectations!) breakthrough from the ASX, they have finally opted for the possibility of a non-postal way of receiving your CHESS Holding Statement. But, of course, they have had to make the transition complicated.
Years ago, when Slack Investor first tried to get his holding statements electronically, he was told on the phone by the ASX that ‘it was impossible’ as they do not hold email addresses – just postal addresses for each holding! Hence the reliance on the postal service.
To get this started. you must contact your broker – who, is also your CHESS sponsor for your shares and ETF’s. In Slack Investors case, he has two Australian brokers: SelfWealth and Commsec. Each of them have to be informed – as each CHESS sponsor will have their own HIN for your holdings.
For SelfWealth, they have a link to explain proceedings. For Commsec, there is also a link to show the necessary steps. Slack Investor had to login then navigate to Portfolio / Holdings / View or Edit Account Details. Then elect to receive statements electronically.
In both cases, once you have opted in, you will receive multiple notifications from the ASX. A printed notification mailed to your postal address will confirm the change.
The CHESS statements Portal
There will also be an ASX CHESS Statements Portal registration email – where you will have to establish a username and password plus, an email confirming a change to communication preferences.
Phew … but it’s worth it! Slack Investor suggests you start this process now.
Once your email is registered with the ASX, future holding statements should be emailed. Slack Investor doesn’t even want that – the Broker tally of his shares is fine with him. Slack Investor’s preferred way of interaction will be through the CHESS statements login page – where you can view (or download) your statements.
May 2025 – End of month update
Slack Investor remains IN for Australian index shares, the recently bought US Index S&P 500 and, the FTSE 100.
May has been a good month for UK, US and the Australian Index.
The S&P 500 (+6.1%), the ASX 200 up 3.8% and, the FTSE 100 up 3.3% as the endless tariff fiasco unfolds .
All Index pages and charts have been updated to reflect the monthly changes – (ASX Index, UK Index, US Index).
Slack Investor is enjoying the relative calm in the markets over these past couple of days. It is a good time to update the charts for the Cyclically Adjusted Price to Earnings ratios (CAPE). He first started using CAPE as a ‘value’ tool in September 2021 and, the most recent post on Market Value was for the end of December 2024. That feels like such a long time ago – pre-Donald 2.0. The markets have been on quite a ride since then.
Shiller P/E and S&P 500 10-year annualised forward returns from 1983. There is a clear relationship between higher CAPE and lower expected 10-yr returns for the S&P 500. Data valid as of 31 December 2023 – Investco
For the following charts, Slack Investor uses monthly CAPE data from Barclays, the 40-yr mean is calculated and plotted together with the latest CAPE values – estimated up until 14 April 2025. A ‘fair value’ zone is created in green where the CAPE is within one standard deviation of the mean (average) – click images for better resolution.
ASX 200 CAPE Value – 3% above long-term av.
ASX CAPE values – estimated up until April 14 2025
FTSE 100 CAPE Value – 10% below long-term av.
UK CAPE values – estimated up until April 14 2025
S&P 500 CAPE Value – 32% above long-term av.
US CAPE values – estimated up until April 14 2025
Market value and Market Timing Experiment
The ASX 200 and the FTSE 100 are both within 10% of their 40-yr CAPE average. When within the green ‘fair value’ range, Slack Investor has patience and he will be assessing these charts at the end of the month.
The US index chart was, and still is, above the ‘fair value’ range and Slack investor had the S&P 500 on a weekly check. Last week it plunged below the stop loss and Slack Investor sold. These are early days in the Trump 2.0 experience – given current form, there will be more surprises.
The US Index is just a small part of the Slack Portfolio (1.6%). The bulk of his portfolio is currently riding the market roller coaster – patiently in search of long-term returns.
Goldfinger, the Bond film from 1964, portrays a scene where a woman is covered in gold and dies from ‘skin suffocation’. Slack Investor notes that gold has had a good recent run and hopes that those involved with gold continue to prosper.
Is Gold Good?
A lot of people think so – and, it has performed well lately.
The price of gold exceeded US$2,900 an ounce last week for the first time. Since October 2023, it has risen by more than US$1,000 an ounce. The price is three times higher than it was a decade ago. – Tom Stevenson, Fidelity – Livewire, February 2025
Gold does well as a hedge against inflation and, in times of uncertainty. The chart over the past 10 years looks pretty good.
There is no doubt that gold has been successful during market crashes in the past – and it will decrease your portfolio volatility. But, usually, it can also drag the portfolio down when times are good in the markets. Unusually, since 2023, gold has increased greatly at the same time that stock markets have also done well. Something weird is going on!
Gold makes sense for investors that sleep better at night knowing that at least some part of their portfolio is going up during times of market stress. Gold might also help to avoid selling your investments during a downturn – when the shares are undervalued! You could sell the gold for income during a market crash.
Slack Investor has his own plan for these down times – the Stable Income pile.
Does Gold appeal to Slack Investor as an investment?
Firstly, gold would not get a guernsey in his Stable Income pile as it does not produce any income by itself.
Only a Goldsmith Knows the Value of Gold – Old Turkish Proverb
Despite the sound arguments for gold, Slack Investor just can’t bring himself to put gold in the Slack Portfolio – the Investment pile. The big problem he has, is that Slack Investor has no idea whether the current price for gold is a fair reflection of its value – it has had a big run lately – is it overvalued? At least when he is buying stocks, he can have a look at the company’s earnings and get an idea of whether the company is cheap, or expensive, by comparing its projected price to earnings (P/E) ratio.
This is Slack Investor’s difficulty with all non-income producing assets – these include precious metals, artworks and even cryptocurrency – there is no way to determine their actual value. The price of these speculative assets is only defined by what the next person will pay for them. So, none of these types of assets will appear in the Slack Investment Portfolio.
Slack Investor will continue to take his chances with stocks that are growing, predicted to grow further, and producing income. His investment portfolio will be more volatile for not having gold – but, it is the long-term performance that counts the most with Slack Investor.
Slack Investor hopes to never draw down on his investments in the lean years when his stocks are undervalued. He has his Stable Income pile (currently 22% of total retirement funds) to get him through the periods when his Investment pile might go negative. The Stable Income fund target is to earn a little above the inflation rate. The Slack Investment fund has more ambitious goals and the pursuit of growing stocks (without gold) might have more ups and downs – but, so far it’s working!
5-yr Return
10-yr Return
15-yr Return
13.4%
15.7%
14.8%
Slack Investment Portfolio long-term annual compounding average returns. Pre-tax annual average returns till the end FY24.
February 2025 – End of month update
Slack Investor is IN for Australian index shares, the US Index S&P 500 and the FTSE 100.
February has continued well for the UK Index, the FTSE 100 is up 1.6 %.
The S&P 500 (-1.4%) has had a bit of a pull back and the ASX 200 is down 4.2%, erasing its January gains.
All Index pages and charts have been updated to reflect the monthly changes – (ASX Index, UK Index, US Index).


