

Slack Investor has just returned from a holiday in beautiful Far North Queensland. A stay at Mission Beach reminded him of a venture proposed by Mayfair 101 – 7 years ago. The founder, James Mawhinney came to Mission Beach in 2019 with a vision of developing the recently tropical-cyclone-ravaged area into a major tourism destination. The plan included the purchase of Dunk Island, the Elandra Resort and 230 other properties in the Mission Beach area. This, naturally, caused a lot of local excitement. However, any tourist development in a cyclone-prone area (two hours from an international airport) is, at best, a speculative investment. Slack Investor was not impressed with the offering and presented a ‘run for the hills’ argument.
Mayfair … You’re ‘investor-facing division’ is not getting any of Slack Investor’s money. Despite the slick presentations and corporate glitz – Slack Investor, November 2019
The problem was that Mr Mawhinney planned to pay for this development with investors’ cash – those who bought into his Mayfair 101 funds. Further, he portrayed these funds as ‘A popular cash and term deposit alternative…’ ASIC determined that these claims were ‘misleading and deceptive’.
You could say that things did not go well for Mayfair 101. There is a complicated history of the Australian Securities and Investments Commission (ASIC) involvement with this matter since 2020. There seems to be a movement towards a conclusion for Mr Mawhinney. However, sadly for investors in his funds, they are facing a potential wipeout.
Following an ASIC investigation, James Mawhinney, of Port Melbourne, Victoria, has been arrested and charged with four counts of engaging in dishonest conduct in the course of carrying on a financial services business. – ASIC Media Release, 9th April 2024
The case is listed for sentence indication on 16 November 2026 at the County Court of Victoria.
Market Value – June 2026 Update

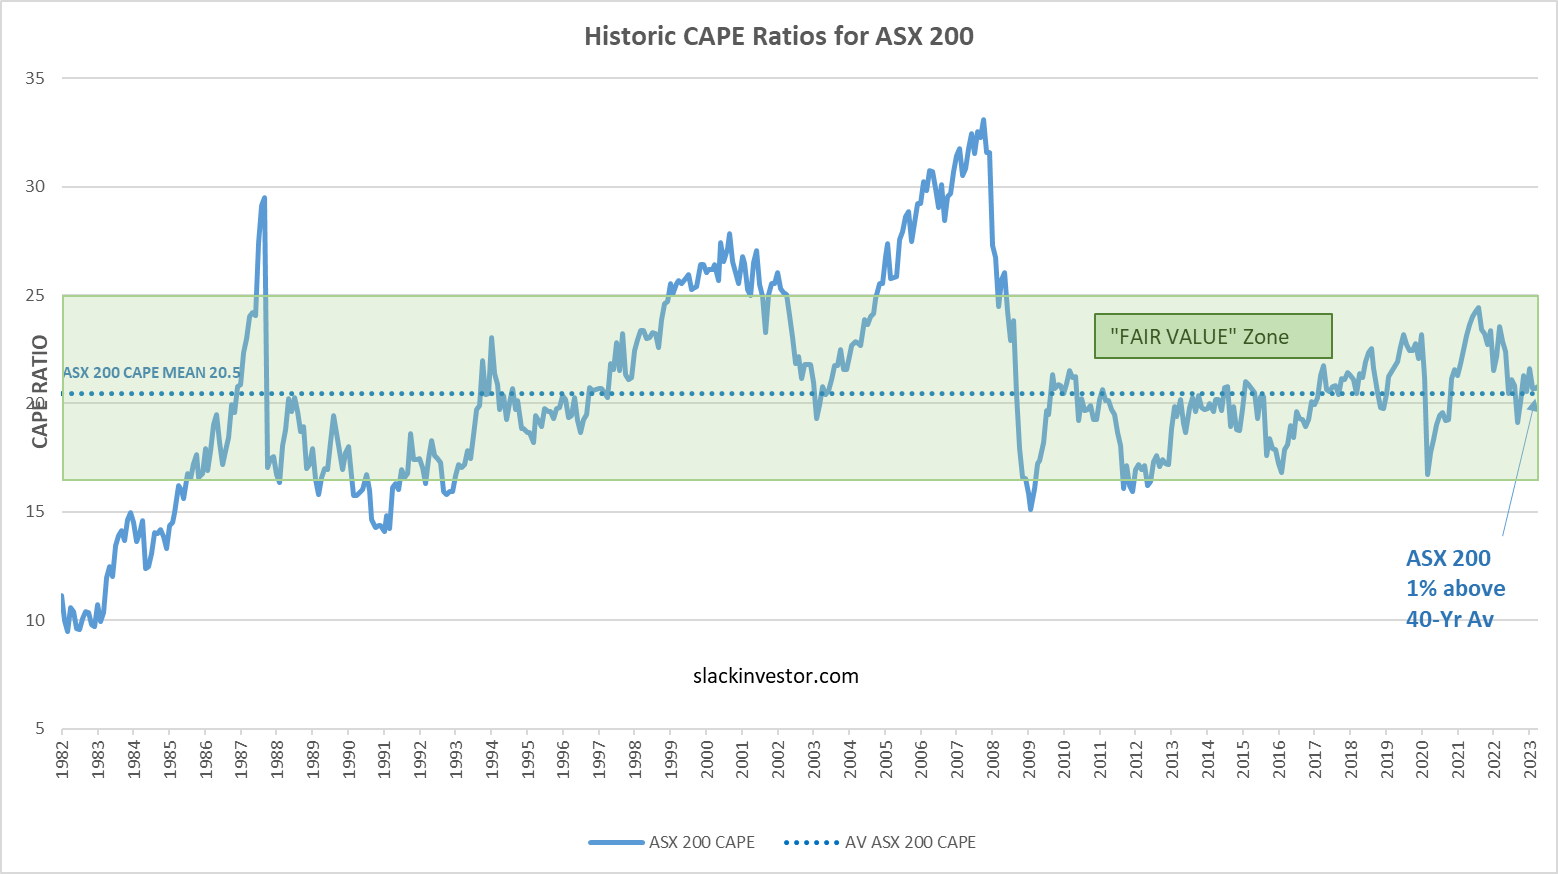
Slack Investor likes to keep up to date with how the markets are travelling for value and he has been using charts for the Cyclically Adjusted Price to Earnings ratios (CAPE). This value is also known as the Shiller P/E Ratio after Robert Shiller the economics professor that made this measure popular. Slack Investor first started using CAPE as a ‘value’ tool in September 2021. The most recent post on Market Value was November 2025 – about 7 months ago.
For the following charts, Slack Investor uses monthly CAPE data from Barclays, the 40-yr mean is calculated and plotted together with the latest actual CAPE values up until 29 May 2026. A ‘fair value’ zone is created in green where the CAPE is within one standard deviation of the mean (average) – click images for better resolution.
ASX 200 CAPE Value 22.38 (9% above long-term av.)

FTSE 100 CAPE Value 18.99 (9% above long-term av.)

S&P 500 CAPE Value 40.19 (60% above long-term av.)

The UK and Australian markets are not too overvalued. However, in terms of the Shiller P/E the S&P 500 has remained in overvalued territory. Unfortunately, whenever the S&P 500 has a large correction the effects are usually felt in other markets.
There is some good research that links CAPE to long-term returns … and future returns are what gets Slack Investor excited. The predictive skill of the Schiller CAPE is not very good over 1-yr and 5-yr periods. However, it does show some skill for periods of 10 years and longer. The tight spread around the trend line indicates that the Shiller P/E might have some predictive skill.

If this relationship holds, the average S&P 500 10-year annualised forward returns are predicted to be close to zero or negative. This indicates that now is not a good time to start buying the S&P 500.
The Buffet Indicator as Value

Another way of determining market value is the Buffet Indicator. Mr Buffet regards this as ‘probably the best single measure of where valuations stand at any given moment.’ It uses the historical ratio of big economic values The Total US Market Capitalization (TMC) over US Gross Domestic Product (GDP). The 20-yr average of this ratio is 128.84%. The current ratio is now 233.8 % of the latest GDP. Based upon these figures, Buffet Indicator implies the US Market is ‘Significantly Overvalued’ and it is likely to return -1.2% a year from this level of valuation, including dividends for the next 8 years.
Grim News. The recent ‘frothy’ SpaceX Initial Public Offering breaking all sorts of records – for a currently loss-making company – is another symptom. With the exception of Platinum 101, Slack Investor is not a great predictor of events, but ‘in his waters’ he thinks we may be near the top of the market.


