 Slack Investor remains IN for Australian index shares and IN for the US Index S&P 500. The dogs’s breakfast of Brexit still weighs heavily in my mind but I am buying back IN for UK Index shares – as the FTSE 100 has shown remarkable resilience to the fraught politics of Brexit and displayed a monthly uptrend. I will buy back IN to the FTSE at near the end of March value of 7279 (See UK Index Page).
There were rises in all Slack Investor followed markets (ASX200 +0.2%; FTSE100 +2.9%; S&P500 +1.8%). All Index pages and charts have been updated to reflect the monthly changes – (ASX Index, UK Index, US Index).
The Slack Monthly Index Trading Method – Revised
Last month I mused about the diminishing returns of the Slack Monthly Index Trading Method. I am still outperforming the “Buy and Hold” investor in all followed markets – but the advantage is slim. Per annum outperformance is 2.9%, 1.2% and 1.1% for the ASX, UK and US markets respectively. Not really fantastic results when you consider that I am missing out on the “buy and hold” dividends for the times when I am out of the markets.
The Slack Index method was devised with a lot of back-testing on 30 years of market performances and does really well when sustained bear markets occur as it gets out of the market at a hopefully early stage in the price downturn. Ideally, the Slack method should stay in the market for the smaller fluctuations (corrections <~10%) and get out of stocks before it becomes a full bear market. The problem with my current strategy is that I am getting “whipsawed” out of the market in these smaller downturns.
Connection between US Bear markets and Recessions
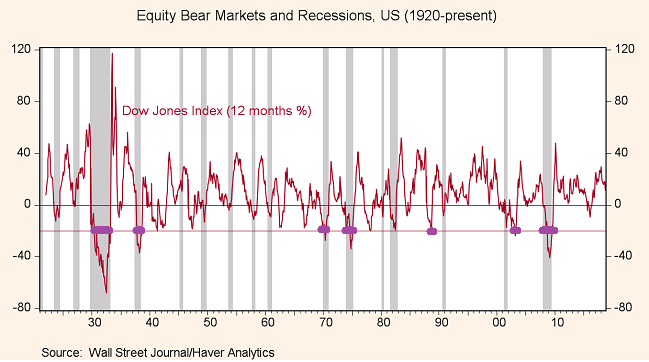
There is a link (not a perfect link!) between US bear markets (drops of more than 20%) and US recessions. In the chart below, the bear markets are shown in thick purple lines and they mostly coincide with US recessions (grey columns).

All well and good so far, but we want to be out of the markets before a recession … how can we predict recession? Should we ask economists? A recent survey found that 3/4 of those surveyed thought there would be a recession before 2021. This is good to have in the mind … but not that useful in a practical sense. Economists have a poor record in predicting recessions. I don’t mean to be mean to economists … I also have had a career in prediction (weather!) and there are many similarities. Like the atmosphere, economics is complicated, not all factors are known, and not all processes are truly understood – But we do our best!
The “Inverted Yield Curve” as a predictor of US Recession
There might be an answer to predicting recessions by using the US Treasury Bond “Yield curve” . You may have heard about the yield curve (Probably not! but read here) – where short-term US treasury bill yields are compared to long-term yields. Normally, you would expect the yields on your money to be higher the longer that you lock it away – this corresponds to the periods above the red line on the graph below. Usually, the 10-year Treasury bill yield is greater than the 1-year bill yield. However, if there is a very a gloomy US outlook and the Feds are raising rates, you can earn more in the short term. This is when the yield difference [10-yr minus 1-yr (or 2-yr)] slips into negative territory, and you have an inverted yield curve – shown with the thick purple lines below. Note that these inverted yields usually occur one to two years before a recession (grey columns).

Chart showing where the yeild curve becomes inverted (purple lines) with the US recessions shown as grey columns. Modified from Morningstar report – original source Gurufocus.com
I love being the owner of companies and much prefer being in the share market than not. I will adopt the brand new exciting Slack Monthly method that should keep me in shares for the smaller downturns (corrections). I will ignore any monthly downturn signals UNLESS there is a sustained period of the US Inverted Yield Curve. I can check this at the end of the month at Gurufocus.com. This should maximise my chances of staying in shares until there is a threat of recession and the expectation of a larger downturn.

This has been a tough month for this part of the world – where, in Christchurch, a hate-filled idiot with a gun can a cause so much heartache for decent families. Great respect to the people of New Zealand and their exceptional leader Jacinda Ardern for bringing gun reform and such a strong message for humanity in the wake of this tragedy.
Power to love, tolerance and humanity.

I like this new approach.it is like Buy and Hold but gets you out of the indexes when a catastrophe looms
Thanks Whizer