

‘Do not judge me by my success, judge me by how many times I fell down and got back up again.’
Nelson Mandela
Slack Investor is obviously not in Nelson Mandela’s league … but I do admire President Mandela’s resilience. Learning to live with stock prices that go down is an important part of successful investing.
This post is a bit of an annual ‘poke around’ in the portfolio. The percentage yearly returns quoted in this post include costs (brokerage) but, the returns are before tax. This raw figure can then be compared with other investment returns.
I use the incredibly useful Market Screener to analyze the financial data from each company. This excellent site allows free access (up to a daily limit) to their analyst’s data, on the financials tab for each stock, once you register with an email address. Slack Investor extracted the predicted 2027 Price/Earnings (PE) Ratio and Return on Equity (ROE) and average forecast revenue growth for the financial years 2025, 2026 and 2027. He then condensed all this information into one number, the Slack Factor, to make things easy for Slack Investor’s limited brain. The Slack Factor is still ‘experimental’ but, increasingly, Slack Investor is using it to differentiate between stocks – the higher Slack Factor, the better.
Slack Investor Stinkers – FY 2025

Financial year 2025 was big on volatility. Despite this, Slack Investor’s followed markets all ended up with solid total returns when dividends are taken into account. Australia +9.0%, the UK +10.8%, and the US +15.2%. Slack Investor knows that stinkers are a part of the game, even in good years – and managed to attach himself to a few stinkers along the way.
Webjet (WEB + WJL) -46%

This is a complicated story as Slack Investor bought into Webjet (WEB) which then split into two entities. The ‘sizzle’ was that Web Travel Group contained a wholesale booking business that was growing fast. Suffice to say, that sales didn’t meet expectations and both companies sank. He then lost faith and sold both. When it comes to the travel business, Slack Investor wants to be only a consumer as there seems too much competition in this field.
CSL (CSL) -18%

(CSL – Forecast 2027: PE 22, ROE 18%, Av. Growth 14%, Slack Factor 12). CSL is a big holding for Slack Investor (10% of portfolio) and, for the past 6 years, has been rangebound between $230 and $330. It has not had the chart of a growth stock but, they have continued to spend on Research & Product Development at levels around 10% of revenue. This should be a good thing for future earnings. The eternal optimist in me is thinking … this is the year! But, I also thought this last year … and the year before … there is a strong chart signal this year though – the powerful ‘wedgie’! If it wasn’t already such a large part of my portfolio, now would be a good time to buy.
Botanix Pharma (BOT) -12%

Slack Investor entered the murky and volatile world of Biotechs with a small stake (0.2% of portfolio) in Botanix Pharmaceuticals. So far, not very good! It seems there is a lot that can go wrong in this field for startups.
Slack Investor also went backwards with his holdings in Dicker Data (DDR), GlobalX ACDC ETF, and Cochlear (COH) – all now sold. Wisetech (WTC) and Alphabet (GOOGL) were also on the slide but, thankfully now recovering.
Slack Investor Nuggets – FY 2025

Nuggets are a blessing in any portfolio – this Financial Year, there were some bewdies. Slack Investor continues to invest in high Return on Equity (ROE) companies with a track record of increasing earnings. If expectations are met, companies with these qualities sometimes behave as ‘golden nuggets’.
TechnologyOne (TNE) +124%

(TNE – Forecast 2027: PE 64, ROE 34%, Av. Growth 20%, Slack Factor 11). Technology One is a great Australian success story. It sells software as a service to other companies internationally. I first came across this company through Rudi Filapek-Vandyck – who included TNE as one of his ‘All Weather’ stocks. Glad to be an owner of TNE, as well as owning many other of Rudi’s All Weathers. Very highly valued (2027 PE 64) now though!
Pro Medicus (PME) +104%

(PME – Forecast 2027: PE 154, ROE 53%, Av. Growth 38%, Slack Factor 13). Pro Medicus is a developer and supplier of healthcare imaging software and services to hospitals and diagnostic imaging groups. The Price to Earnings ratio is frighteningly high (2027 PE 154) – but Slack Investor is enjoying the journey.
Codan (CDA) +75%

(CDA – Forecast 2027: PE 27, ROE 23%, Av. Growth 20%, Slack Factor 17). Codan is a technology company that specializes in communications and metal detecting. It is one of Slack Investor’s core holdings. CDA has had a checkered past – a nugget in FY 2021 (+161%), a stinker in FY 2022 (-58%), a nugget in 2024 (+54%), and again, a nugget (+75%) in 2025. What has kept me in the stock was its low debt, (generally) increasing earnings, and the high profitability (ROE 23%).
Supply Network (SNL) +70%

(SNL – Forecast 2027: PE 30, ROE 38%, Av. Growth 18%, Slack Factor 23). Supply Network are a bus and truck parts distribution company using the Multispares brand. Although there are competitors in the big-vehicle parts business, what sets SNL apart from the rest is their great management and strict adherence to processes and efficiency. They have consistently held a profitability advantage over their rivals. They have maintained a high Return on Equity (ROE) of 36% even as the company has expanded and grown in price. What a well-run company!
Megaport (MP1) +52%

(MP1 – Forecast 2027: PE 74, ROE 18%, Av. Growth 55%, Slack Factor 13). Megaport provides software that helps other companies to create and manage secure network connections between offices and the cloud. They must be doing something right as their average predicted revenue growth for the next 3 years is 55%! I’m in, but this is one of Slack Investor’s more risky buys!
Nick Scali (NCK) +43%

(NCK– Forecast 2027: PE 18, ROE 28%, Av. Growth 14%, Slack Factor 22). Nick Scali is well known in Australia for importing and retailing furniture. They have done an excellent job of expanding their business in Australia due to their fine management skills. They expanded into the UK in 2024 and have been quietly, and efficiently, getting on with the job. Future profitability remains good (ROE 28%), and PE not too high.
Some very honourable mentions to some top results this year that didn’t quite make the nuggets. BetaShares Global Cybersecurity ETF (HACK) +38%; Resmed Technologies (RMD.AX) +38%; XRF Scientific (XRF) +37%; Wesfarmers (WES) +35%; Coles (COL) +29% and REA Group (REA) +24%.
Slack Investor Investments performance – FY 2025
After a bonanza FY 2024, this was a wild ‘Trump affected’ FY 2025. In the Australian superannuation scene, the median growth fund (61 to 80% in growth assets) did manage to return+10.5% in FY 2025.

Slack investor has just two piles of funds for his retirement – the Stable Income pile (Cash and Conservative) and an Investments Pile. The Stable income represents around 25% of total retirement funds. I used to rebalance each of my piles after every year, but the stable pile now has enough in it that, together with dividends from my investments, could supply me with enough living expenses to last out an extended (3-yr) bad run of the stock markets. Slack Investor would not be forced to sell stocks. The stable pile has again produced a moderate return of nearly 5% (inflation plus ~ 2.5%).
The Investments Portfolio rise nicely with preliminary figures showing an 18.1% rise at June 30, 2025. A good result for Slack Investor in his growth investments pile. Including the relatively low returns from my stable income pile (4.7%), overall, the weighted return on all my retirement funds grew 14.6%.
For the most part, Slack Investor concentrates his annual performance details for the much more exciting Investments pile.
For Slack Investor, the 5-yr performance is a more useful way of measuring – as it takes out the fluctuations of yearly returns. At the end of FY 2025, the Slack Investments Portfolio has a compounding 5-yr annual return of around 15%. Full results and benchmarks expected next post.
July 2025 – end of Month Update

The new financial year has started off positively for Slack Investor markets. The ASX 200 + 2.3%; FTSE 100 +4.2%; and S&P 500 +2.2%. He remains IN for all index positions.
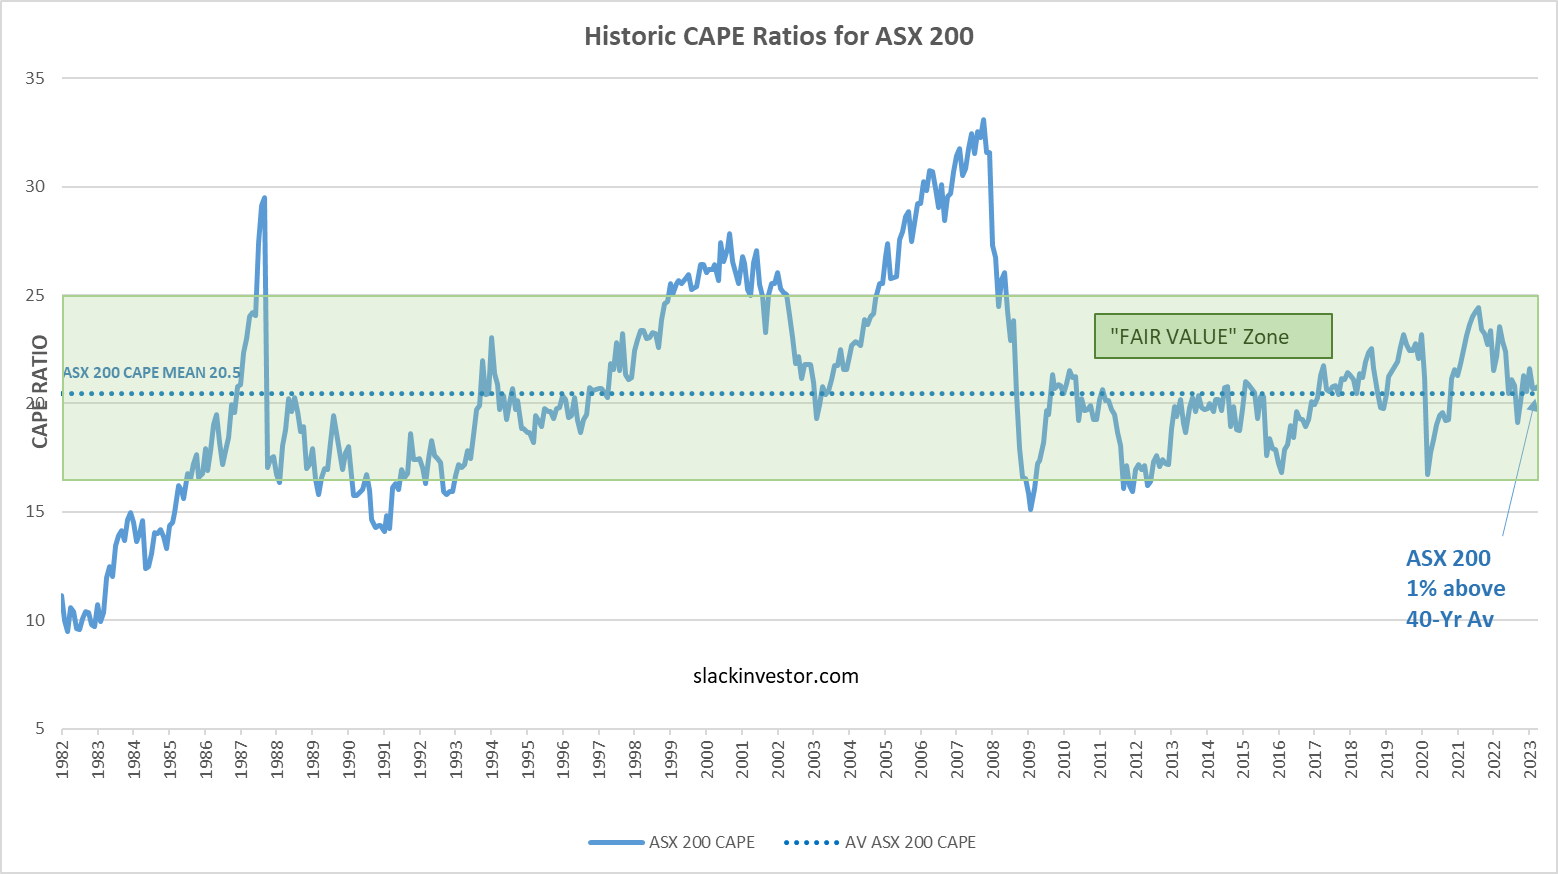
I have taken the opportunity to adjust upwards the stop losses on all followed index markets. The prices had crept up to around 15% above their old stop losses. See Index pages for details.
All Index pages (ASX Index, UK Index, US Index) and charts have been updated to reflect the monthly changes.


