Financial Year 2018 – Slack Portfolio Review

Adapted from Pixabay

As Slack Investor is a student of the financial arts and a lover of measurement, the end of the financial year is a great time to review and see how the Slack Investments performed. The Index funds were reviewed last post. Index funds are a great way to start investing in shares – as you are spreading your risk over at least a hundred companies.

The next step, as you become more familiar with investing and can start running a critical eye over individual companies, is to invest in individual stocks.

Over 75% of Slack Investor’s share investments are in individual stocks. See Portfolio

Most of my holdings are in growth stocks. These stocks usually have a high Return on Equity (ROE>15%) – with a track record of increasing dividends. By their nature, they have a relatively high PE ratio and are usually punished in the markets during reporting season if there is any bad news affecting future earnings. This I accept.

Slack Investor Stinkers – FY 2018

From Pixabay

Each year I expect a few stinkers and dont beat myself up about them when they occur. If they breach the monthly stop loss – I usually sell at the start of the next month.

Print

-24%

A special mention for IPH. Although some investors have done well with this stock. this company has a prawn heads in the bin on a hot day type of stink for me. Slack Investor likes the idea of the company -and it seems to be making a bit of a recovery since I sold it! However, I have had difficulty trading it successfully as it would go into long periods of declining price immediately after my buys. I should have learned my lesson years ago with Slater and Gordon – Never trust Lawyers!

-22%

HSO has got caught up with a tightening on government health spending and a decline in private health care admissions.

-21%
RHC is also in the healthcare sector and has the same challenges as HSO. But, it is a well managed company and Slack Investor will look for an opportunity to get back in this stock.

Slack Investor Gold Nuggets – FY 2018 

The wonderful thing about owning growth companies is that sometimes they surprise on the upside and grow faster than expected. Altium is the “Welcome Stranger” of gold nuggets.



+166%   ALU makes software for the designing of integrated circuit boards that are used widely in a range of technology products. Some analysts fear that the stock is overpriced. Its PE ratio is currently an eye-watering 74 – but this is rapidly reducing with projected earnings over the next few years. I am still holding as we go into the reporting season – the optimist in me thinks that there may be more good news on future earnings. There are even rumours of a takeover by  larger company. But if not, my end of month stop loss is $19.61.

+71%   A2M’s brand relies on a patented process that makes milk with only the A2 protein. A2M has been the subject of a previous post, and it is true that I’m yet to be convinced of the health benefits attributed to A2 Milk – But their marketing is very good and the trend is more powerful than logic in my book!  Slack Investor was stop-lossed out of this stock earlier this year, but has bought in again -and hope for good news this reporting season.

Honourable mentions for Slack Investor portfolio stocks that increased more than 30% in this remarkable financial year. These nuggets include APX, CSL, MQG, NCK (no longer held), PMC, REA, SEK and WOR.

Slack Investor SMSF performance – FY 2018 

I have written extensively on calculating Portfolio returns. I run a few separate portfolios but only quote the SMSF annual returns as this portfolio is externally audited. All percentage earnings quoted include brokerage and portfolio costs. Both raw and franked dividends are included as income. So essentially, the percentage returns include costs but are before tax. This raw figure can then be compared with other investment returns.

In what can only be described as a high-water mark for Slack Investor’s SMSF portfolio investing prowess. (and the luck of holding ALU inside it), Portfolio return FY18 was 37.6%.

One-year high returns are welcome but Slack Investor puts more weight on multi-year performance. The past 5-yr progress of the Slack Portfolio is 23.6%, 2.6%(whoops!), 14.2%, 19.5%, and 37.6%. This gives a compounding annual 5-yr return for the Slack Investor SMSF portfolio of 18.9%.  The benchmark ASX 200 Accumulation Index (Including dividends) 1-yr and 5-yr compounding annual returns are 12.7% and 9.9% , respectively.

“Good luck is a residue of preparation.”

Jack Youngblood – Hall of Fame American Footballer

Slack Investor readily acknowledges the luck factor in the stock selection process and realises that this FY18 as an extraordinary year for the portfolio (I expect more moderate returns!). I have found that a disciplined stop loss process, a bit of effort and research on stock selection, and following of trends on share charts (technical analysis) can yield very good results.

Over the next year I will post on how to start investing and the specific techniques that Slack Investor uses – It is not difficult … Empower Yourself!


Do not be afraid of failure

From Pixabay

Based upon fear of what he might discover, Slack Investor keeps most personal introspection to a minimum. However, for a number of reasons, I am particularly fond of reviewing  investment performance. … and always looking to tie in a quote from a great scientist and Time Magazine’s 1999 Person of the century – Albert Einstein.

Image from laserfiche.com, quote from brainyquotes.com

Anyone who has never made a mistake has never tried anything new – Albert Einstein (1879-1955)

Slack Investor has made plenty of mistakes and regularly racks up the failures. The 2017 Financial Year, (1 July 2016 – 30 June 2017) annual review of his portfolio has revealed a few “shockers” in the Slack Investor Self Managed Super Fund (SMSF ) portfolio – which I not so proudly list (with their percentage losses) as my financial year investment “fails”

  • Sirtex (SRX) -34%
  • TPG Telecom (TPM) -23%
  • McMillan Shakespeare (MMS) -16%
  • G8 Education (GEM) -15%
  • APN Outdoor (APO) -14%
  • Amaysim (AYS) -11%

These companies have usually dropped in price during reporting season where a bit of bad news, or a failure to reach projected profit forecasts, triggered dramatic price falls. In all cases, these stocks were eventually sold because they breached the end of month stop losses that I had set.

Slack Investor just accepts these setbacks as part of the investment process. The type of companies that I invest in are usually

  1. Growth companies
  2. Have an above average “return on equity” ROE
  3. Have an above average “price to earnings” P/E ratio – Where P/E =Current price/Historical earnings.

The reason that Slack Investor is interested in these stocks is that they usually have higher projected earnings in the years ahead and should perform better than the general market. When I am looking at a stock, the forecast P/E ratios are given much more importance than the actual P/E ratios. However, it is the nature of these stocks to be particularly sensitive to any change in the forecast earnings. If profit forecasts are not met during a reporting season (sometimes referred to as the “confession season”), then there is a mad rush for the exits and the price plummets. Slack Investor is not a day trader and prefers not to watch his stocks continuously. As a result, he is never able to pick the precise right time to bail out.

I am sure there is a cost to this monthly decision making technique – but it is a price a pay gladly. The “peace of mind” in knowing that I only have to make stock decisions once a month – and that I can ignore the daily fluctuations of share prices is priceless to me.

The upside of dealing with these type of companies is that they have excellent growth potential. Thankfully, there was some good news in the portfolio this last financial year due to some heavy lifting from the following stocks.

  • Corporate Travel (CTD) +66%

    from thinklikeatrader.co.uk
  • Challenger (CGF) +57%
  • Altium (ALU) +37%
  • Macquarie Group(MQG) +36%
  • Commonwealth Serum Laboratory (CSL) +25%
  • Nick Scali (NCK) +22%

So far, the Slack Investor approach has been very fruitful. I usually own about 20 different stocks and this diversity allows my portfolio to have some individual failures and still do well.

The point of this post is that you can fail in the stock market … but also succeed. I certainly do not dwell on these failures – they are just part of investing.

For the 2017 financial year my SMSF portfolio achieved an overall return (IRR) of 19.5%.

Measurement … The Sweet Science Part 3


Paul Keating, the father of dividend imputation (franking credits) in 1987 – when he was the Treasurer for the Australian Government. He was Prime Minister 1991-96 and is shown here ready to nail to the wall any “24 carat pissants” and “mangy maggots” that cross his path. Source

Previous posts One and Two in this series show a few simple ways to calculate your portfolio performance. Slack Investor has a complicated set of portfolios with inflows and outflows during the year and, for an accurate performance figure, it is necessary to account for the time that your money is available for investment. For example, an additional $10000 invested at the start of the year should add more value to your portfolio compared to an addition in the last week of the year.

I usually calculate returns before taxes, this is sometimes referred to as “gross of tax”. An important reason to do these calculations is to compare your investments with other investments, such as a managed fund, super fund, ETF or another benchmark. With very few exceptions, performance figures are always reported pre-tax. In Australia, we are lucky enough to have our dividends mostly “franked” or tax paid at the rate of 30%. Thanks Paul Keating … you are a legend!

So I include these franking credits in my return calculations as they represent tax already paid on my Australian Dividends.

The Internal Rate of Return (IRR) and Time-Weighted Return (TWR) are two different ways of calculating portfolio performance. The IRR measures the actual return achieved by an investor’s money in a portfolio. There are also good arguments for using the TWR, Both IRR and TWR take into account the time value of money … The arguments for each are presented here –

Slack Investor likes to do things accurately … but easily! The TWR requires a portfolio valuation after every inflow/outflow and this adds an extra step to the calculation. With a spreadsheet, the IRR calculation is a simpler process. So Internal rate of Return (IRR) is what I use.

3. Portfolio with inflows and outflows – Internal Rate of Return (IRR)

The IRR is also known as the “money weighted rate of return” and the calculation is complex as it involves trial and error mathematics – for the enthusiasts further details can be found here.

The good news is that with an Excel spreadsheet, all this is taken care of by the XIRR function and you only have to enter the start value of your portfolio, dates of inflow/outflows and finish value. I have included the rather complex set of inflows and outflows based upon my SMSF portfolio and hope that your portfolio is simpler. Just use the lines that you need, but it is important that you have an initial date and balance, and a finish date and balance – (scroll down to the bottom of the spreadsheet). Inflows are entered as positive numbers and outflows as negative.

To download the Excel spreadsheet that that performs these calculations go to the Resources Page.

Of course, if this is too difficult, you can always get a bit of software to do your portfolio management and return calculations. Slack Investor likes to keep the costs of investing on the down low and Sharesight in Australia is an excellent choice for the starting investor. They offer free monitoring of investments, capital gains and performance reports if you have 10 or less investments to track. Slack Investor monitors his shares with the retired but excellent (and free) “Sunset” international version of Microsoft Money  Australian Version, UK Version, US Version linked into share prices with MSMoneyQuotes. The latter is not freeware but it is $10 US well spent.

In the USA, Personal Capital is recommended. 

Measurement … The Sweet Science Part 2

Lord Kelvin (1824-1907) – based on image from Wikimedia


Measuring your portfolio performance can do your head in … but Slack Investor thinks that it is important that you set aside a time to evaluate your investment performance at least once a year. I choose the end of the financial year in Australia (June 30) as a good time for these calculations … but you can chose your own date … and, if whatever you do, you do it consistently … you are going to be OK.

First of all … why measure? Lord Kelvin was a smart bloke – as discussed previously, measurement adds to our knowledge – By measuring your own portfolio performance you get an idea of how you are doing compared to other portfolios, share indicies, or managed funds. If you consistently underperform against other bench marks … then it might be time to become the ultimate Slack Investor and outsource your portfolio to Index funds.

Outsourcing into passive investment is not so bad … if the fees are kept low … “The Buff” , (aka Warren Buffet, the worlds greatest investor!)  has promised to give away 99% of his $65 billion fortune when he dies – the remainder of his fortune will be invested in bonds and index funds to support his wife and family.

My advice to the trustee could not be more simple: Put 10% of the cash in short-term government bonds and 90% in a very low-cost S&P 500 index fund. (I suggest Vanguard’s.) I believe the trust’s long-term results from this policy will be superior to those attained by most investors – whether pension funds, institutions or individuals – who employ high-fee managers. from source

  1. Portfolio with no inflows or outflows

Lets start simply … supposing your have the most basic portfolio that reinvests its earnings with no external inflows (“cash in”, contributions, or transfer) and no external outflows (“cash out”, pension payment, or transfer) from your investment portfolio during the year and you want to do a performance calculation to benchmark yourself with other funds and investments. Most people can come up with a starting value and an ending value of their portfolios at the year (financial year) end – this includes the value of your stocks and any portfolio cash. Slack Investor prefers to calculate his returns before tax. So, tax credits such as franked dividends are included in his portfolio return.

Whatever happens inside this portfolio – buys and sells, dividends, interest, expenses, brokerage and fees – are just part of the portfolio business and will be reflected in its finishing value.

An Excel spreadsheet that will make this job easier is available on the Resources Page.

2. Portfolio with inflows and outflows – Approximation

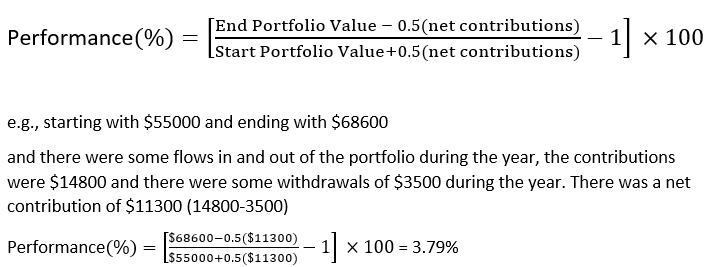
However, for most real portfolios, there is money transferred into, or out of, your portfolio account during the year. Unlike the Beardstown Ladies, if you want to accurately portray how you are doing, it is imperative that you account for cash flows either in or out of your portfolio. If you want the least amount of work and you are willing to calculate your portfolio return approximately – the way below will work a treat. A net contributions figure is obtained (inflows – outflows) to give an ‘average’ amount of capital invested during the year and by subtracting 50% of net additions from the ending value and adding 50% to the beginning value – we get an approximate percentage return.

An Excel spreadsheet that that performs these calculations is available on the Resources Page.

Of course, in real life, rather than using averages, portfolio returns depend greatly in the timing of when you had capital available. The above is an approximation. Slack Investor chooses to go into more detail to reflect the time value of money for his portfolio. These intricate ways will be revealed in the last of this measurement series next month.