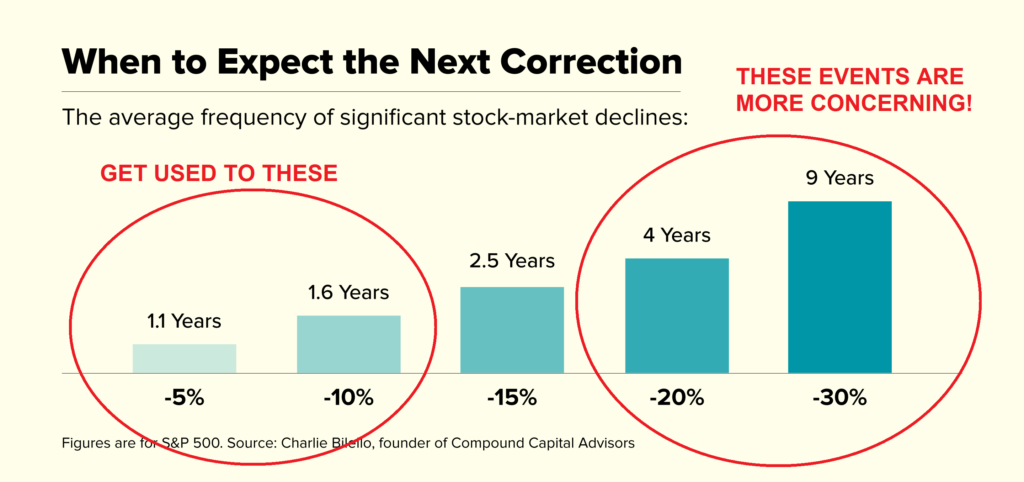
It is worth revisiting corrections, these annoying dips in the market are testing – even for experienced investors.
A correction is a 10% or greater decline in the stock market in a short period of time. The average rally period without a correction is 357 trading days, according to a Deutsche Bank analysis of stock market moves since the 1950’s.
CNN Business
As there are about 250 trading days in a year and Slack Investor is hoping for a 50-year investing career (50 x 250 / 357 )= 35 . That’s a lot of corrections … so I had better have a plan on how to handle them.
Despite recent rallies in the last few trading days – In January 2022, there was a technical “correction” in both the US and Australian markets.
The S&P 500 index dipped into “correction” territory on Monday for the first time since March 2020. The benchmark fell 10% or more from its recent high in early January, before a late-day rally.
Greg Iacurci – CNBC – Jan 25, 2022
Most corrections solve themselves. A 2018 Goldman Sachs report found that the average correction for the S&P 500 lasted only four months. In the 40 years prior to 2020, the S&P 500 experienced 17 corrections – only a third of them resulted in the larger falls associated with bear markets.

This is not an exact science – but when a correction occurs, I try to think about the scenario where a correction will turn into something worse.
As most bear markets are associated with a recession – Are the economic conditions are such that a recession is likely? – Is this current correction likely to lead to a “bear market”?
The Omicron COVID-19 variant has showed that it is difficult to project into the future. However, even though some industries are suffering, while interest rates remain low and there seems to be some signs of economic recovery. I will try to shut out the “noise” this time.
Index stocks – S&P 500, ASX 200, FTSE 100
I am running a personal 20-yr experiment using “stop losses” to try to time the market for index funds, rather than “buy and hold”. The results so far can be found on the index pages of this blog (ASX Index, UK Index, US Index). The annual gains using this timing method have been modest so far with outperformance of +1.5%, +1.9% and -0.3% , respectively. The jury is still out on this experiment and a full report will be given in 2024.
For the bulk of my holdings – do nothing
For most of my stocks, I take no action during these corrections. Most of my portfolio contains individual companies that I have built up a history with, and I am mostly convinced of their viability and growth outlook for the next 5-10 years. For these companies, I am comfortable to ride the stock price up … and down – this is something I accept about owning stocks. For example, although getting out of the US Index last week, I am happy to keep my holding of US Alphabet stock (GOOGL) – for many reasons.
Tinker with the stocks that you are not so sure about
There is a second-tier in my stock portfolio that includes my theme ETF’s and other companies that I am not so totally convinced about – or, I have changed my mind about their growth prospects. A correction is a good time to review these stocks.
With shares, the market decides what “it thinks” that your stock is worth on a minute by minute basis. This stock price can vary a lot on a daily basis – but over a longer period, the stock price should be decided by more fundamental levers such as earnings, amount of debt, quality of management, and growth potential.
January 2022 – End of Month Update
Slack Investor is off the couch and sold his US Index shares. He remains IN for Australian index shares (only just!) and the FTSE 100.
A bit of turbulence in the markets this month. The ASX 200 and S&P 500 dipped into correction territory briefly. At the end of the month, the Australian Index had a monthly fall of 6.4% and the US Index, down 5.3%. The FTSE 100 was a relative star +1.1%. Slack Investor remains watchful.
On Monday 24 January, (New York time) I sold my US Index shares at the S&P equivalent of 4332. This was below the previous days closing price (4397) … but I have to accept the possibility of a bit of “sell shrinkage” on the next day – in this case 1.5%. However, for consistency. I have used the closing price on the previous week for my calculations.
Despite the end of month rally in S&P 500 price (Jan 31 4515) – I am glad to out of the US Index as I have been troubled by the high valuations for some time. Slack Investor would not have the foresight to get out right at the top of the market. In the spirit of “trying to get things mostly right” I am happy with the US Index trade – a gain of 55.4% over 19 months.
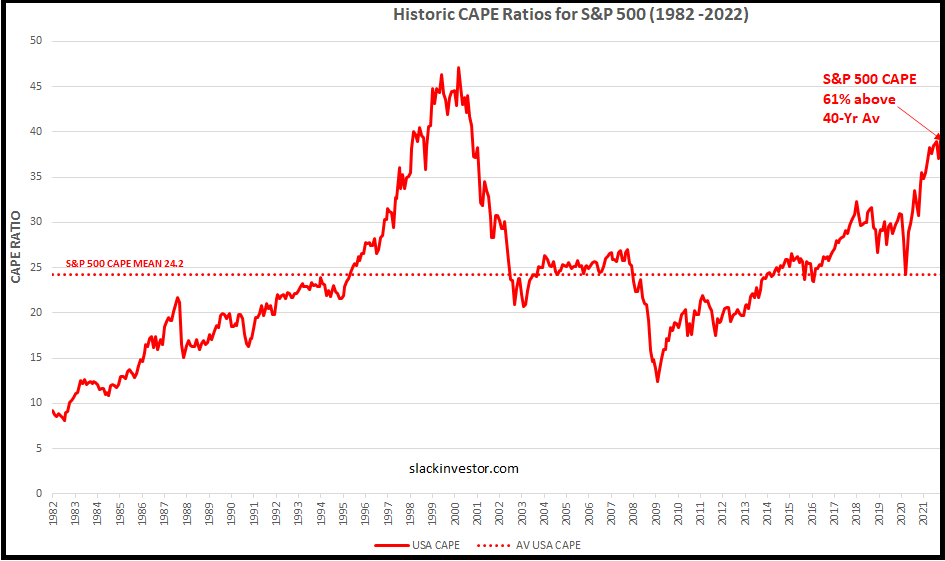
As a way of “zooming out” to get an idea of how current prices are in relation to long term trends – I have updated my Cyclically Adjusted Price to Earnings ratios (CAPE) to include December 2021 data for the S&P 500. Despite it’s limitations, CAPE is still Slack Investor’s best way of assessing quickly whether a market index is under or over-valued compared to its long term average.
At the end of 2021, the S&P 500 was still 61% above its 40-yr average! This is in contrast to the ASX 200 (14% above average) and the FTSE 100 (about average). When valuations get this far out of kilter, for the US Index, my assessment is that there is much more downside risk than upside. The recent breach of the stop loss on a weekly basis gave me an excuse to get out of this broad index.

All Index pages and charts have been updated to reflect the monthly changes – (ASX Index, UK Index, US Index).

