CSL Goes to the Well – Share Purchase Plan 2022

From muslimaid.org

I did a north to south crossing of Africa 36 years ago, mostly in a 4-wheel drive truck and, if we stopped in a village, my routine would be to grab the water containers and find a well. This was always a pleasant task as it involved a line-up, sign language and usually a few giggles at the strange visitor’s expense. Overwhelmingly, the well would be attended by women and there was usually an air of joy and strong comradery in the queue.

CSL have just gone to the “well” – with a Share Purchase Plan (SPP).  They have purchased a Swiss company, Vifor Pharma (VIFN:SWX), which specialises in iron deficiency and renal disease. The acquisition cost US$11.7 billion and they have already covered most of this with an institutional placement and some new debt. CSL is trying to raise another $750 million from the “well” of shareholders pockets – and they seem likely to get it – let’s hope they will be welcomed back when they need water next time.

It seems to be the way of things that institutions (Brokers and Super Funds) get the first slice … and when this is done, there is a limited offer to retail investors – just to stop them whinging. Most of the time I participate in any share purchase plans as a convenient way to accumulate shares without the cost of brokerage. The CSL offer is set at $273 (or a 2% discount to the share price if CSL shares fall below this mark). Bids for the stock must be lodged by the 7th February, 2022.

“The combination with Vifor Pharma is expected to be financially compelling for our shareholders while expanding and diversifying our revenue base. It is expected to be immediately earnings accretive in the first full year of CSL ownership …”

Paul Perreault, Chief Executive Officer and Managing Director of CSL

Nice words Mr Perreault … but I have never ever read a share purchase plan that didn’t offer these comforting sentiments – CEO’s usually love to inform us of their astute decisions. “earnings accretive” just means that after all costs and synergies, the earnings per CSL share (EPS) should go up … and, when earnings go up, the share price should go up.

The projections for acquisitions and mergers are always complicated – the only real proof … will be down the track.

(There is) 30 years of evidence demonstrating that most acquisitions don’t create value for the acquiring company’s shareholders

Harvard Business Review

CSL do have a good track record of acquiring new assets and turning them into future growth engines. However, The CSL offer to acquire Vifor Pharma was generous at 40% above the Vifor list price. But this is where it gets even more complicated, the size of the premium is historically not a good predictor of how the deal will turn out. The most pertinent question is “Has CSL paid more than the acquisition was worth to to CSL.” Slack Investor has no answers yet … We will see how this deal settles.

On 14/01/2022, the CSL share price was $276.00 – A premium of $3.00 to the $273 offer price – or about 1% – so the SPP offer price is no real bargain. Despite Slack Investor’s endless devotion for the company, it seems that the market is currently out of love with CSL.

In the background, despite ongoing problems with plasma collection due to COVID-19, CSL has increased its profit for the past two financial years by 20% – but its share price does not really reflect that. After a rapid increase in 2019, the share price has gone nowhere in the last two years. Macquarie analysts have a 12-month price target on CSL of $338.
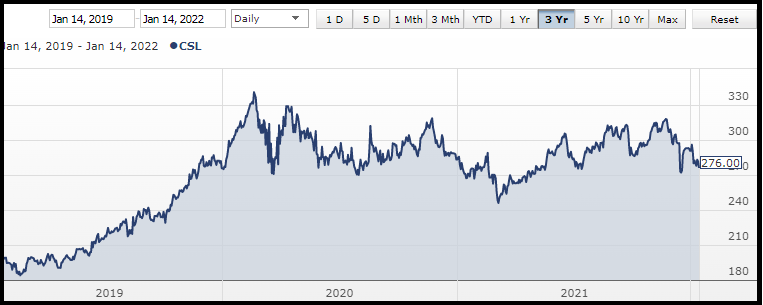
CSL Share price over the last 3 years – From marketscreener.com

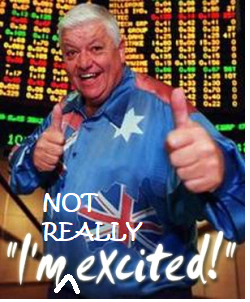
Unlike Big Kev, I’m not super excited … The investor presentation, as always, looks compelling – full of talk about global reach, synergies and “developing a significant renal franchise”. But what really impressed me was the confirmation of CSL FY22 NPAT guidance of US$2,150 million – US$2,250 million. This is not advice, even though Slack Investor already has a big holding in this company, he will be participating in a slice of the CSL 2022 SPP.

Scaling Back

One of the annoying things about share purchase plans is the “scaling back”. If the SPP represents a good deal … they are usually oversubscribed. The 2021 Commonwealth Bank (CBA) SPP was such a good deal for retirees that they stumped up $18 billion more than the amount of shares on offer. Their share bids were scaled back by 79.4%. If you applied for $20 000 of CBA, you would have to send off this amount – and you would have been rewarded with $4120 of shares – and then have to wait for your refund.

The CSL 2022 SPP is not as immediately financially rewarding as the CBA offer and will probably not be scaled back as much. CSL has assured share owners that after the SPP, they will at least retaining their percentage shareholding in the company,

Slack Investor has done some rough calculations. As this new placement and SPP represents approximately 5.1% of current CSL ordinary shares on issue -This means that I should be able to buy at least 5.1% of my current holdings in the SPP without the inconvenience of scaling back.

If I owned $120 000 of CSL shares, I would be guaranteed to get at least $6120 (120K x 0.051) in the new SPP without scaling back. I round this up to the nearest allowable dollar value parcel, which is $10000 – and that’s how much I will apply for. Most people would apply for more (up to $30K) – but my portfolio is heavy with CSL, and this scaling back process just annoys me! CSL will of course refund any scaled back monies as soon as practicable after 14/02/2022 – without interest.

The Slack Buying Process … and August 2021 – End of Month Update

The moneychanger and his wife, by Marinus van Reymerswaele, 1538, Public Domain, via Wikimedia Commons

As much as Slack Investor hates retail shopping – he loves to have the opportunity to buy into companies. Like any new relationship, when you buy a stock, you are not really sure about how its going to work out – but its exciting!

I have never been good at predicting when the stock market will have a correction … and the current high valuations (PE Ratios well above the long term average) do make me nervous. However, Slack Investor would much rather be in the game than out of it and I have been looking for a few companies that would hopefully not suffer too greatly if a correction occurred in the stock market.

This is not advice … just an insight to the Slack Investor bumbling buying process. My rate of converting bought shares into winners of 55% is not that impressive – but my overall performance results are good.

I get heaps of buying ideas from investment sites such as Motley Fool, Livewire, ShareCafe. But I will always, always, check things out for myself before parting with any Slack Dollars. This involves a rigorous screening of the fundamental financial metrics PLUS a look at how the stock chart is going on Incredible Charts. This technical analysis consists of a quick scan to see if the chart is in a continual growth trend … or has just had a “breakout”, or broken out of a downtrend.

Let’s put on the buying boots. As well as the companies below, Slack Investor has also recently added to some small positions in PPK.ASX and TNE.ASX.

Slack Investor Buys Alphabet (GOOGL.NASDAQ)

Half of my buying cash went into an existing holding – Alphabet (GOOGL), This money making juggernaut is part of the new economy and I could buy this company all day. The first step is to go to the phenomenal MarketScreener.com. Registration is free on this site and they allow you to look at analyst data for up to 5 stocks a day.

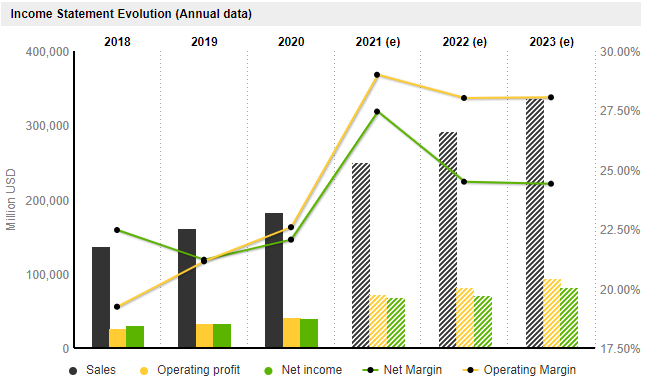
Search for your stock and then finding the Financials Tab for that company. Firstly, I look at the chart Income/Sales and Earnings per Share. An increasing trend is good and, if the estimated earnings (2021 – 2023) are also increasing, I’m acutely interested. I do a quick check on debt levels. Alphabet is a cash king – has more cash than debt – solid tick.

Income statement for Alphabet (GOOGL on the US NASDAQ exchange) – from MarketScreener

I continue with MarketScreener to extract the Return on Equity (ROE), both past and forecast. I hope that it is above 15% – Big Tick. The final bit of vital information is the Price Earnings (PE) Ratio and it is here that I gauge whether the stock price is too high for Slack Investor. For a good growth stock, I try not to buy into companies that have a projected PE of more than 40-(50 at a pinch). The analyst estimates for GOOGL is a forecast PE of 23.0 in 2023 – Tick
YEAR2018201920202021(e)2022(e)2023(e)
ROE18.619.319.027.225.825.2
PE Ratio23.927.229.928.026.623.0
Table of fundamental financial metrics for Alphabet. The documented Return on Equity (ROE) and Price Earnings (PE) Ratio are shown for 2018-2020. Analyst estimates are shown for later years – MarketScreener.com
Slack Investor Buys NASDAQ 100 ETF (NDQ.ASX)

Not everyone has access to direct access to US shares – if you only have an ASX broker, then to get exposure to Alphabet, a good substitute is to buy the BetaShares NASDAQ ETF (NDQ) – Alphabet represents 8.1% of this ETF – and you get profit machines like Apple, Amazon, Microsoft and Facebook thrown in. I topped up my holding here as well.

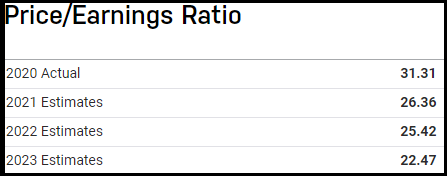
The ROE for the NASDAQ Index is 17.7 and increasing (30 June 21) – Above 15, Tick. The projected 2023 estimate for the Price/Earnings Ratio for the NASDAQ Index is 22.47 – Below 40, Tick – Very reasonable for growth sector companies.

NASDAQ 100 Index 2020 PE Ratios and Forward Estimates of PE for 2021, 2022. 2023 – From nasdaq.com

Slack Investor Buys Coles Group (COL.ASX)

YEAR201920202021(e)2022(e)2023(e)2024(e)
ROE29.832.837.034.933.334.3
PE Ratio12.422.922.423.422.821.4
Table of Fundamental metrics for Coles Group . The documented Return on Equity (ROE) and Price Earnings (PE) Ratio are shown for 2019-2020. Analyst estimates are shown for later years MarketScreener.com

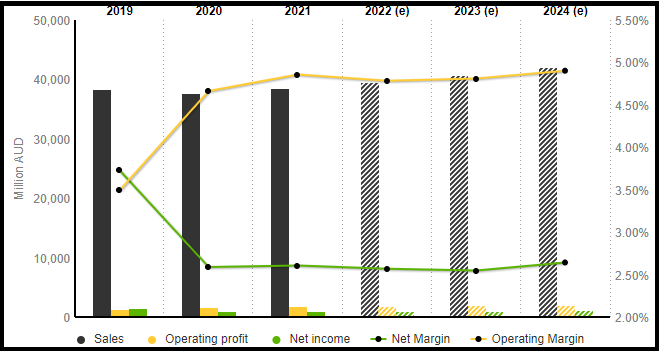
The Return on Equity (ROE) for this retail business is pretty impressive and, the PE Ratio would be pretty good for a growth company – but the Income Chart below reveals that Coles is not really a “growth” company – so the expectation is that the PE Ratios should be much lower, in the early 20’s or below would be the Slack Limits for slow growth companies.

Income statement for Coles Group (COL.ASX) showing a very gradual increase in projected income – Compare this with the Alphabet chart above – from MarketScreener

The income chart shows some pretty shallow growth and the slow earnings per share (EPS) growth makes the Coles Group something that Slack Investor would not usually be interested in. But, I go to Coles Supermarket at least twice a week and I actually like going there as a company part owner. Coles is in the “stable income” section of the Slack Portfolio rather than “Growth”. Even if the worst of times was thrust upon us and there was a recession in the next few years, a business like Coles will keep on performing. I would much rather put up with the price fluctuation of shares and have my money in a business like this at a projected yield of 3.5 – 4% p.a. than have Slack Dollars tied up in cash for 2 years in a Big 4 bank term deposit at 0.3%.

August 2021 – End of Month Update

Slack Investor remains IN for Australian index shares, the US Index S&P 500 and the FTSE 100.

There were significant rises in all followed markets (S&P 500 +2.9%, and the FTSE 100 +1.2%). The Australian stock market is also in record territory (ASX 200 +1. 9%). This is all happening during extensive COVID-19 related lockdowns in the populous South Eastern part of Australia.

Slack Investor is normally relaxed about most things, but I am moving to the edge of my couch and starting to get ready for action. Looking at the monthly charts for all the indexes, in these boom times, the index prices have been getting too far ahead of my stop losses for comfort. I have tightened up my rules for adjusting stop losses upwards.

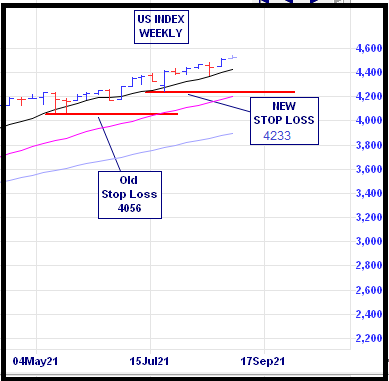
All Stop Losses are live and are being moved upwards every month if the index price exceeds the stop loss by 10% or more. All Indexes have got this treatment this month – It is sometimes difficult to work out where to put the stop losses on the monthly chart. I usually go to the weekly charts and find a minimum on the weekly price range that is within 10% of the current price (see below). If the stock price is below the stop loss at the end of the week – I will usually sell at the next opportunity.

The weekly US S&P 500 Index chart showing an upward adjustment of the stop loss from 4056 to 4233 – Thanks Incredible Charts

All Index pages and charts have been updated to reflect the monthly changes – (ASX IndexUK IndexUS Index).

FY2021 Nuggets and Stinkers and July 2021 – End of Month Update

It’s not whether you’re right or wrong that’s important, but how much money you make when you’re right and how much you lose when you’re wrong. 

George Soros

Now George knows how to make a dollar and, to his great credit, is a generous philanthropist. I am sure, like any successful investor, that George looks back at times on his investment decisions. Slack Investor looks forward to this time of year when I can reflectively analyse my greatest investing failures. Fortunately, my stinker to nugget ratio was good this year.

The percentage yearly returns quoted in this post include costs (brokerage) but, the returns are before tax. This raw figure can then be compared with other investment returns. I use Market Screener to analyse the financial data from each company and extract the predicted 2023 Return on Equity and 2023 Price/Earnings Ratio on the companies below. This excellent site allows free access (up to a daily limit) to their analysts data once you register with an email address.

Slack Investor Stinkers – FY 2021

Growth stocks (High Return on Equity >15% and increasing sales) are fantastic companies to associate with as they are growing and hopefully, their earnings per share, are growing also. The downside to this is that these companies are usually sought after in the stock market and command high prices in relation to their current earnings because the “future earnings” of the company are priced into the current price. This gives them a high PE Ratio. Whenever there is a future earnings revision, or a stutter in growth, there is usually a dramatic drop in price.

Slack Investor has a look at his stocks every weekend on a free chart program (Thanks Incredible Charts!). I actually pay a small amount to get the chart data early in the morning. Both of my “stinkers” this year were actually “nuggets” from last year. For FY 2020, Appen +58% and A2M +26%. Such is the cyclic nature of some growth stocks.

Appen (APX) -24%

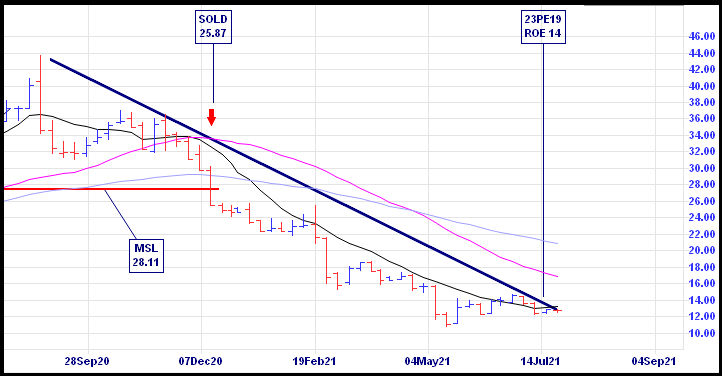
APX (2023 ROE 14%, 2023 PE 19) remains a company that puzzles me “the development of human-annotated datasets for machine learning and artificial intelligence”. The company has had a few problems due to COVID-19 and a hit to its underlying profit and increased competition. Slack Investor got out late last year at $25.87 as the weekly chart moved below the stop loss at $28.11. However, this represented a loss of 24% for the financial year.

The downward trend marked by the thick blue line is setting up niciely for one of Slack Investors favourite chart trading patterns – “The Wedgie”. When the share price punches through a downward trend line of at least 6 months … and the fundamentals are right, Slack Investor is interested. Given the forward PE for 2023 is a relatively low 19 – I might have another crack at this once the price has poked above the blue wedge line.

A2 Milk (A2M) -21%

A2M (2023 ROE 17%, 2023 PE 23) sells A2 protein milk products to the world. The actual benefits of the A2 only protein seem to be limited to easier digestion. Long term independent studies with large data sets are still in the works … but the marketing skill of this company is undisputed. COVID-19 brought big changes to sales with the collapse of the “daigou” market and worries about China trade sanctions. Slack Investor sold about half way through the downtrend – but not before taking a hit for the team.

Slack Investor Nuggets – FY 2021

A great benefit of investing in companies that have a high Return on Equity, and with a track record of increasing earnings, is that they sometimes behave as “golden nuggets”.

Codan (CDA) +161%

Codan - Niramar

What a company! Codan is a technology company that specializes in communications and metal detecting. It has made a major US acquisition this year and paid with cash. Sales are up and predicted to keep increasing. The high 2023 ROE 32%, and relatively low 2023 PE 24 (for a growth company) makes me think there will be more price growth over the next few years – I will try and top up my position this year on any price weakness.

Alphabet (GOOGL) +61%

(GOOGL – 2023 ROE 23%, 2023 PE 23) The Alphabet list of products continues to grow. I use a ton of Alphabet products every day and the company is growing fast into the cloud with cloud computing revenue jumping 46% in the March quarter. There are a few regulatory problems coming up with the US Justice department claiming that Google’s actions harmed consumers and competition. There is also the ongoing work of G7 nations trying to make international tech companies pay their rightful share of tax on revenues in each country.

Despite this, if there is one company that Slack Investor could invest in and then pay no attention to for 10 years, and still sleep well, … it would be Alphabet.

REA Group (REA) +59%

File:REA Group logo.svg - Wikipedia

The owners of RealEstate.com.au. which is the go to portal for house selling and buying (REA – 2023 ROE 38%, 2023 PE 44). The group has just completed an acquisition of Mortgage Choice and picked up a big chunk of a Mortgage software company. This expanding of the business must be good. 65% of Australia’s adult population are checking the site every month looking at property listings and home prices. However, the 2023 projected PE is very high (44). Using the Slack Investor bench marks, suggests the stock is expensive at the moment.

Integral Diagnostics (IDX) +37%

Integral Diagnostics | Medical Imaging Services | Australia | New Zealand

This medical image company (2023 ROE 16%, 2023 PE 24) provides diagnostic image services to GP’s and specialists. IDX seems to be getting a few tail winds with an ageing population and more demand for their MRI, CT and PET scans.

Macquarie Group (MQG) +36%

Commonwealth Bank Macquarie Group Finance Westpac, PNG, 1800x600px,  Commonwealth Bank, Australian Dollar, Bank, Brand, Finance Download

Macquarie is a complex business(2023 ROE 14%, 2023 PE 17) with a range of banking and financial services, and plays in global markets and asset management. The latter division looks for undervalued companies. Despite COVID-19, profits are increasing. The management seem to know what they are doing – Slack Investor remains a fan.

Betashares Global Robotics And Artificial Intelligence ETF (RBTZ) +36%

RBTZ ASX | Global Robotics & AI ETF | BetaShares

This ETF tracks the megatrend of robotics and artificial intelligence. Although the PE ratio is a bit high (2021 PE Ratio 37), this is a disruptive sector that should make gains against existing industries with the advantage of technology against rising labour costs.

Most honourable mentions to those other companies that returned over 20% for the tax year. Cochlear (COH) +34%, BetaShares Nasdaq ETF (NDQ) +33%, VanEyk MOAT ETF (MOAT) +32%, Vanguard International ETF (VGE) +29%, BetaShares HACK ETF (HACK) +31%, Vanguard Asia ETF (VAE) +28%, BetaShares QLTY ETF (QLTY) +25%. To these companies, I am grateful for your service.

Slack Investor Total SMSF performance – FY 2021 and July 2021 end of Month Update

A great year for shares, Chant West reports Super funds have delivered their strongest financial year result in 24 years, with the median growth fund (61 to 80% in growth assets) returning 18% for FY21. The FY 2021 Slack Investor preliminary total SMSF performance looks like coming in at around 22%. The 5-yr performance is a more useful benchmark to me – as it takes out the bouncing around of yearly returns. At the end of FY 2021, the Slack Portfolio has a compounding annual 5-yr return of over 21%.

Slack Investor remains IN for Australian index shares The FTSE 100 had a flat month (-0.1%) but rises in the US Index S&P 500 (+2.3%) and the ASX 200 (+1.1%).

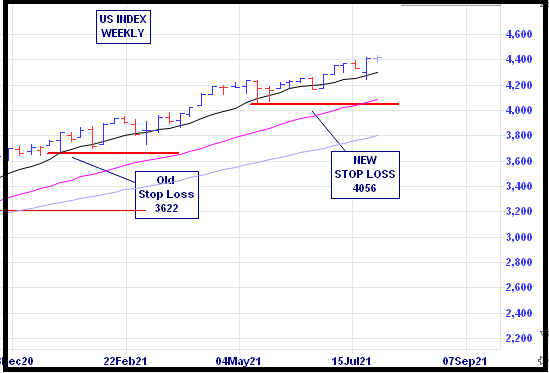
The party with the US S&P 500 just keeps on going. As the S&P 500 has moved more than 20% higher than its stop loss on the monthly chart, I have adjusted the stop loss upward to 4056 from 3622. It is difficult to decide where to put the stop loss on the monthly US Index chart. In these cases, I go to the weekly chart and look for a “sensible place” to put the stop loss coinciding with a minimum value (dip) on the chart. The current stop loss is 8% below the end of month price.

US Index (S&P 500) weekly chart showing a moving up of the stop loss this month.

The US economy entered a recession in February 2020 and has now entered a phase of expansion (since June 2020). Slack Investor is nervous though and has his stop losses live for all Index funds. I will be checking these charts on a weekly basis for breaches of the stop loss.

All Index pages and charts  have been updated to reflect the monthly changes – (ASX IndexUK IndexUS Index).

Always Watching

Photograph: Elle Hunt/The Observer

Slack Investor is not known for his fast work … and have often taken the couch when action was probably needed. There are some stocks that I will hold for the long run, and their weekly charts are not of big concern to me. However, about half of my portfolio is on a weekly watch – I review the charts on a weekend and cast the Slack Investor jaundiced gaze over each stock that I own (Thanks Incredible Charts!)

“You can observe a lot by watching”

Yogi Berra – American Baseball Legend and Master of Tautology

I do have some routines though …

Daily

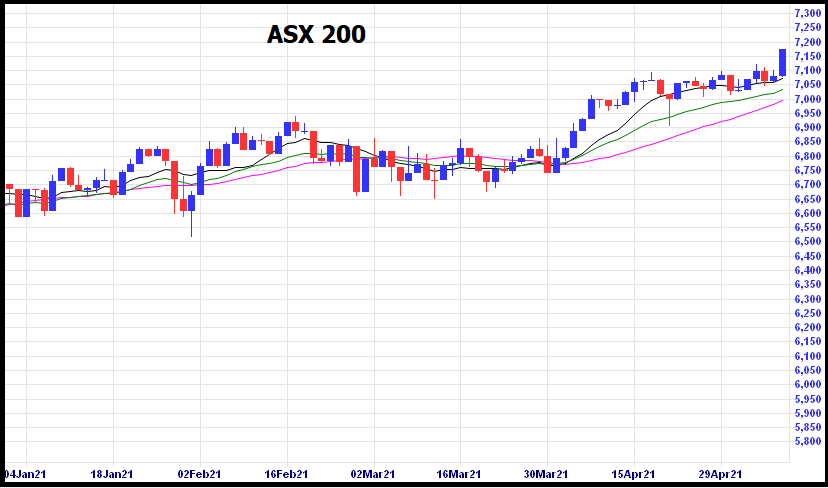
This is the least satisfying timescale and, if I could successfully train myself to ignore this daily oscillation of my investments – I would. The reason to avoid daily swings of the share price is that I have absolutely no idea about whether the price of a stock or index will go up or down on the next day – the share price is determined by others! In the chart below, in the first 7 days shown, the daily index went down, down, up, down, down, up, up, etc – monitoring daily prices can be frustrating!

ASX 200 Daily “Candlestick Chart” showing 6 months of index values since January 1 ,2021. The Red candles show a day when the value went down, and the Blue candles indicate a day when the index price went up.

I have to admit that I follow my investments every few days through a portfolio in Yahoo Finance and will download prices to my accounting software – the free Microsoft Money Sunset International Edition available at the most excellent Ameridan’s Blog. I download share prices into Microsoft Money with MS Money Quotes with a 10 USD lifetime licence. In the USA, Personal Capital is  recommended. 

I am happy to say that, when on holiday, or busy, I have no need to monitor on the daily timescale. Regardless, no decisions are made on this daily basis.

Weekly

Weekly is where the “rubber hits the road” for Slack Investor – and I look forward to my weekly sessions with my portfolio. I set aside an hour on the weekend to make sure my portfolio prices are updated and the charts are reviewed. The weekly time scale smooths out a bit of the volatility and I then open up Incredible Charts to scroll through my portfolio.

Incredible charts offer a free month sign up and then $9.95 per month for access to worldwide updated delayed charts daily from 6pm Australian time. This package is not in “real time” and does not suit a day trader. But for an investor on my slower time scale, it is very good value. These charts open up the whole world of technical analysis as it allows you to monitor trends in your stocks and mark in trend lines and stop losses.

I have always used the weekly charts to make decisions on buying a company – looking for a momentum shift in the trading using the Directional Movement System. I also like to trade a “breakout”, or a “wedgie”

Monthly

This is the timescale when I am most happiest and would like to make decisions just every month. After a life of work where decisions were a constant grind – It is a gift not to make decisions!

It is still my aim to make selling decisions monthly – but things seem a little precarious lately and, for now, I am on a weekly decisions cycle for selling. The sell happens when a stock price finishes below my stop loss at the end of the week/month (see Technical Sell below).

Yearly

This is the “Look at yourself in the mirror” period where Slack Investor does the evaluation of his portfolio performance against benchmarks at the end of each financial year. Although the financial year ends at June 30, it usually takes until the middle of August for me to get my final results and benchmarks together. I present my results at the annual Financial Year Results post.

Special Occasions Selling

Slack Investor is in one of those right now and he has to free up some cash to by selling some shares. I like to do things a bit methodically and here is my process for a sell.

Technical Sell

This is my first port of call. Technical Analysis uses charts and trends and I have been watching the charts for the past 4 weeks for a technical sell signal in my portfolio. For me, this happens when the stock price falls below the pre-determined stop loss that I have set. I will then try to sell at the start of the next week/month. My rules are not rigid here, if the stock starts to rebound after I have made my sell decision, I might stick with it for a little while longer.

Another technical signal is when a stock loses its momentum – but this is a more subjective signal than when a stock simply moves below a line.

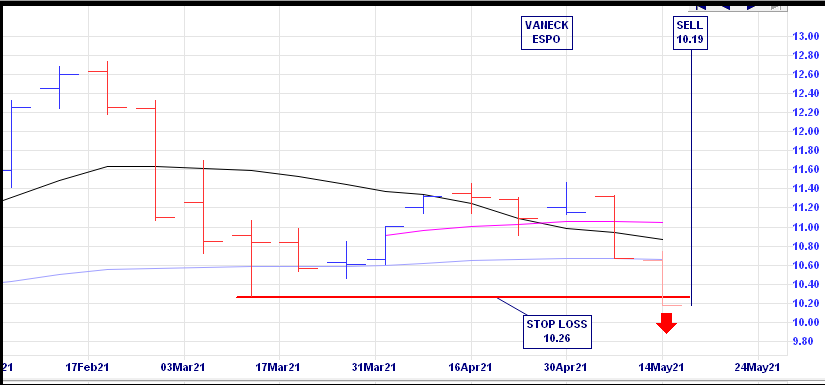
Slack Investor bought into ESPO in October 2020 at $10.39 and sold this week at a small loss $10.19. The stock didn’t grow like I thought it would – but that’s fine. I like the concept of this ETF but I am happy to be out for now and look forward to be getting back in when a strong upward trend establishes itself.

I was also able to exit on a technical sell for the Betashares ASIA ETF and I am not sure what is going on here as I thought the tailwinds for this sector were good. Small profit this time and will get back in if the trend changes.

Weekly chart for the VanEck ESPO ETF showing a breach of the stop loss – Incredible Charts.

Fundamental Sell

Fundamental Analysis revolves around trying to determine the real value of a stock by looking at its financial data (e.g, Price/Earnings ratio, Return on Equity, Debt, etc) over time and, in reference to its competitors. This is a much more complicated process.

If Slack Investor can’t find a technical sell, I look for a fundamental sign. I will list all of my sellable stocks (Shares that I don’t hold for “the long run“). The first step is to get some financial data on each company from the very good Market Screener then put them in a table and hope that something stands out as a sell. A sell signal might be a trend of falling earnings, increasing debt, or decreasing Return on Equity (ROE). I also get nervous about a stock if its predicted (+ 2 years) Price Earnings (PE) ratio goes over 50. Fortunately, I didn’t have to resort to any fundamental analysis this this time … and this approach probably needs a post in itself.

In the meantime, like my pumpkin friend … always watching …

R&B? … No, R&D!

James Brown Performing At The Apollo by New York Daily News Archive
Mr James Brown (1933 – 2006) – an R&B, funk, and soul music legend – “The hardest thing about being James Brown is I have to live. I don’t have no down time” – Image from Rolling Stone

Slack Investor might be showing his age here … but when I think of R&B (Rhythm & Blues), it’s not Drake or The Weeknd that I think of, its “The Hardest Working Man in Show Business” that comes to mind. James Brown had a bit of a trouble in his life but there is no denying his talent and influence – 4 minutes of his genius can be seen here.

The one thing that can solve most of our problems is dancing

James Brown

But I digress, when the dancing is finished, R&D (Research and Development) is another thing that gets Slack Investor attention – especially when it comes to finding a company to invest in. Lets have a look at the world top ten spenders on Research and Development. This quality list of companies is peppered with representation from the tech, pharmaceutical and (electric) car sectors. One of the ways that a company can keep growing is to develop an upstream pipeline of products through research, patenting, and testing. It may take many years before they are released so the companies must be patient and long sighted – not all products in the pipeline will be a success.

Ranking of the 20 companies with the highest spending on R & D in 2018 (in billion U.S. dollars) – From Statista.com

I don’t often read company annual reports as I lack forensic accounting skills and they are usually thick and masterpieces of obfuscation. But, I am usually very impressed when, in the overview, a decent slab of profits are going back into R&D. Slack Investor would rather invest in companies that are constantly innovating, and investing in future products. Only some of these products will yield fruit, but you would hope that these high spending R&D companies would generate bigger profits than those that don’t. Although, this is not always the case! In some cases, the world of R&D can be full of questionable spending, uncertain results.

Even though R&D spending does not guarantee profitability and ever increasing stock prices, there is a correlation- future earnings are positively associated with current R&D.

Commonwealth Serum Laboratories (CSL)

Despite a 20% price fall in the CSL share price in the past 6 months, there is no thought of Slack investor selling this great company. It is one of my “Long Run” stocks. I have often written about share prices fluctuating above and below a “fair value” for a stock . This is just a characteristic of share investing – depending on the mood of the market.

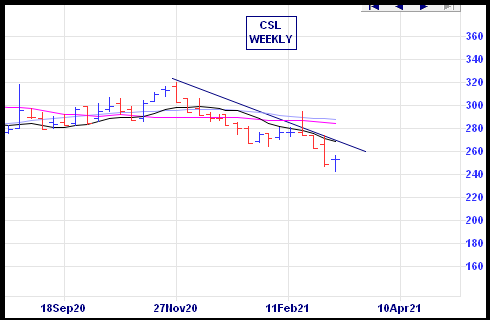
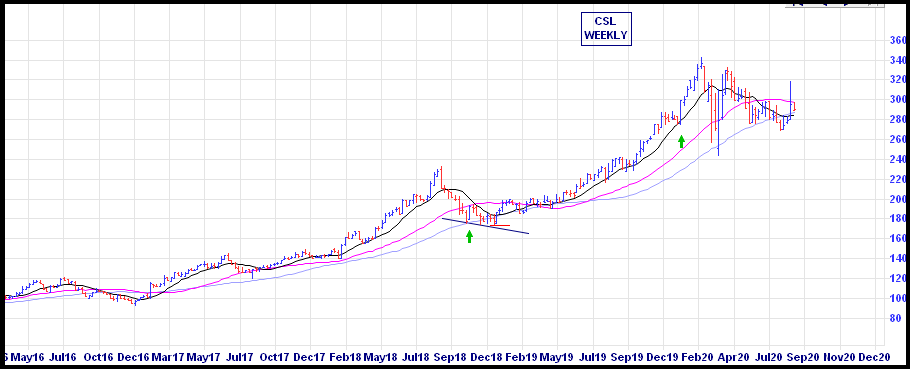
A weekly chart of the CSL share price showing a 20% fall in the last 6 mth -From incrediblecharts.com

CSL is not in the world R&D big spending league in dollar terms. But, in Australia, it is one of our best R&D spenders with almost a billion dollars (US) per year. This amount is very high as a percentage of its revenue, in an environment where a typical manufacturer will spend 1-2%, CSL spending on Research and Development is between 10 to 11 per cent of turnover. Slack Investor thinks this is a good thing and is happy that CSL is occupying a big chunk of his portfolio.

CSL have many products in the R&D pipeline and have a good track record of converting at least some of these products into successful earners. Some other analysts agree and have a target price of $310 on the stock. With current pricing at $253.26 (12 Mar 21) – this smells good!

I taught them everything they know, but not everything I know

James Brown

That’s right James … “Hit it”

Know when to Fold’em … and October 2020 – End of Month Update

“He said, “If you’re gonna play the game, boy
You gotta learn to play it right …

You’ve got to know when to hold ’em
Know when to fold ’em
Know when to walk away
And know when to run

Excerpt from “The Gambler” written by Don Schlitz and recorded by  Kenny Rogers.

Kenny makes this sound easy, but selling shares is tricky and Slack Investor does not always get this decision right – and I’m OK with that. The Slack Investor art is just to attempt to get things “mostly right”. There are some stocks that I will hold for the long run, and their weekly and monthly charts are not of a big concern to me. However, about half of my portfolio is on a weekly or monthly watch – I review the Incredible Charts output for each of these stocks on the weekend or at the end of the month.

I pay particular attention when the stock price falls below my stop loss on the monthly chart. In hindsight, I should have been more alert back in August. A2M is a good company with a unique product and has shown excellent growth in the last 5 years. However, earnings season is always a bit volatile for the growth sector.

The FY20 results showed a record profit but there were some question marks about FY21. The real catalyst for a downward price move was the later release of an acquisition and that members of the board and senior executive team had sold over 1.8 million shares. Selling by insiders is not always bad, as the executives might just be diversifying their portfolios – However, in this case, the market took a dim view. Overall, the A2 Milk Company Ltd (ASX: A2M) share price has slumped more than 15% since the release of its FY21 outlook.

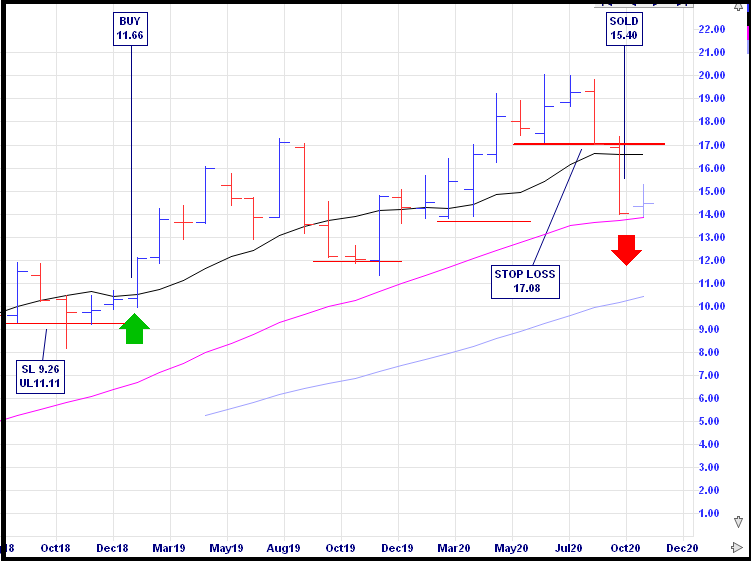
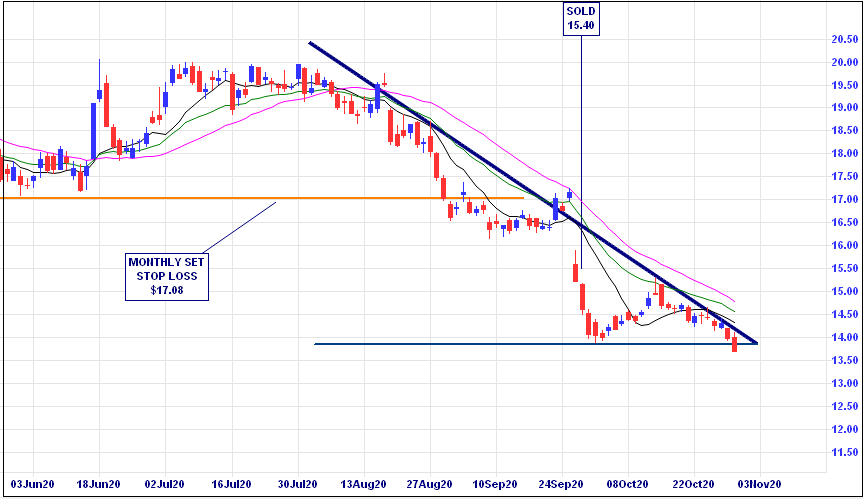
Monthly Price chart of The A2 Milk Company (A2M) showing a buy in at $11.66 in January 2019 and a sell at $15.40 at the end of September 2020. I took the opportunities to gradually creep up my stop loss from the original value of $11.11 to $17.08 – From incrediblecharts.com

I am not known for my fast work and have tended to take the couch rather than make a decision in the past. However, in the spirit of incremental improvement, I didn’t wait till the end of the month and pounced on the sell button on the day that the A2M fell more than 10%, 28th September 2020.

Daily Price chart of The A2 Milk Company (A2M). Slack investor sold on the day news leaked out about insider selling on September 28 – From incrediblecharts.com

I am not put off A2M forever. The end of month share price was $13.67. There is now a reasonable case for re-investing given the growth pathway beyond 2021 and the Market Screener , relatively low, 2023 predicted PE of 19. There has now been a downward trend of 3 months and Slack Investor’s favourite pattern has started to emerge … “The Wedgie”. If there is a break above “the Wedgie”, I will reinvest and hope the share price resumes an uptrend.

” … the secret to survivin’
is knowing what to throw away,
and knowing what to keep …”

Further … from The Gambler

Ooooh Kenny … the secret to investing is simple to describe, but harder to do … but you knew how to tell a good story!

October 2020 – End of Month Update

Slack Investor remains IN for Australian index shares, the US Index S&P 500 and the FTSE 100. However, the US and UK charts are hovering close to their monthly stop losses.

The state of recent COVID-19 surges in Europe and the US seems to be worrying punters and monthly falls were recorded in these markets (S&P 500 -2.8%; FTSE 100 -4.9%). In Australia, the governments are handling the response to the virus in a constructive fashion and the ASX 200 rose 1.9%.

On the ASX 200 Index monthly chart, a new “Higher Low” was established and this gave me the opportunity to move up my monthly stop loss to 5763.

The US economy entered a recession in February 2020 and Slack Investor has his stop losses live for all Index funds.

All Index pages and charts  have been updated to reflect the monthly changes – (ASX IndexUK IndexUS Index).

Stocks for the “Long Run” and August 2020 – End of Month Update

This image has an empty alt attribute; its file name is virgin-ground.jpg

… It’s going to rain and it’s going to blow 

But it’ll be all right, it’ll be all right, it’ll be all right in the long run … 

Excerpt from the “Long Run” lyrics by Redgum (John Schuman) released in 1980.

Slack Investor looks at the shares that he owns occasionally and has a bit of a tinker. Earlier this year I had a portfolio review that saw a dumping of managed funds and high fee ETF’s. I also made an attempt to exit shares that I thought might be severely affected by gloomy economic times. However, sometimes it is good to lift the sights to the horizon and forget about the short term pricing of the market.

“Over the 210 years I have examined stock returns, the real return on a broadly diversified portfolio of stocks has averaged 6.6 percent per year.”

 Jeremy J. Siegel, Stocks for the Long Run

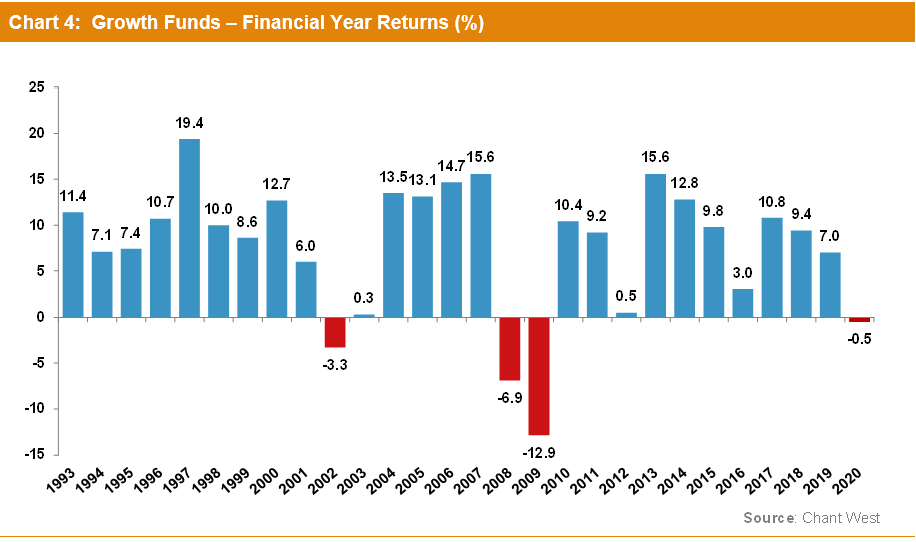
Although the last financial year was a bit bleak for the median of super growth funds (-0.5%), Slack Investor has been around long enough to know that the gloomy times are periodic, and that, “In the Long Run” shares are a very good investment – as can be seen on the 28-year performance chart below.

This image has an empty alt attribute; its file name is 2020GrothFundsChart-4-MR-Jul20.png
The Performance of the median Australian Superannuation Growth Fund over the past 28 years. A “Growth Fund” is defined to have between 60 – 80% of Growth Assets – From Chant West

During my portfolio review I realised that over half my portfolio is in several companies that I would never sell – unless circumstances changed greatly! These companies usually have great management, a plan for growth, and an established track record in increasing Earnings per Share (EPS). Prices may go up and down, but great companies ride though all this and figure out a way to keep growing.

Coles (COL)

COL (2022 ROE 36%, 2022 PE 23) – With around 30% of all supermarket sales, Coles is one of the lucky retailers classified as essential and is getting a boost from COVID-19. This boost wont last forever, and, I cant see any big growth ahead. But, I can’t see myself selling this company as I visit it twice a week to “kick the tyres” and they are doing a good job. There is also the perverse satisfaction of knowing that if I am waiting at the checkout for a time … that it must be good for the bottom line!

Altium (ALU)

ALU (2022 ROE 32%, 2022 PE 56). The PE ratio of Altium has it priced for big future growth and it would be a stretch to buy it now. But this printed circuit board designer is a company for the times and it has a well defined, and so far achievable, global growth strategy.

Although relatively expensive (Forecast PE 56), Altium has no debt, a decent cash balance and keeps growing its profit margin and market share. In 2019, Altium spend 14% of its revenue on Research and Development – This is a commitment to growth in a changing industry.

Commonwealth Serum Laboratory (CSL)

CSL (2022 ROE 29%, 2022 PE 38) – Slack investor first bought into this company 10 years ago at around $30 and I have had the good fortune to add to my holding (at much higher prices!) along the way. CSL is expensive at a forecast PE of 38, but I can remember at my initial purchase in 2010, I thought it was expensive then! With great companies, sometimes you just have to hold your nose and jump in – they are rarely cheap! If it wasn’t already such a large part of my portfolio, Slack Investor would buy more CSL if I could get it below $300. The price chart below is reassuring.

Weekly chart of CSL over 5 years – From Incredible charts.com

Alphabet – (GOOGL)

(GOOGL – 2022 ROE 18%, 2022 PE 24). Alphabet is listed on the US-based NASDAQ exchange and needs an International Broker to invest directly (Commsec will set you up for a cost of 0.31% for trades above USD $10,000). For a growth company, Alphabet is not outrageously expensive with a forecast Price to Earnings Ratio of 24.

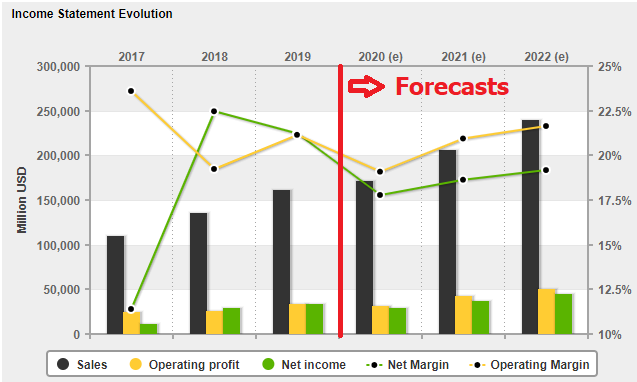
One of the first charts I look at before buying a stock is how its income has evolved – Thank you Market Screener. The GOOGL income chart below is typical of how I like to see them. A steady track record of 3 years growth of sales/income, and then a plan to grow income over the next 3 years.

Income and Forecast Income for Alphabet (GOOGL) – from marketscreener.com

A common theme amongst companies that I am reluctant to sell is their willingness to invest in new projects that might feed back into the earnings of the company. Alphabet spent a staggering US$ 16.2 Billion on research and development – 14.6 % of its revenue in 2018

BetaShares NASDAQ 100 ETF – (NDQ)

(NASDAQ Index – Current ROE 14%, Current PE 23) – Australian exposure to this index comes at a cost (MER of 0.48%) through the NDQ Betashares ETF, but Slack Investor thinks this is well worth it – my costs in owning GOOGL directly are around 0.43%. This ETF is Slack Investors favourite way to own International Tech stocks. With NDQ, you get exposure to 100 of the world’s best tech companies. The NASDAQ Index is a collection of growing household tech names e.g. Apple 13.9%, Microsoft 11.2%, Amazon 10.9%, Alphabet 7.2%, Facebook 4.5%. With a forecast PE of around 23, it still looks reasonably priced if tech world keeps growing.

August 2020 – End of Month Update

Slack Investor remains IN for Australian index shares, the US Index S&P 500 and the FTSE 100. Rises all round for Slack Investor followed overseas markets this month ( ASX 200 +2.2%; FTSE 100 +1.1%) In Crazy Brave USA, the S&P 500 had a monthly rise of an astonishing 7.0%.

At the end of August, the US S&P 500 had a 12-month trailing PE Ratio of 30.09 . The mean and median values are 15.81 and 14.83.

In the real world, the US economy entered a recession in February 2020 and Slack Investor has his stop losses live for all Index funds.

All Index pages and charts  have been updated to reflect the monthly changes – (ASX IndexUK IndexUS Index).

FY2020 Nuggets and Stinkers and July 2020 – End of Month Update

From Credit24

Just get things mostly right

Slack Investor 2020

Not that I think Slack Investor is worth quoting – but I searched high and low for a quote that expressed the Slack aim. The great Warren Buffet got closest to the sentiment with “You only have to do a very few things right in your life so long as you don’t do too many things wrong.” – but I used this quote last year!

It is good for me to have a yearly display of my failures. It reminds me of the bumbling path of Slack Investor in the pursuit of financial independence. As for the nuggets, just get the foundations right … and luck might intervene.

“You can never be a first class human being, until you have learnt to have some regard for human frailty.”

Abhijit Naskar, Conscience over Nonsense

The percentage yearly returns quoted in this post include costs (brokerage) but are before tax. This raw figure can then be compared with other investment returns.

Slack Investor Stinkers – FY 2020

From Pixabay

The Slack Investor Portfolio comprises of (mostly) high Return on Equity (ROE>15%) and high Price to Earnings (PE) ratio stocks. Historically, these companies are quite volatile as they are priced to account for future growth. If there is an earnings revision … or a change that would affect future earnings, then the price of the share usually plummets. Slack investor accepts that stinkers are just part of life when dealing with growth stocks.

Slack Investor has a look at his stocks on a chart (Thanks Incredible Charts!) every weekend – and, I eventually get the message if a stock price is moving lower and take the exit.

Rhipe (RHP) -22%

After being a star performer last year … this software technology company took a dive in share price this time last year. Slack investor bailed out in February 2020 – but not before taking a few licks.

Treasury Wine Estate (TWE) -13%

In Wine is Truth .. and this became evident at the start of this year as the global wine oversupply made it difficult for Treasury to raise prices. Their attempts to break into the US market were floundering and the stock price took a tumble. Slack investor “cleared the decks” in February 2020.

Centuria Industrial REIT (CIP) -11%

Centuria invests in industrial properties and was a victim of my COVID-19 portfolio trim. I sold out in April 2020 on my fears that the virus would affect tenancies. It seems that I took flight a little early as the stock price has rebounded 17% since I sold – Ah well … that’s investing!

Costa Group (CGC) -11%

Costa is agricultural company that grows and distributes mushrooms, berries, tomatoes, citrus, avocados and heaps more. My involvement with this company unfortunately coincided with a 2-year price slide due to a series of farming misfortunes. I parted ways with Costa in October 2019. Slack Investor held this stock for far too long. However, owning this stock taught me a lesson – avoid business that are “price takers” – where the cost of goods is set by seasonal factors or competitors. The best businesses have an exclusive product that people want and there are barriers to entry for other competitors.

Slack Investor Gold Nuggets – FY 2020

The other side of investing in companies that have a high Return on Equity, and with a track record of increasing earnings, is that you can sometimes expose yourself to some pleasant surprises. The Return on Equity (ROE) and forward Price Earnings (PE) ratio values quoted below are “forward looking” and are analyst predictions for the year 2022. They were extracted from the excellent Market Screener site. These ratios are just predictions, but Slack Investor finds them very useful.

Appen (APX) +58%

APX (2022 ROE 19%, 2022 PE 32) remains a company that I don’t really understand but after taking profits and selling last year, I bought back in during November 2019 after a price fall and then a breakout from a “falling wedge”. Another excellent year for this machine learning and artificial intelligence company – Ignorance can be bliss!

Commonwealth Serum Laboratory (CSL) +31%

CSL (2022 ROE 31%, 2022 PE 32) is now the largest company on the ASX. Their blood products and expertise in gene therapy and vaccinations are used worldwide and there are projected increasing sales. Driving this fabulous company is a commitment to innovation. Spending on Research and Development is in the target range of 10 to 11 per cent of turnover – in an environment where a typical manufacturer will spend 2%. It is no coincidence that this company is doing well.

Alphabet (GOOGL) +30%

The Alphabet list of products is large … and getting larger. Everyday I use Google, GoogleMaps, gmail, android devices and YouTube. Alphabet (GOOGL – 2022 ROE 19%, 2022 PE 32) has just announced a quarterly rise in profits of 22% as it moves deeper into peoples lives. Alphabet and the other FAANG Stocks have been acting a bit like pirates in the multinational tax world. There are some regulatory risks on the horizon though. Nations are rightfully demanding a share of these tech giants revenue as taxation. There is also a bit of “pushback” by governments and media companies who want a fair share of revenue generated by their content. However, on the plus side, profits should continue to grow as advertisers are spending more to reach an expanding number of customers that are engrossed with their smartphones and YouTube.

A2 Milk (A2M) +26%

A2M (2022 ROE 28%, 2022 PE 29) sells A2 protein type branded milk, infant formula and other related products to the world. The actual benefits of the A2 only protein have been indicated in small studies but longer-term studies with larger sample sizes are needed. However, in the mean time, sales are increasing and the share price is still going north.

Honourable mentions for Slack Investor Portfolio stocks BetaShares NASDAQ Index NDQ, Integral Diagnostics IDX and BetaShares RBTZ that increased more than 15% in this financial year.

Slack Investor Total SMSF performance – FY 2020 and July 2020 end of Month Update

A tough financial year for shares through the COVID-19 financial crisis. Chant West reports the median of “growth” super funds struggled to a small loss of 0.5%. The FY 2020 Slack Investor preliminary total SMSF performance looks like coming in around 9%. The 5-yr performance is a more useful benchmark to me. At the end of FY 2020, the Slack Portfolio has a compounding annual 5-yr return of over 19%.

My wise mother used to say to me that “Self praise is no recommendation” So Slack Investor will meekly slink back to the couch and get prepared for what might be a tough time ahead in the share market. The full FY 2020 results and benchmarks will be expanded on next post.

Slack Investor remains IN for Australian index shares, the US Index S&P 500 and the FTSE 100. A mixed bag for Slack Investor followed overseas markets this month ( ASX 200 +0.5%; FTSE100 -4.4%;  S&P500 +5.5%).

The US S&P 500 has shown more resistance to gravity than the Trump hairstyle – but all parties must end some time. As the S&P 500 has moved more than 20% higher than its stop loss, I have adjusted the stop loss to 2965 from 2721.

The US economy entered a recession in February 2020 and Slack Investor has his stop losses live for all Index funds.

All Index pages and charts  have been updated to reflect the monthly changes – (ASX IndexUK IndexUS Index).

HACK

From Pixabay.com

Cripes … it seems that even cyber criminals with circuit board faces wear hoodies!

Slack Investor has had minor issues with PC viral infections over the years – these types of virus seem very benign in current circumstances. I also had a distant brush with a more organized form of cyber hacking back in 2015 with my previous employer.

“I can confirm reports that the Bureau of Meteorology suffered a significant cyber intrusion which was first discovered early last year” 

Prime Minister Malcolm Turnbull in 2016 – the ABC News

Were the Chinese after my 30 years of sea breeze wind data? Probably not. This breach triggered an injection of government funds to try and combat cyber attacks. More recently, the current Australian government is talking about a huge $1.35 billion investment to increase Australia’s cyber security capabilities, Even smaller businesses are having to invest in cyber security as technology invades our lives.

As well as worrying about cybersecurity, the COVID-19 crisis lurches on. It is not just the retailers that are suffering, In the US, major companies such as Hertz and several US airlines have recently filed for bankruptcy due to COVID-19. At the moment, many companies are drawing down on available credit, standing down their staff, delaying projects and taking advantage of government relief programs.

It will be a delicate dance by national governments trying to support the economy with limited funds until a viable vaccine is established. When they halt these stimulus programs, each company will start burning through their cash. That’s when bankruptcy cases are likely to soar and stay elevated.

… this year (2020) will easily set a record for so-called mega bankruptcies — filings by companies with $1 billion or more in debt … the number of merely large bankruptcies — at least $100 million — to challenge the record set the year after the 2008 economic crisis.

Edward I. Altman, Professor Emeritus of Finance at New York University’s Stern School of Business – from Intelligencer
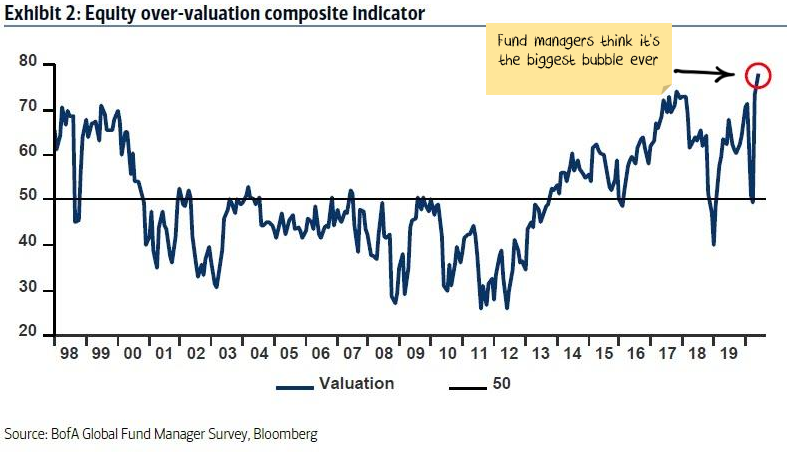
A Graph of US stocks showing valuation trend since 1998. Valuations derived from P/E ratios and comparing them to the long term mean and scaling it to 50. Companies in the US look definity over valued. Sourced from Livewiremarkets.

Slack Investor has been a big fan of some of the companies in the technology sector – as these shares are exposed to growth. This internet thing keeps increasing its grip on our lives. The recent “recovery rally” has led to stock prices being “fully” or “over valued” – particularly in the US. It is difficult to argue against this in these uncertain times as estimates for future US earnings decrease.

In an environment when many sections of the economy are in big trouble, in many ways, it might be a good time to take a bit of risk off the table and build up a little cash. However, not all tech companies are tied to the consumer economy and there will be a continuing need for individual companies and governments to make investments for the protection of their internet structures. Cyber security is now the fastest growing technology sector

BetaShares Global Cybersecurity ETF (HACK)

HACK is a BetaShares ETF that provides exposure to the leading companies in the global cybersecurity sector. Most of these companies are based in the US (87%). HACK is currently invested in 49 companies that include well known names such as Broadcom and Cisco. There are many other companies that Slack Investor has never heard of such as Crowdstrike, Splunk and OKTA – and, I assume the fund managers know much more about the sector than I do.

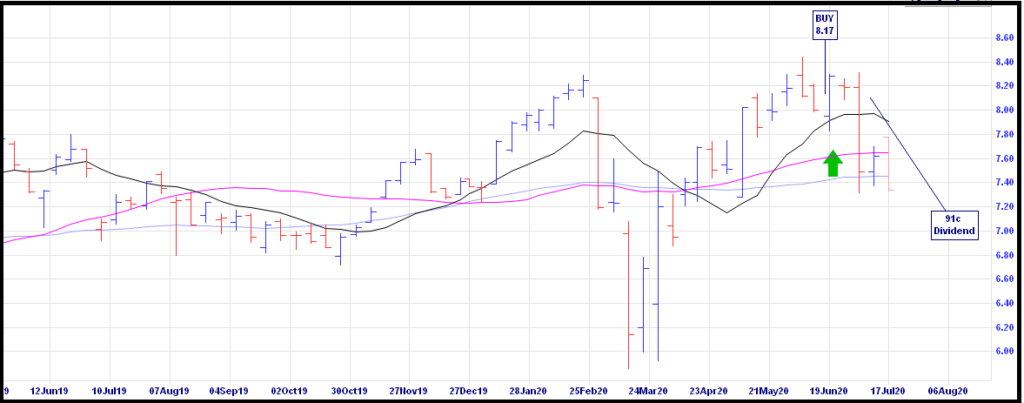
Weekly chart of HACK for the past 12 months. On June 30, 2020 there was a 91c distribution which accounts for the big price drop – incrediblecharts.com

The management expense ratio is high at 0.67%. I will “suck this up” while it is performing well. Can’t argue with past yearly HACK performance – over 1-year (+19.9%) and 3-years (+20.3%). Probably not the best time to buy, but Slack Investor can’t help himself – this must be close to a recession-proof section of the economy. I dived in last month as I can’t resist a growing industry!

Hail to the Geeks

In honour of the upcoming International Geek Pride Day to be celebrated on 25 May.

Being a geek is cool (Just ask Bill Gates!). They have rights … the top 5 rights of a Geek are:

1. The right to be even geekier.

2. The right to not leave your house.

3. The right to not like football or any other sport.

4. The right to associate with other nerds.

5. The right to have few friends (or none at all).

During the past month. Slack Investor has certainly lived the geek lifestyle and he has reflected on the magnificent gift that geeks gave to the world – technology!

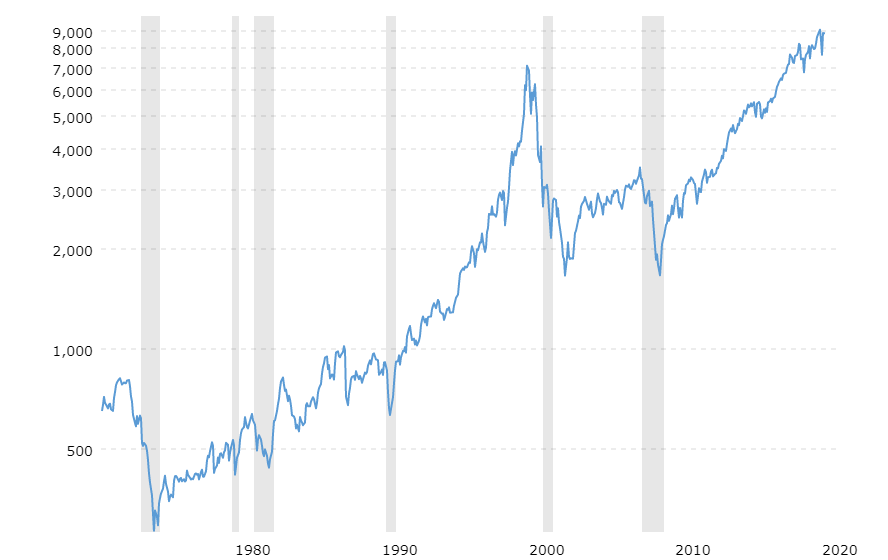
The NASDAQ (National Association of Securities Dealers Automated Quotations) is a special US based electronic stock exchange that was created in 1971 and now lists over 3500, mostly tech, companies. The top 15 companies in the NASDAQ consist of the household names below.

NameWeight (%)
MICROSOFT CORP12%
APPLE INC12%
AMAZON.COM INC10%
FACEBOOK INC4%
ALPHABET INC4%
ALPHABET INC4%
INTEL CORP3%
NETFLIX INC2%
NVIDIA CORP2%
PEPSICO INC2%
CISCO SYSTEMS INC2%
ADOBE INC2%
PAYPAL HOLDINGS INC2%
COMCAST CORP2%
TESLA INC2%
The growth of the NASDAQ composite index since 1971 – Shown on a log scale – From Macrotrends

Despite a few downturns, mostly in recessions (shaded grey columns above), being invested in technology has really delivered. Betashares, an Australian company, offers simple exposure to the top 100 companies in the NASDAQ through NDQ, their Australian listed NASDAQ ETF. Slack Investor owns some US Listed shares directly and the hassle of different currencies, maintaining a US Broking account, and filling out US taxation forms make the NDQ ETF Management Expense Ratio (MER) of 0.48% seem reasonable. Morningstar also offers a Global technology ETF TECH. Good global technology access for a 0.45% management fee.

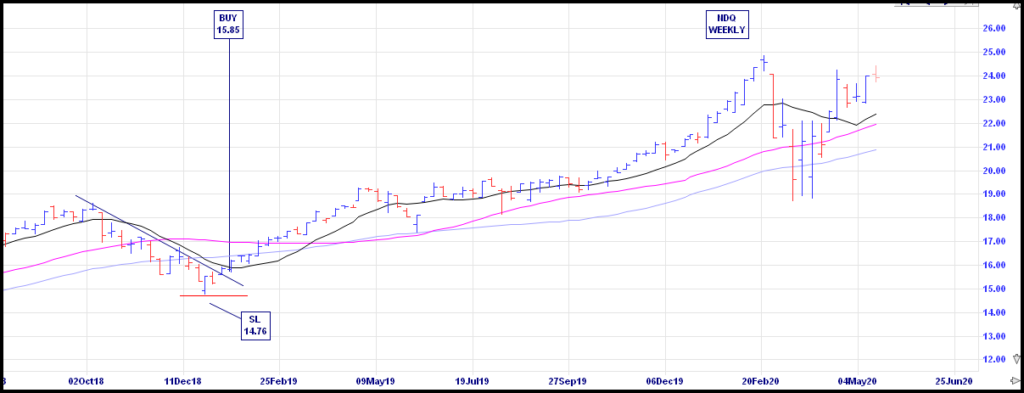
Weekly chart of Australian listed Betashares NDQ – Incredible Charts

The use of technology to connect people and develop new businesses has been well demonstrated during the COVID-19 crisis – these tech businesses are growing. Slack Investor has a big amount of technology stocks – over 35% of his Portfolio. NDQ has grown over 50% in the 18 months since the original Slack Investor buy.

One of the things that Slack Investor has learned over the decades is that a high PE is OK, providing that there is a lot of growth involved. Stamped on the little Slack Investor brain is that technology is becoming increasingly important in our lives – this sector is definitely growing.

The NASDAQ index usually has a relatively high average PE Ratio – but as of May 13 2020 it has slipped down to a very reasonable 20.55. There is also a decent trailing dividend yield of 1.73% – the dividend is showing an increasing trend.

This is not advice, as Slack Investor has no divine guidance on what will happen in the next 12 months. – but, with a 2-3 year time frame, will Slack Investor invest more into NDQ or TECH as funds become available? You bet your geekin’ life he will!