Always Watching

Photograph: Elle Hunt/The Observer

Slack Investor is not known for his fast work … and have often taken the couch when action was probably needed. There are some stocks that I will hold for the long run, and their weekly charts are not of big concern to me. However, about half of my portfolio is on a weekly watch – I review the charts on a weekend and cast the Slack Investor jaundiced gaze over each stock that I own (Thanks Incredible Charts!)

“You can observe a lot by watching”

Yogi Berra – American Baseball Legend and Master of Tautology

I do have some routines though …

Daily

This is the least satisfying timescale and, if I could successfully train myself to ignore this daily oscillation of my investments – I would. The reason to avoid daily swings of the share price is that I have absolutely no idea about whether the price of a stock or index will go up or down on the next day – the share price is determined by others! In the chart below, in the first 7 days shown, the daily index went down, down, up, down, down, up, up, etc – monitoring daily prices can be frustrating!
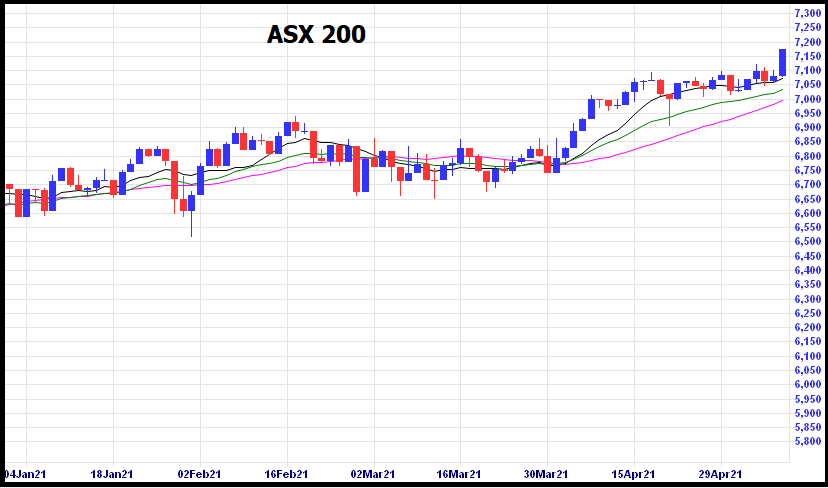
ASX 200 Daily “Candlestick Chart” showing 6 months of index values since January 1 ,2021. The Red candles show a day when the value went down, and the Blue candles indicate a day when the index price went up.

I have to admit that I follow my investments every few days through a portfolio in Yahoo Finance and will download prices to my accounting software – the free Microsoft Money Sunset International Edition available at the most excellent Ameridan’s Blog. I download share prices into Microsoft Money with MS Money Quotes with a 10 USD lifetime licence. In the USA, Personal Capital is  recommended. 

I am happy to say that, when on holiday, or busy, I have no need to monitor on the daily timescale. Regardless, no decisions are made on this daily basis.

Weekly

Weekly is where the “rubber hits the road” for Slack Investor – and I look forward to my weekly sessions with my portfolio. I set aside an hour on the weekend to make sure my portfolio prices are updated and the charts are reviewed. The weekly time scale smooths out a bit of the volatility and I then open up Incredible Charts to scroll through my portfolio.

Incredible charts offer a free month sign up and then $9.95 per month for access to worldwide updated delayed charts daily from 6pm Australian time. This package is not in “real time” and does not suit a day trader. But for an investor on my slower time scale, it is very good value. These charts open up the whole world of technical analysis as it allows you to monitor trends in your stocks and mark in trend lines and stop losses.

I have always used the weekly charts to make decisions on buying a company – looking for a momentum shift in the trading using the Directional Movement System. I also like to trade a “breakout”, or a “wedgie”

Monthly

This is the timescale when I am most happiest and would like to make decisions just every month. After a life of work where decisions were a constant grind – It is a gift not to make decisions!

It is still my aim to make selling decisions monthly – but things seem a little precarious lately and, for now, I am on a weekly decisions cycle for selling. The sell happens when a stock price finishes below my stop loss at the end of the week/month (see Technical Sell below).

Yearly

This is the “Look at yourself in the mirror” period where Slack Investor does the evaluation of his portfolio performance against benchmarks at the end of each financial year. Although the financial year ends at June 30, it usually takes until the middle of August for me to get my final results and benchmarks together. I present my results at the annual Financial Year Results post.

Special Occasions Selling

Slack Investor is in one of those right now and he has to free up some cash to by selling some shares. I like to do things a bit methodically and here is my process for a sell.

Technical Sell

This is my first port of call. Technical Analysis uses charts and trends and I have been watching the charts for the past 4 weeks for a technical sell signal in my portfolio. For me, this happens when the stock price falls below the pre-determined stop loss that I have set. I will then try to sell at the start of the next week/month. My rules are not rigid here, if the stock starts to rebound after I have made my sell decision, I might stick with it for a little while longer.

Another technical signal is when a stock loses its momentum – but this is a more subjective signal than when a stock simply moves below a line.

Slack Investor bought into ESPO in October 2020 at $10.39 and sold this week at a small loss $10.19. The stock didn’t grow like I thought it would – but that’s fine. I like the concept of this ETF but I am happy to be out for now and look forward to be getting back in when a strong upward trend establishes itself.

I was also able to exit on a technical sell for the Betashares ASIA ETF and I am not sure what is going on here as I thought the tailwinds for this sector were good. Small profit this time and will get back in if the trend changes.
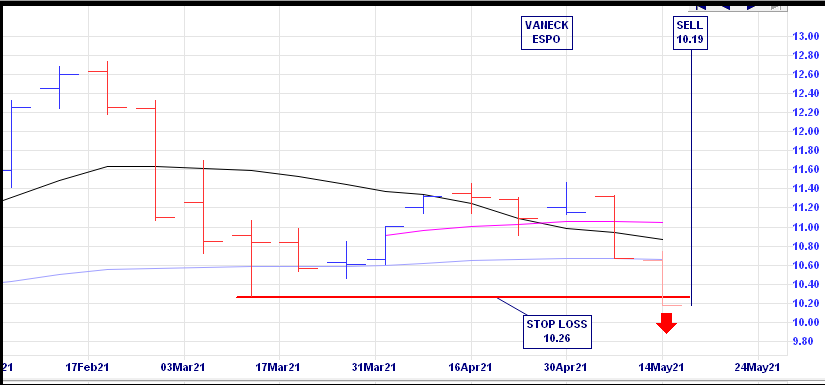
Weekly chart for the VanEck ESPO ETF showing a breach of the stop loss – Incredible Charts.

Fundamental Sell

Fundamental Analysis revolves around trying to determine the real value of a stock by looking at its financial data (e.g, Price/Earnings ratio, Return on Equity, Debt, etc) over time and, in reference to its competitors. This is a much more complicated process.

If Slack Investor can’t find a technical sell, I look for a fundamental sign. I will list all of my sellable stocks (Shares that I don’t hold for “the long run“). The first step is to get some financial data on each company from the very good Market Screener then put them in a table and hope that something stands out as a sell. A sell signal might be a trend of falling earnings, increasing debt, or decreasing Return on Equity (ROE). I also get nervous about a stock if its predicted (+ 2 years) Price Earnings (PE) ratio goes over 50. Fortunately, I didn’t have to resort to any fundamental analysis this this time … and this approach probably needs a post in itself.

In the meantime, like my pumpkin friend … always watching …

Euphoria … and April 2021 – End of Month Update

People, Football, Footballers, Group, Team Sport

“Bull markets are born on pessimism, grow on skepticism, mature on optimism and die on euphoria.”

Sir John Templeton

John Templeton (1912 – 2008) was a great investor, fund manager and philanthropist. He is best known for setting up the Templeton Growth Fund which averaged returns of over 15% per year for 38 years. Slack Investor salutes this kind of behaviour and listens when great investors say something. If Mr Templeton is right, this game should be pretty easy and we wait till the “Euphoria” sets in and the we sell … Right?

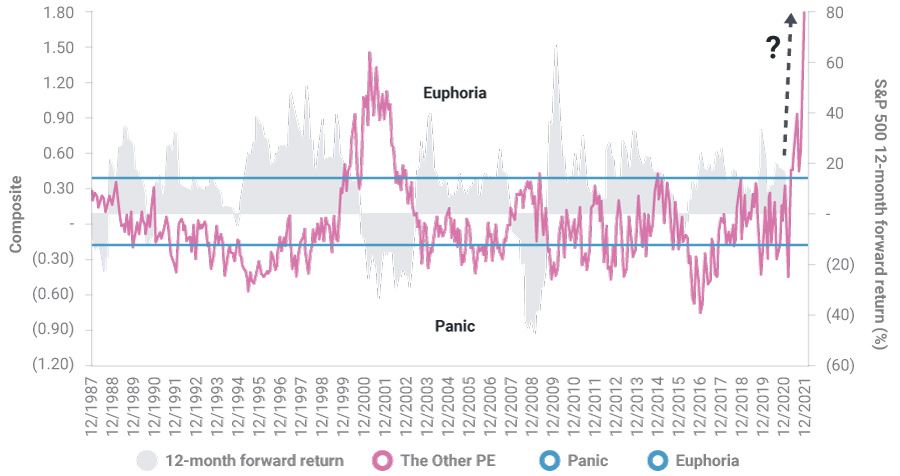
Well, according to the CitiGroup Panic and Euphoria Index , which looks at sentiment in the market back to 1950. The section from 1987 through to the start of 2021 is shown below – Euphoria is already well and truly established by December 2020. However, most markets have gone up considerably further since then!

Source: Haver Analytics, Pinnacle Data, and Citi Research – diamondportfolio.com.au – Click image for better resolution

This is a bit of a complex chart, and the grey solid columns represent the return from the US Stock market for the next 12 months (forward return) and the Magenta line is the Citibank Euphoria Index which tracks market sentiment.

Visually, it looks like whenever the Euphoria Index (LHS – Magenta) goes to a high value, there is a downturn in the next 12-month return (RHS – Grey). Citibank have defined a range (Blue Lines) where the market is operating “normally” and outline areas of Euphoria and Panic when the market is beyond that range. According to Citibank, we are in a period of Euphoria and the prospect of good returns in the next 12 months looks bleak. The Chief Economist from Citigroup, Tobias Lekovich, suggests that there is a “100% historical probability of down markets in the next 12 months at current levels.” – that proclamation was made 5 months ago.

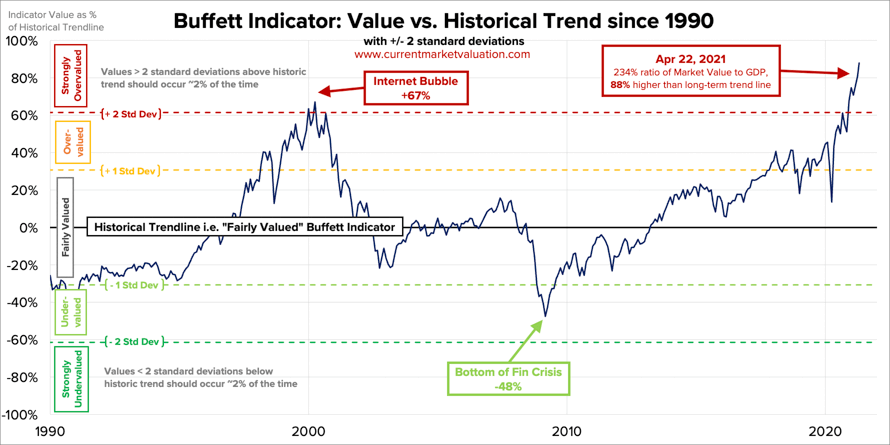
Another Slack Investor hero, Warren Buffet, talks about the ratio of total United States stock market valuation to US Gross Domestic Product (GDP). This is now known as the “Buffet Indicator” – and, although he admits to its limitations, it still is “the best single measure of where valuations stand at any given moment. At April 22, 2021 the Buffett Indicator is calculated to be 234% – the highest value since 1950. In contrast, the Australian market using this indicator is either “fair valued” or “modestly overvalued”

From Current Market Valuation – The Buffett Indicator is the ratio of total US stock market valuation to GDP – Click image for better resolution

By our calculation (the US Stock Market) that is currently 88% (or about 2.9 standard deviations) above the historical average, suggesting that the market is Strongly Overvalued

Current Market Valuation

There are a lot of current examples of “investor exuberance” in the stock markets – particularly in the US. There is no doubt that the pricing of some companies has got well out of hand. The earnings of a company are critical when I look at my investments.

Another risk is that pockets of the market at the moment appear to be speculative bubbles. You can easily tally about US$5 trillion of assets, from cryptocurrencies to Tesla, that are not underpinned by any fundamental earnings. They’re speculation. And if these bubbles were to pop, that could drag down a wider range of investments.

Hamish Douglas, Magellan Financial Group – Livewire Interview

There are a group of companies that I like that I have no intention of selling – because they have a good track record of increasing earnings and there future prospects look good – no matter what the market does in the short term. There is also about 40% my portfolio in stocks where I am not so sure of their long term prospects. It is these stocks that I will be watching closely at the end of every week and have set stop losses that will indicate to me that I should sell if the price falls below the stop loss.

Slack Investor is happy to go along for the ride and has no real faith in his prediction ability. Sure, stocks are at extreme valuations but these are very unusual times. Interest rates are very low and there has been an unprecedented amount of government spending to keep economies going along.

Still on the couch, I don’t feel euphoria … but I feel OK … I have a plan.

April 2021 – End of Month Update

Despite the “exuberance”, Slack Investor is still on the wave and remains IN for Australian index shares, the US Index S&P 500 and the FTSE 100. All Slack Investor followed markets this month had strong rises (ASX 200 +3.5%; FTSE 100 +3.8%; S&P 500 +5.3%).

In these uncertain times, especially with the high prices on the US market, I am monitoring my index funds weekly and if, at the end of the week my Index funds are below the stop loss, then I will put a post on the blog and sell at the next opportunity. All Stop Losses are Live.

All Index pages and charts  have been updated to reflect the monthly changes – (ASX IndexUK IndexUS Index).

Household Comfort … and March 2021 – End of Month Update

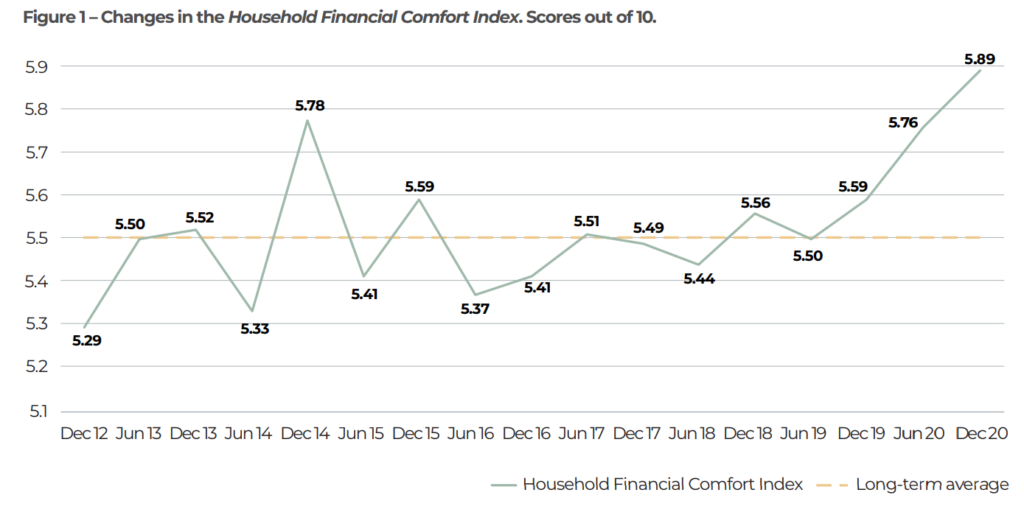
The couch seems to be looking good for some, but not for others. ME Bank have updated the annual Household Financial Comfort Index that surveys 1,500 Australians every year to get an idea of how Australia is travelling in a money sense. Slack Investor was surprised at the research results which revealed that over the past six months, to December 2020, the “financial comfort” of Australian households has reached a record high of 5.89 out of 10. This index is 5% higher than before COVID-19! However, it is full-time workers that report the highest financial comfort across the workforce.

The changes in the Household Financial Comfort Index since 2012 (Scores out of 10) – ME Household Financial Comfort Report 2020

The high financial comfort can probably be linked with some households going into “savings mode” as the uncertainty caused by COVID-19 on the economy, and the very high levels of government support.

Although, not everyone feels the same after a year of COVID-19. About 30% of households said that their financial situation has worsened. Clubs, pubs, gyms, air transport, restaurants, education, and the creative arts were hit particularly hard – with the cohorts of casual workers and adults under 24 shouldering the burden of Coronavirus disproportionally.

Household Response to the Pandemic

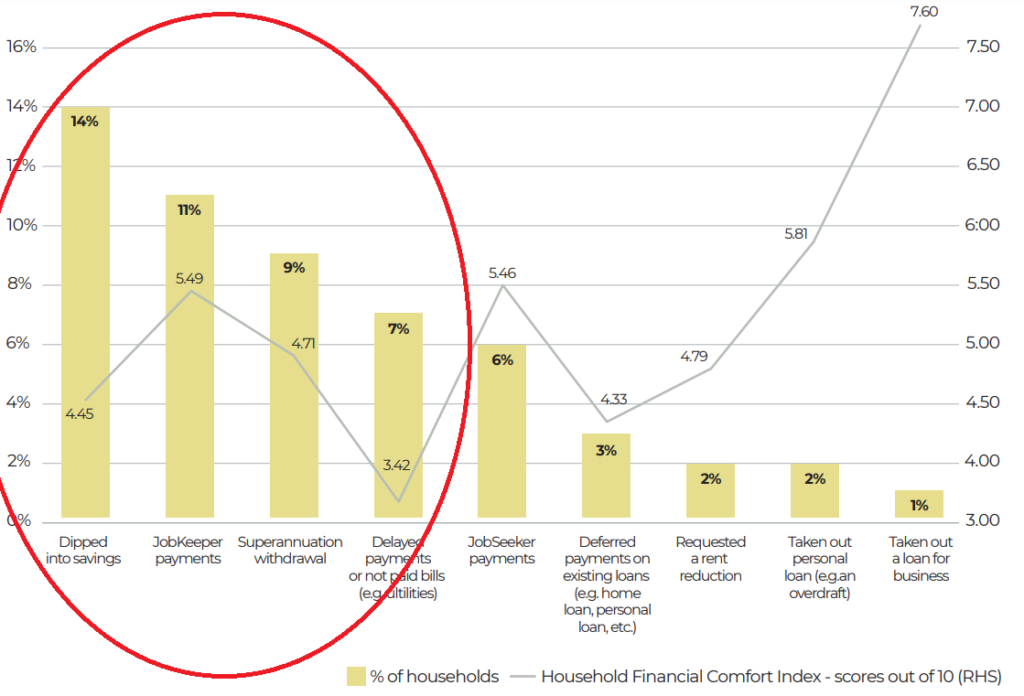
The main method that households used to ease the financial burden during COVID 19 (Columns %) and the line showing level of financial comfort associated with each method – ME Household Financial Comfort Report 2020

The main ways that households chose to ease the effects of the pandemic were 1. Dipping into savings (14%); 2. JobKeeper payments (Govt. wage subsidy) (11%); 3. Superannuation withdrawal (9%); 4. Delaying bills (7%). With JobKeeper payments having now ended, the raid on super halted, and the other main methods likely exhausted, it looks like a tipping point is approaching.

“And, at $90 billion, (JobKeeper) it’s the single largest economic support program that any Australia government has ever undertaken.”

Australian Treasurer Josh Frydenberg – ABC News

The Australian government’s massive JobKeeper program ending is likely to cause a big rupture in the economy with many small businesses who have, till now, been just “hanging on “. Many of these businesses are likely to cease trading. For employees, Treasury estimates that up to 150,000 workers will move from JobKeeper into unemployment.

Financial Cushion

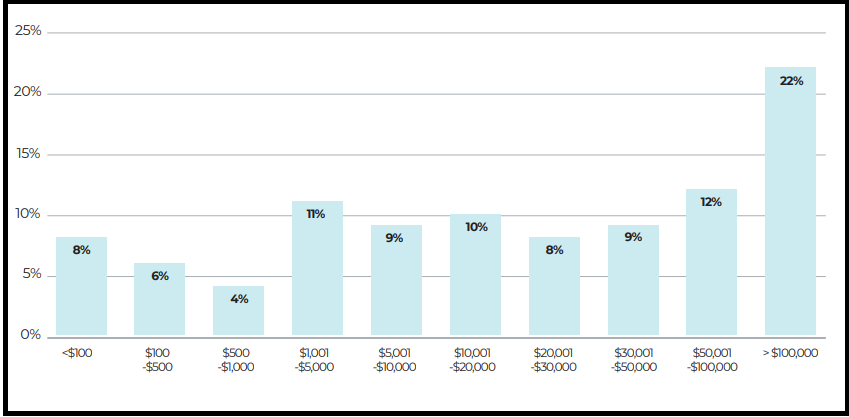
With tough times ahead, there will be many who would wish for a financial cushion. Slack Investor has often banged on about the need for an emergency fund of cash that will help when one of life’s inevitable bits of bad new turns up. In December 2020, about one in five households reported virtually no, or very low, amounts of cash savings (<$1000).

How much in cash savings does your household currently hold – including savings accounts, term deposits and offset accounts? – ME Household Financial Comfort Report 2020

As for the pandemic effect on retirement savings, the reality of individual super balances is starting to bite with the report revealing that only around 18% of households expect to fund retirement with their own superannuation and 42% expecting to use both private savings and the government pension.

“Financial comfort levels are up for now, but many households
are on the cliff’s edge. They’ve lost income, their jobs and entire
livelihoods, their wafer-thin savings buffer is dwindling, and government support is the main action stopping them from falling over.”

Household Financial Comfort Report – 2020 ME Bank survey

March 2021 – End of Month Update

Slack Investor remains IN for Australian index shares, the US Index S&P 500 and the FTSE 100. All Slack Investor followed markets this month had solid rises (ASX 200 +1.8%; FTSE 100 +3.5%; S&P 500 +4.2%).

In these uncertain times, especially with the high prices on the US market, I am monitoring my index funds weekly and if, at the end of the week my Index funds are below the stop loss, then I will put a post on the blog and sell at the next opportunity. All Stop Losses are Live.

All Index pages and charts  have been updated to reflect the monthly changes – (ASX IndexUK IndexUS Index). The quarterly updates to the Slack Portfolio have also been completed.

Three Pile Theory

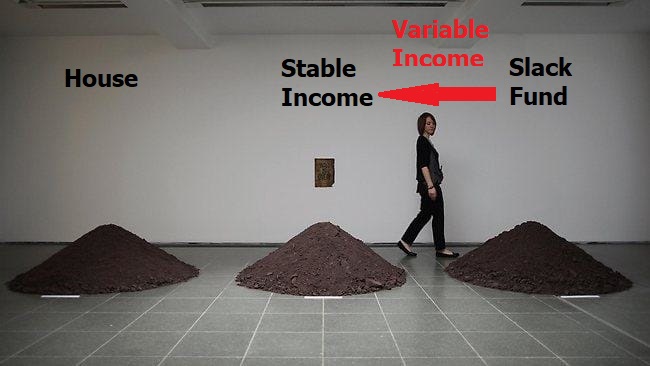
– Adapted from  ‘Three Mounds’ by Yoko Ono is displayed at the Serpentine Gallery on June 18, 2012 in London, England – From Getty Images.

With apologies to Yoko for interfering with her art, but Slack Investor first thought of his own “Three Pile Theory” back in 1989 when I had got myself a “Proper Job” and enough stability in my life to make the big plunge into Real Estate. At that time, I owned a few grains of dirt in my House pile (the Bank owned the rest), My income was OK, and my investments (which would later morph into the Slack Fund) contained a few thousand dollars in shares.

Now, 32 years later, Slack Investor still has these three financial pillars to keep himself steady.

  • House – Home ownership gives me great security and pleasure. The bank owned most of this 30 years ago – but now I have the upper hand! (~30% of Net Worth)
  • Stable Income – This used to be my job, but in retirement I have some stable income annuity style investment (~20% of Net Worth) that would pay my bills and maintain a basic Slack Lifestyle should Armageddon befall the stock markets for a few years. This income is supplemented by income from the Slack Portfolio.
  • Slack Portfolio Investments – (~50% of Net Worth) – Now currently in my Self Managed Super fund (SMSF) which is almost exclusively invested in growth companies. These are great businesses to be invested in if you have a long term horizon – however, stock prices can be volatile in these high Return on Equity (ROE) companies. I am currently retired and do not rely on the Slack Portfolio for stable income. Because of the stability of my other two pillars, I can be quite aggressive in the allocation of my investments in the Slack Portfolio – as I know I will not have to panic sell (for income) during any downturn.

Slack Investor didn’t really invent “Pile theory” – it has been around for a while in various guises – Three Buckets is a tried and true way to manage your retirement expenses by dividing your retirement stash into buckets of cash, conservative investments and more risky, growth investments.

House

My home may not feel like a palace to you, but to me, it is a whole Kingdom.

Prerona Chatterjee

There are some who argue that you are financially better off by renting over a 10-year period rather than buying. But for Slack Investor, the tax advantages – no capital gains tax on your own home in Australia; the leverage – banks are usually willing to lend at least 80% of the house value; the forced saving – your mortgage payment is a big monthly portion of your income which you set aside for a long period; and, the stability provided by home ownership make this a clear winner for me. “The Serenity” is just a bonus.

Stable Income

To cover living expenses and to give yourself “peace of mind” it is so important to have a slab of money that is not subject to the vagaries of the sharemarket. In Australia, if you haven’t enough super to go independently, you might qualify for a full or part pension.

If going the fully self-funded route, many advisors recommend your stable income should be in two parts. You should work out your living expenses for a year and then keep between 2 and 5 years worth of expenses in stable cash deposits – Let’s start with 3 years of expenses in accessible cash. The rest of you stable income pile can be in longer term cash deposits, bonds or REITS. Because the investments pile (Slack Portfolio) is in growth shares that can be very volatile, my stable income must be something that is not highly correlated to to the sharemarket.

Term Deposits– although interest rates are woefully low now on bank term deposits, it is still possible to get ~1% p.a. from some of the minor banks that still have the Government Guarantee for the first $250 000.

Vanguard Australian Fixed Interest Index ETF (VAF)

MER (0.20%) – Annual performance over 1/5 years – (3.81%/4.41%)

Vanguard Australian Government Bond Index ETF (VGB)

MER (0.20%) – Annual performance over 1/5 years – (4.08%/4.49%)

Challenger Fixed Term Annuity – Rates are pretty low at the moment, locking away a deposit for 5 years will earn a measly 1.65%.

Real Estate or Real Estate Investment Trusts (REIT) – these are a bit higher up the risk curve but as they produce income (rent) and can be associated with longer term leases – are usually less volatile than the share market. For example, Vanguard Australian Property Securities Index ETF (VAP) – MER (0.23%) – Annual performance over 1/5 years – (-13.3%/6.23%)

Investments – The Slack Fund

Because the Slack Portfolio is mostly in growth shares, I have steeled myself that this particular pile is volatile and changes value every day. I am prepared for a few low performing (or even negative) years in a row for this pile. Even great investors that have much more knowledge than Slack Investor have the occasional bad year – during some periods, share investments just perform poorly. I am accepting of this truth.

Because this Investment pile is mostly in my Self Managed Super Fund (SMSF), I am usually obliged to withdraw 4% of its total value each year – this percentage increases with age – but this payment is currently tax free for those over 60. I can use this income in a discretionary way. My living expenses should be covered by income from the Stable Income pile – and any other income is gravy.

Pile Rebalancing

Once you are in a house that you are happy in and hopefully will be near paying off any outstanding loans as you get into retirement – other than maintenance, you can leave this pile alone.

The Stable Income cash pile might occasionally need a bit of topping up from the longer term stable Income or Investments fund. Any dividend or interest income from your investments is fair game. The investment Slack Fund usually produces 2 -3% income.

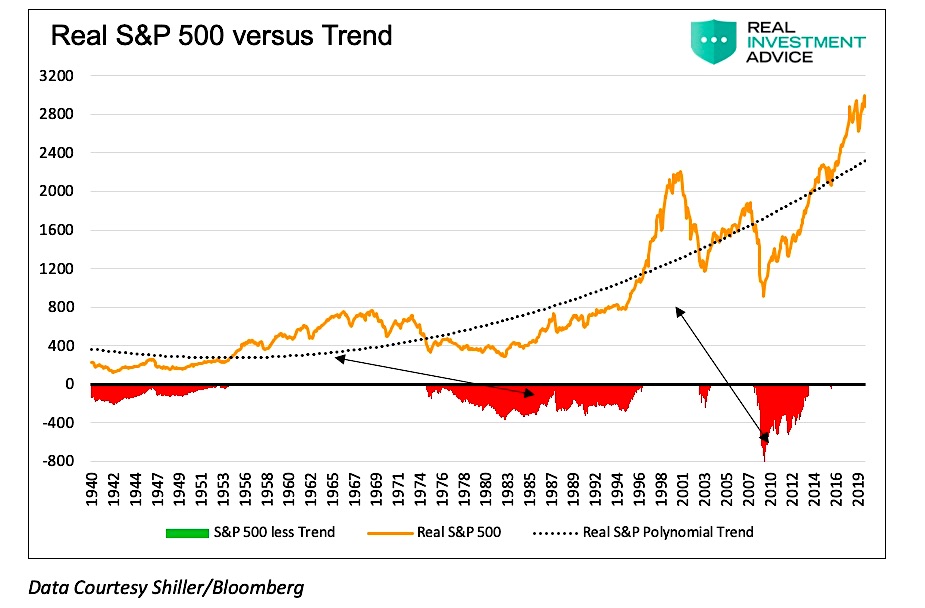
Hopefully, with 3-years worth of living expenses in the stable income pile, you can ride out a few bad years in the share market and only sell shares to top up the stable income pile when the share market has had a good run. Ideally, you would only sell share assets out of this pile when the share market is above the long term trend line. However, realistically, from the chart below (in red) there are long periods when the market is below trend. Have no fear, your basic expenses are always covered by a mixture of stable income, interest and dividends.

The long term chart of the US S&P 500 with the dotted inflation-adjusted long term trend line – from seeitmarket.com

There are other piles worthy of attention such as Health and Relationships but the finance stuff is necessary too. So get the shovel out … and start working on those piles!

2021 Lets talk about the planet – ESG Sustainable investing

Oooh … this planet is hot!

The difference in mean (average) temperature for the year 2020 and the 30-year average temperature between 1981 and2010 – Sourced from the World Meteorological Organization (WMO)

This is just last year … and the red colours show where planet Earth has been hotter than the long term average temperature. Clearly, for most of the world, 2020 was between 1°C and 5°C warmer than would be expected from the long term average. The reason this is happening is almost certainly due to increases in greenhouse gases since the industrial revolution.

… there’s a more than 95 percent probability that human activities over the past 50 years have warmed our planet.

From climate.nasa.gov based upon the Fifth Assessment Report Intergovernmental Panel on Climate Change (IPCC)

Another way to visualize the warming is to have a look at the past 110 years in Australia. The last decade was the hottest on record with temperatures almost 1 °C above average and one third of a degree warmer than the previous decade.

110 years of Australian Temperatures with warmer tempearatures represented by the yellow, orange and reds. These maps show the anomaly of mean temperature for each calendar year, compared to the average over the standard reference period of 1961–1990. From the Bureau of Meteorology. The full beauty of this chart can be found in the pdf form of the image.

This is not a political view – but is just science. The world is getting warmer and more and more people and governments think we should do something about it.

The world’s leading climate scientists have warned there is only 10 years for us to act if global warming to be kept to a maximum of 1.5°C. If temperatures go beyond this by even even half a degree, this will significantly worsen the risks of drought, floods, extreme heat and poverty for hundreds of millions of people.

Slack Investor has tried to do his little bit in reducing his CO2 emission- but admittedly, I could do more. In addition to his puny personal efforts, by marshalling the the power of his investments, this might have greater consequences. He is not alone in this thinking.

Environmental, Social and Governance (ESG) principles

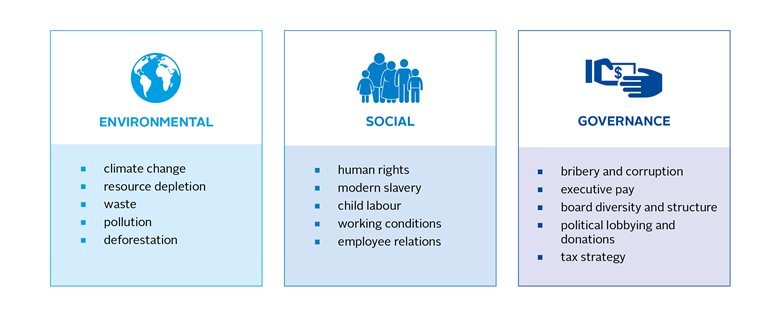
ESG has become a bit of a buzz acronym in corporate and investing circles and is linked with a set of factors associated with “responsible” or “sustainable” company behaviour. Global Warming (or Climate Change) is just one of these ESG issues – but Climate Change is the highest priority ESG issue facing investors.

Examples of ESG Issues – From Principles for Responsible Investment

To invest according to ESG principles is to undertake to exclude companies in their portfolios considered to be doing harm to the world, and often positively skew their portfolio weightings in favour of companies deemed to be doing good.

From the Sydney Morning Herald

A recent investment development has been the collection of environmental, social, and governance data. There are agencies such as Ethisphere and MCSI that rate publicly listed companies on their resilience to long-term ESG risks. But, most people just select a “Sustainable” or “Ethical” or ESG fund and let the fund manager do the company selecting.

Ethical Investing … its a murky world … but worth it!

While getting into an ethical investing fund or ETF is straightforward. Behind the door of each fund, picking which company gets into the fund sets up all kinds of dilemmas. The company selection process seems to be a bit of a “dark” art and can be done by positive screening (e.g, High ESG scores); or, negative screening with the exclusion of industries such as armaments, tobacco, gambling or thermal coal production. Screening might also be done at the company level, for instance, to exclude a mining company might have a dodgy environmental history. Each fund seems to have a different methodology. We hope that the fund managers get it mostly right. The sustainable/ESG funds that I looked at seemed to be dominated by Technology, Financial and Healthcare companies – these are the type of companies that Slack Investor invests in already. But mining companies should not be dismissed in this sustainable search as they will help enable the transition to the low carbon economy – but they too must rethink many of their practices and decarbonize production and reduce water usage.

… renewables power sources are built from non-renewable materials produced by businesses that tend to have larger carbon footprints and low ESG ratings. Mining firms produce many of the critical materials necessary to transition to a low carbon economy.

From Massif Capital – Failure to Impact (PDF):

For example, Massif Capital cite that to build a 400 kg lithium-Ion battery that might be found in most electric vehicles requires roughly 10 kg of lithium, 12 kg of cobalt, 24 kg of nickel, 36 kg of copper, 44 kg of graphite, and 160 kg of steel, aluminium, and various plastic components.

Sustainable Funds are Taking Off

It is not just the recent extreme weather related events such as the 2019 heat wave in Europe, or the recent fire events in Australia and California. There seems to be a surge in the amount of money coming into sustainable funds as investors are starting to think about climate change and sustainability and how this affects their investments.

sustainable funds estimated quarterly inflows
Quarterly fund inflows into sustainable funds. There has been a fourfold increase in assets that flowed into sustainable funds in the US last year – From Morningstar … A Tipping Point

A move towards sustainable investing can be done through your super fund. Each super fund will have some sort of sustainable option for your superannuation money. Or, you could invest directly through a managed fund or an Exchange Traded Fund (ETF).

If you don’t want to buy individual companies and research how sustainable/ethical each company is, I like the ETF approach and would look at ETF’s like Vanguard Ethically Conscious International Shares Index ETF (VESG) for International ethical exposure. It has a spankingly good low management fee of 0.18%. For local products, I couldn’t go past the SPDR S&P/ASX 200 ESG Fund ETF (E200). This ETF has only been going 5 months and has been doing well. It also has a low management fee of 0.13%

Move towards sustainable – and feel good about yourself – and we might just save this planet.

Cash is not King

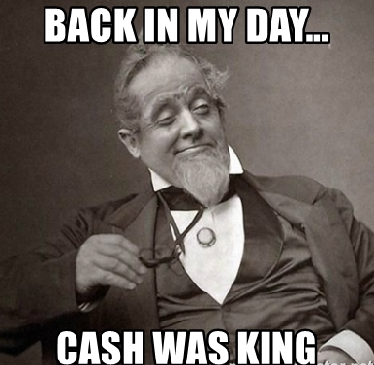
From memegenerator

My nephew is a carpenter and he would often gleefully say “Cash is King” when offered a cash job – no paperwork and no tax. This was fine for him as he was on a travel holiday and didn’t want the hassle of being on the books and claiming his tax back at the end of his holiday.

But, to the investor, Cash is not King.

If you hold too much of your wealth in cash, you won’t be able to keep pace with inflation, meaning your purchasing power will go down and it will be more difficult for you to achieve your goals.

Black Swan Capital

Slack Investor cannot argue that money in the bank is not safe, The government guarantees balances up to $250,000.

Cash is important for day to day expenses and your emergency cash buffer, “the cushion” to keep you going for about 2-3 months in an emergency. However, to get on the path to financial independence you must invest in appreciating assets.

Term Deposits, Bonds and Fixed Interest

For a relative, Slack Investor was trying to find a place where cash would earn a decent rate – without too much risk. There is not much around. Most transaction accounts pay no interest or 0.1% interest per year. If you are prepared to lock your money away for a year in a term deposit in a major bank, you might get 0.85%. One of the newer banks, Judo Bank, is offering 1.01%.

There are a few offerings in the bonds and fixed interest area. I ended up in the Vanguard Australian Fixed Interest Index Fund with a management fee of 0.24% and 1 and 3 year returns of 3.2% and 4.7%, respectively. The fund lends money to mostly government authorities – but, unlike term deposits, the returns are not guaranteed. A similar product is offered as an Exchange Traded Fund Vanguard Australian Fixed Interest Index ETF (VAF).

Growth Assets – Shares and Property

Higher up the risk curve are funds based upon share (equity) investments. In these funds or ETF’s the rewards can be higher – but the risks are also much greater. Only invest in shares or share funds with money that you can lock away for 3 to 5 years.

To grow wealth we must have exposure to growth assets such as shares and property.

Shane Oliver, AMP
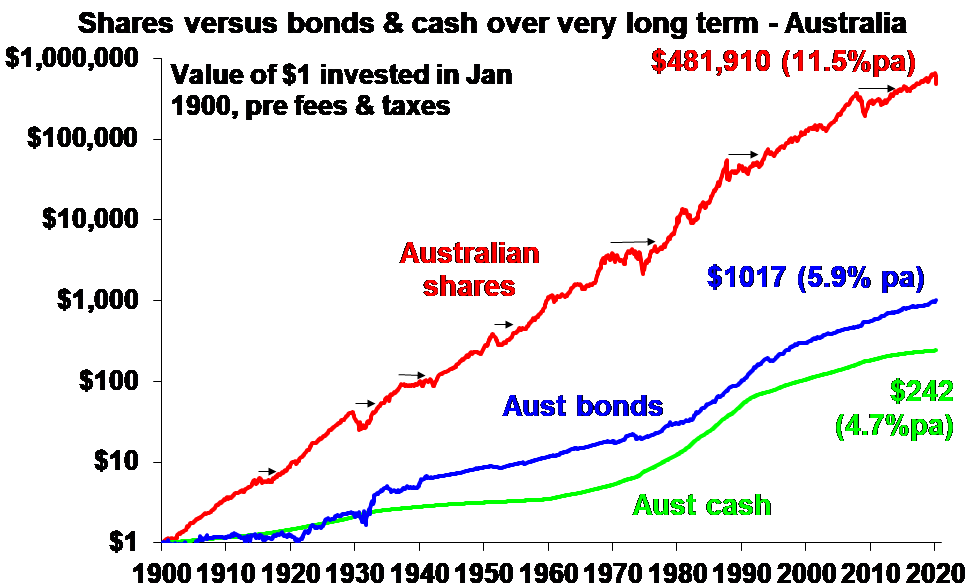
Asset classes shown on a logarithmic scale for the past 120 years – From “5 charts to help you through COVID-19 investment fear” – Shane Oliver

Australian shares have returned on average 11.5% per year from 1900 to 2020. The incredible value of sustained compounding over long periods is shown by the dollar amounts achieved over 120 years – A $ 1 investment yielded $481, 910 for Australian Shares, $1017 for Bonds and a paltry $242 for cash. But these high returns on investment in Australian shares did not come without risk. Since 1900, Australian shares have had negative returns for two years out of ten.

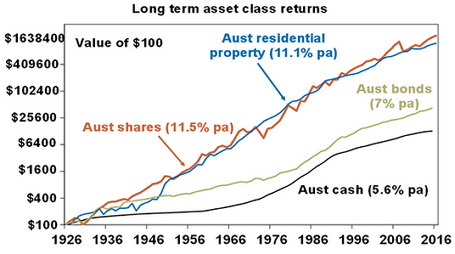
A similar chart with data to 2016 shows that Australian residential property has a similar trajectory to Australian Shares (11.1% p.a.). There are many hidden costs to owning property – but that is another story. Lower on the risk curve, are Bonds and Cash.

Slack Investor acknowledges that people have different appetites to risk, but if you are in the fortunate position to be sitting on some cash in excess of your emergency fund … the current rates for term deposits encourage a first journey up the risk curve and consider fixed interest funds or ETF’s. For money that you wont need for the next 3-5 years, then shares have the best long term returns. If your time frame is longer, then a well positioned property has been a good investment.

“Twenty years from now you will be more disappointed by the things that you didn’t do than by the ones you did do. So throw off the bowlines. Sail away from the safe harbor. Catch the trade winds in your sails. Explore. Dream. Discover.”

H. Jackson Brown Jr. from Goodreads

Hail to the Geeks

In honour of the upcoming International Geek Pride Day to be celebrated on 25 May.

Being a geek is cool (Just ask Bill Gates!). They have rights … the top 5 rights of a Geek are:

1. The right to be even geekier.

2. The right to not leave your house.

3. The right to not like football or any other sport.

4. The right to associate with other nerds.

5. The right to have few friends (or none at all).

During the past month. Slack Investor has certainly lived the geek lifestyle and he has reflected on the magnificent gift that geeks gave to the world – technology!

The NASDAQ (National Association of Securities Dealers Automated Quotations) is a special US based electronic stock exchange that was created in 1971 and now lists over 3500, mostly tech, companies. The top 15 companies in the NASDAQ consist of the household names below.

NameWeight (%)
MICROSOFT CORP12%
APPLE INC12%
AMAZON.COM INC10%
FACEBOOK INC4%
ALPHABET INC4%
ALPHABET INC4%
INTEL CORP3%
NETFLIX INC2%
NVIDIA CORP2%
PEPSICO INC2%
CISCO SYSTEMS INC2%
ADOBE INC2%
PAYPAL HOLDINGS INC2%
COMCAST CORP2%
TESLA INC2%
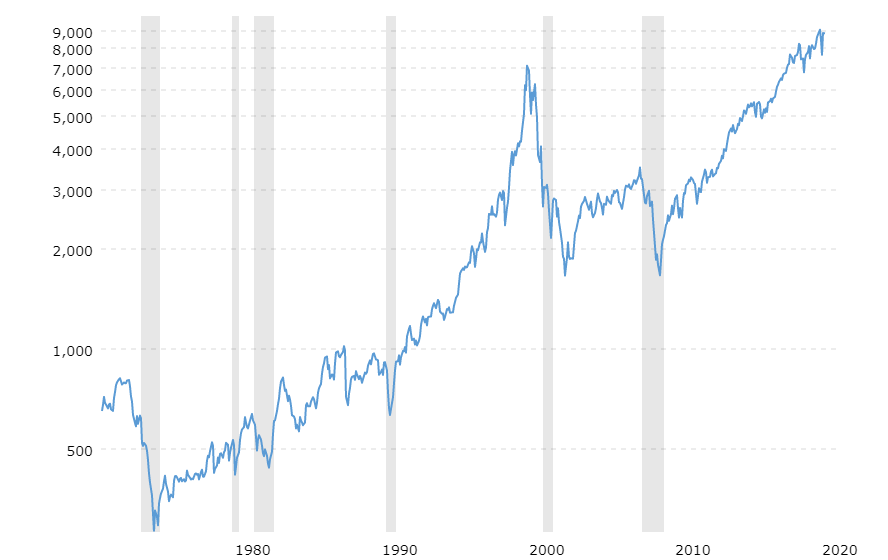
The growth of the NASDAQ composite index since 1971 – Shown on a log scale – From Macrotrends

Despite a few downturns, mostly in recessions (shaded grey columns above), being invested in technology has really delivered. Betashares, an Australian company, offers simple exposure to the top 100 companies in the NASDAQ through NDQ, their Australian listed NASDAQ ETF. Slack Investor owns some US Listed shares directly and the hassle of different currencies, maintaining a US Broking account, and filling out US taxation forms make the NDQ ETF Management Expense Ratio (MER) of 0.48% seem reasonable. Morningstar also offers a Global technology ETF TECH. Good global technology access for a 0.45% management fee.

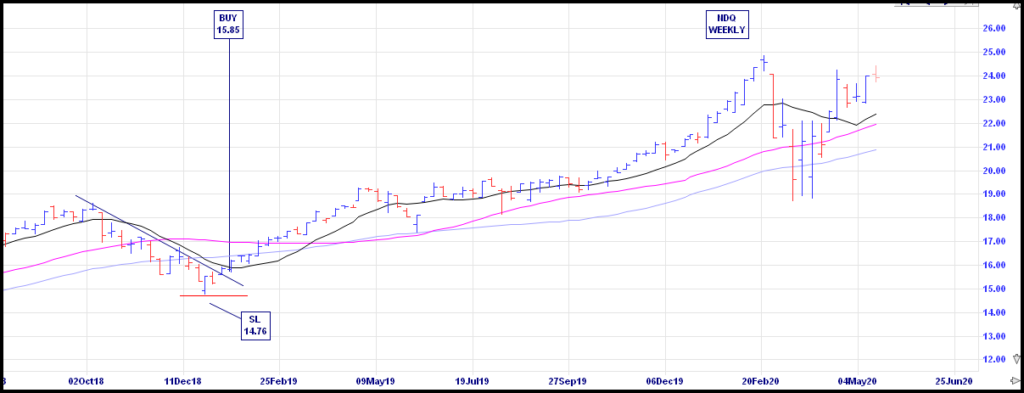
Weekly chart of Australian listed Betashares NDQ – Incredible Charts

The use of technology to connect people and develop new businesses has been well demonstrated during the COVID-19 crisis – these tech businesses are growing. Slack Investor has a big amount of technology stocks – over 35% of his Portfolio. NDQ has grown over 50% in the 18 months since the original Slack Investor buy.

One of the things that Slack Investor has learned over the decades is that a high PE is OK, providing that there is a lot of growth involved. Stamped on the little Slack Investor brain is that technology is becoming increasingly important in our lives – this sector is definitely growing.

The NASDAQ index usually has a relatively high average PE Ratio – but as of May 13 2020 it has slipped down to a very reasonable 20.55. There is also a decent trailing dividend yield of 1.73% – the dividend is showing an increasing trend.

This is not advice, as Slack Investor has no divine guidance on what will happen in the next 12 months. – but, with a 2-3 year time frame, will Slack Investor invest more into NDQ or TECH as funds become available? You bet your geekin’ life he will!

2019 Calendar Review and, at last … some quality

Slack Investor’s in-depth reviews of performance are done at the end of the Australian financial year (30 June) – but a brief look at how things went in calendar year 2019 is in order. It has been a great year for the share investor. Roger Montgomery reports that the Australian All Ordinaries Accumulation Index delivered a return of 24.0% in calendar 2019 – more than double long-term average annual total return. Other World Index yearly changes for 2019 (without dividends) are listed below.

Indicies% Change
Australian All Ordinaries19.10%
S&P 50028.90%
Nasdaq35.20%
Nikkei 22518.20%
FTSE 10012.10%

Quality Street

Slack Investor puts a bit of time into initial stock selection. Before entry to the Slack portfolio, I comb the company universe for high Return on Equity stocks that have low debt and a proven track record of increasing dividends. Delighted to report that a couple of Australian ETF’s have recently emerged that do a similar thing, using parallel principles to the great Benjamin Graham in selecting quality stocks – automatically!

BetaShares Global Quality Leaders ETF – QLTY

QLTY provides access to the 150 highest quality global companies (ex-Australia) based on a combined ranking of four key factors – return on equity, debt-to-capital, cash flow generation ability and earnings stability.

VanEck Vectors MSCI World ex Australia Quality ETF – QUAL

QUAL has a similar objective screening process, to fill its stock register. Companies must have a high return on equity, stable annual earnings growth, and low financial leverage. 

There are common elements to the top 10 holdings for each ETF. Companies like Apple, Visa, Facebook and Alphabet feature on both registers. Either of these ETF’s would be a great addition to a portfolio but Slack Investor would lean towards BetaShares QLTY because of their slightly less expensive management costs (0.35% vs 0.40%). Past results indicate there is outperformance attached to this “quality” approach.

My only criticism is that both ETF’s have quality filters that do not seem take into account how expensive the stock is. When Slack Investor researches stocks, I usually dismiss a company if the forecast earnings (+2 years) produce a PE that is over 40. With QUAL and QLTY, it is quality first, regardless of price. I am mollified slightly by the determination that, in the past,

MSCI World Quality Index traditionally has its strongest relative performance during economic downturns

From Van Eck Whitepaper

Sometimes people ask me what stocks to buy – and I seldom have a good answer for them – particularly if they are just starting out on the path of buying shares and their portfolio carries the risk of just one or two stocks. These two ETF’s have given Slack Investor an easy answer.

  • Instant Diversification – International exposure
  • Access to high growth companies with a good track record of increased earnings
  • Rules based stock selection – no ‘active manager’ fees -this should keep expenses low ~ 0.4% … but could be lower!

The early results are not bad either with Morningstar listing one-year performance for 2019 for QUAL and QLTY at 35.8% and 34.5%, respectively.

These sort of products might just put Slack Investor out of a job!

Portfolio Trim and Fitcats

From House Beautiful – May be subject to copyright

On the theme of a trim … who doesn’t like a bit of topiary. My portfolio has had a little haircut in the past 3 months as I have been thinking about the potential of a recession and the effect it might have on my investments. Lacking the skills of Nostradamus, Slack Investor has chosen the “middle path” for his individual stocks i.e . Between doing nothing and “selling everything”, I have chosen to fiddle with about 20% of the portfolio. Some of the things I have bought are expanded on below, in order of investment commitment. This is not advice, just a random walk through stock selection. To make room for the new purchases I sold a few high PE stocks and a few underperformers. The sold stocks include APX, CGC, PMC, AGL and CTD.

Alphabet -Google ( GOOGL)

This is new ground for Slack Investor as GOOGL is US based company and the investment has the additional complexity that I have to use an international broker (Saxo) to purchase shares on the NASDAQ exchange. But, I feel the extra effort is worth it as I can’t think of a better company to ride with through the next 10 years.

Google search has 92% global market share. Chrome is the world’s most widely used web browser. Android is the world’s most popular mobile operating system with 2 billion-plus active users. YouTube is watched for more than 1 billion hours a day. Alphabet has about US$100 billion in cash which, for a sense of scope, is larger than the combined market values of TelstraWoolworths, and Macquarie.

Joe Magyer from Motley Fool on the dominance of Google’s Alphabet

I use Google products countless times a day and with a Return on Equity of 21 % and a reasonable Price Earnings ratio (for the growth tech sector!) of 24. I would like to own more of this and will seek to add to my position over time. The international shares thing is a bit of a hassle and has some extra expenses. A far easier, way to get a slice of Google (and other great tech growth companies) is by buying the Australian-listed NASDAQ ETF (NDQ). Alphabet represents 8.6% of the NASDAQ Index.

Vanguard Australian Fixed Interest ETF (VAF)

For ETF’s, I naturally lean towards Vanguard due to their relatively low fees and a commitment to keep them low (Thanks Jack Bogle!) I bought this ETF to try and derisk my shares portfolio by getting some exposure to the Australian Government Bond and Fixed Interest Market. I have also bought some Vanguard Emerging Markets ETF (VGE) and Vanguard Global Infrastructure (VBLD).

Centuria Industrial REIT (CIP)

The lure of property rentals during tough times and a bit of exposure to Industrial Real Estate has brought me to this area. I was tossing up buying Goodman (GMG) or Centuria. Both have a similar Weighted Average Lease Expiry (WALE) and occupancy rate. GMG has a relatively high 2020 PE of 26.1 compared with a CIP 2020 PE of 14.8. CIP also has a more fruity yield of 5.7%. Case Closed.

United Overseas Australia (UOS)

A Malaysian real estate developer … Steady on, this sounds a bit wacky! – UOS is a bit of a speculator for Slack Investor. Real estate is a place where I am underdone and I am alway convinced by good arguments. A respected investor (by me), Tony Hansen, from EGP Capital has this stock as his highest portfolio allocation. UOS has a solid cash position, a decent yield and the discount to net worth got me over the line. What is life without a little bit of risk!

Fitcats – Get your super runnin’

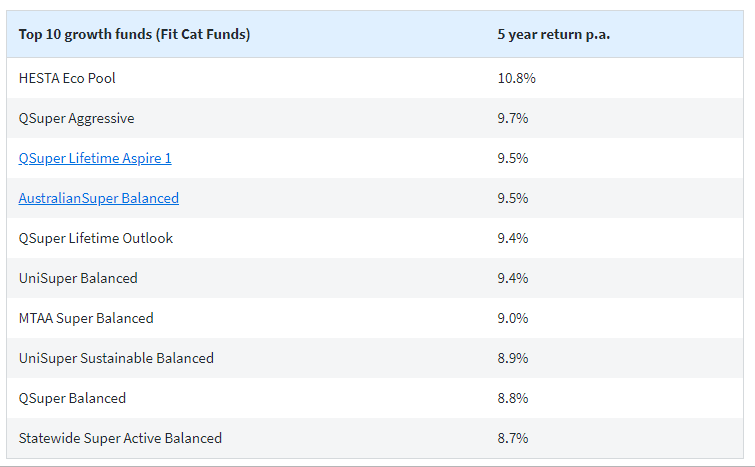
With apologies to the legendary Steppenwolf, Slack Investor has the news from Chris Brycki (the tireless CEO of Stockspot and author of the Fatcat/Fitcat report). He has produced his yearly assessment of the best super funds (Fit Cats) and the worst (Fat Cats). Fat Cat Super Funds on average charge 2% a year in fees, while, in comparison Fit Cat Super Funds charge less than 1% a year in fees. 

“One of our golden rules of superannuation is; the less you pay, the more you get. Always pay less than 1% p.a. in fees so your super isn’t eroded by high fees. I know 1% doesn’t sound like a lot, but for the Aussies stuck in these Fat Cat Funds they’ll be worse off by $200,000 or more compared to their friends who are in a low-fee fund,” 

Chris Brycki, Stockspot

So, if you haven’t already done so … get financially fit, grab yourself an account number in one of these top performers. Most will allow new customers. Then continue to get some Fit Cat action by asking your employer to make any future contributions to your new account. Then rollover your super to the new fund and your sweet.

Robo On

When Robo Advice gets it wrong … Exterminate Financial Freedom! – Image from aminoapps.com

Last month’s post on robo advice had a look at a couple of options … but there is more. They all work in much the same way. In the “old days”, to enter the investing world you would have to register with a broker (e.g. Self Wealth, CommSec) to get access to shares or Exchange Traded Funds (ETFs) – and you would be charged brokerage for each buy and sell. Each ETF also has a management fee (usually 0.10% to 0.50% per year) but that is deducted from your returns internally.

A recent Choice article outlines two things have worked against young people investing in the stock market. Firstly, a lack of knowledge about how to start investing, and then, not having a decent stash of money saved up to make broker fees worthwhile.

With the robo advisors, small amounts are no problem. For a monthly fee they take care of the purchasing and the brokerage – This is usually a much easier experience as it takes less thought and action.

  • From the robo advice website you open an account and establish your identity.
  • After a few questions to get your risk profile, the robo advisor will suggest a portfolio of ETFs.
  • Your bank account details must be given to fund your initial portfolio of ETFs.
  • You might also setup a regular investment and some of the robo advisors ( Raiz and FirstStep have a cool rounding feature where your everyday card purchases are rounded to the nearest dollar – and the rounding excess will go towards your portfolio.
  • The Robo Adviser does regular rebalancing of your portfolio.

Robo your Investing

Lets Robo On, Six park, Stockspot, Raiz, Clover, QuietGrowth and FirstStep have some great offerings and are worth a look.

ROBO ADVISORFee Schedule$2,500 portfolio fees pa$10,000 portfolio fees pa$200,000 portfolio fees pa
Six ParkMinimum $10000. Management Fee 0.4% to 0.5%……$50$1,000
StockspotFixed fee of $66 pa for balances < $10k with asset based fees of 0.396% to 0.66% pa$66$66$1,320
Raiz$1.25 per month <$5K; 0.275% pa >$5K$15$27.50$550
CloverMinimum $2500. $5.50 per month <$10K; 0.45% -0.65% pa >$10K$66$71.50$1,210
QuietgrowthMinimum $2000. Promotion No Monthly Fees <$10K; 0.40% – 0.60% pa >$10K$0$0$1,045
First Step$1.25 per month <$5500; 0.275% pa >$5500$15$27.50$550

The above prices were compiled July 2019 and should be checked before you start investing.

Robo your Super

All of the above Robo advisors will help you build up your ETF investments as a “side hustle”. But, there is a new way of adding to your existing super (hopefully you have made an effort to make sure it is an Industry Fund!) in a relatively painless way. Longevity has a mobile phone app that automatically tops up your Super calculated as a percentage of your everyday purchases – into whatever super account you choose. It is based on your everyday spending and then calculated as a percentage of your spend (default 1% – but go higher if you can -and maybe a set amount each payday!). At the minimum, if you spend $200 on groceries, this will generate a 2 dollar deduction at the end of the month. You can limit your monthly deductions to an amount – so that you don’t go negative in your everyday account.

Because Longevity operates in the superannuation environment it is taxed favourably compared to investments outside of super where earnings are taxed at your marginal tax rate.

What to do Now?

There is always a bit of inertia involved to enter the world of investing. More experienced investors who already have a lump of cash and a disciplined approach to saving perhaps don’t need savings apps like Raiz. They could buy ETF’s directly through a discount broker (e.g Self Wealth), or setup a more sophisticated robo account with Stockspot. Robo investment apps such as those in the above table aren’t after this demographic. Most Robo Advice platforms are targeting younger people who might not otherwise start investing until much later in life.

“Raiz aims to encourage its customers to be mindful of their spending and to start saving and investing some of their income … the average Raiz customer has made 11% per annum since launch

Raiz’s Managing Director, George Lucas. from Choice

Simple steps

When in doubt, do something.

Singer-Songwriter Harry Chapin of “Cats in the Cradle” fame

The beauty of Robo Apps and instruments is that they are an easy way for anyone to start investing. Slack Investor says … just start! The rounding and transactional nature of Raiz and Firststep really appeal to me. Slack Investor likes this sort of painless saving and would get either of these apps as a great first step into investing. I wish these vehicles were around in my younger days. There are risks involved (i.e. share prices going down!) – but hey, That’s Investing – and the risks diminish over period of time (say, 5 years) – According to ASIC, Risk is part of the investing experience.

Given the huge returns money invested early in life can generate, the costs of the lower priced robo devices (e.g Raiz, FirstStep, Longevity) of around $1.25 a month is very reasonable. Pick a platform, install their app and set your contributions – You are launched into the wonderful world of investing – get on that road!