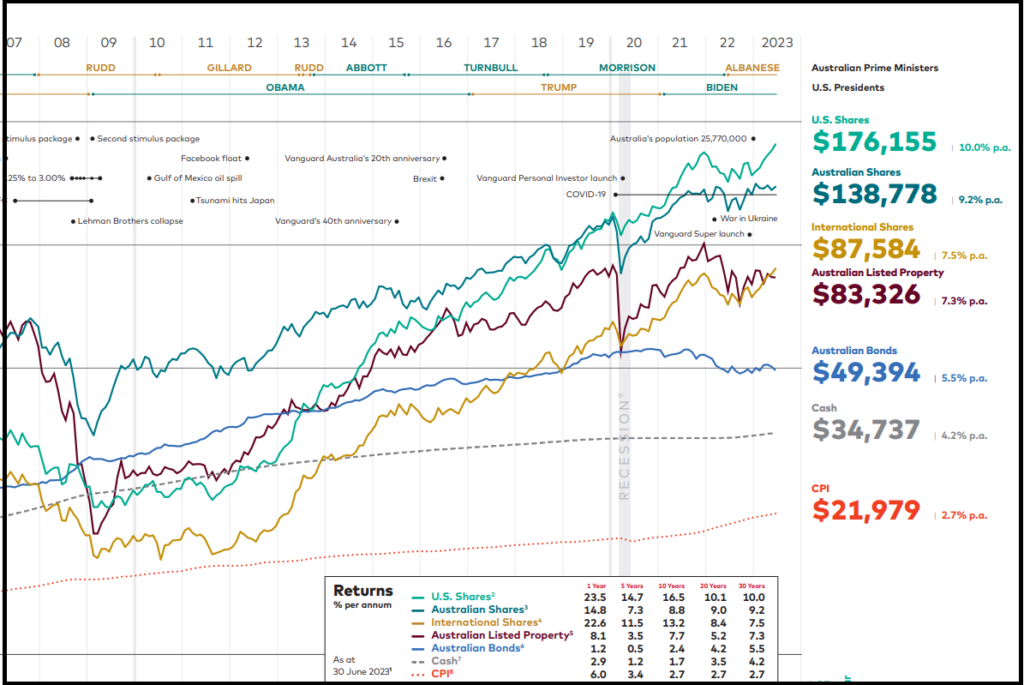
Whether it has been a good investing year – or a bad one, August is the time when the Vanguard long-term (30 yr) investing chart lands. It is a timely reminder that whatever is happening in the short term, investing for the long term (> 5-10 yr) in International and Australian shares will compound your wealth. Anyone with a steady income that exceeds their living expenses can do this – so, what a young Slack Investor would do, is Automate his investments, through platforms such as Stockspot, Pearler, Vanguard Personal, or Raiz) … and “Get Cracking!”

The lessons of long term investing
Every year Vanguard publish their performance data on each asset class. Slack Investor looks forward to this – as it demonstrates the powerful compounding that happens when the appreciating asset classes of Shares and Property are held for a long time (30 years). Although this Vanguard collection of data shows the volatility of asset values in the short term – it also also emphasizes the joys of holding and accumulating shares or property for long periods of time. These asset classes have steadily increased in value over the last 30 years. $10000 invested in Australian Shares in 1993 would have compounded to $138 778 in 2023, US Shares would have compounded to $176 155. Staying in Cash would have yielded $34 737.
Slack Investor says download and study this chart … and work towards getting a mix of some appreciating assets … accumulate, then hang on!
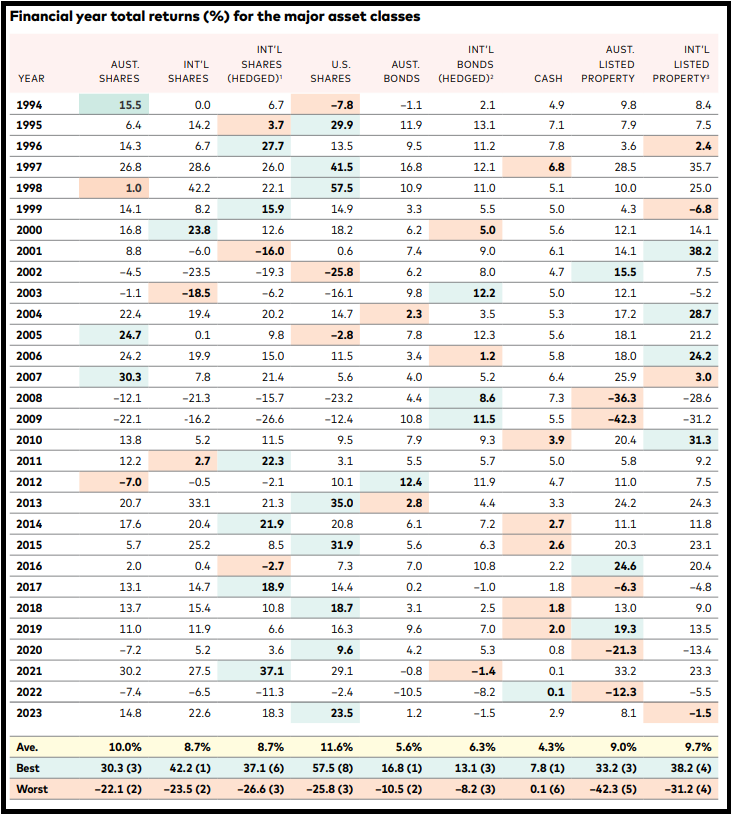
Financial year total returns (%) for the major asset classes
In the Vanguard 2023 table below, for each asset class the total annual returns are given and the best performing class for each year is shaded in blue/green … and the worst in pink. What stands out to Slack Investor is that is rare for and asset class to lead in annual returns (blue/green) for two years in a row – and there are years where the leading asset class (blue/green) becomes the worst performer (pink) in the next year. This drives home the need to spread your investments over different asset classes (diversification) and stay the course – 30 years of data talks loudly to Slack Investor.

This table highlights the benefits of diversification across asset classes for the long-term investor. Each asset class might be the best performing (Blue/Green shading), or the worst performing (Pink shading) for the year – and might dominate (or languish) for up to two years in a row. However, often a worst performing asset will show up as the best performing asset in the very next year – or vice versa.
Slack Investor is accepting of the occasional negative returns on a yearly basis for the appreciating asset classes- and concentrates on the 30-yr average long-term annual returns for holding shares and property of over 9% p.a.
When averaged over 30 years, the asset class and annual returns are : For AUST. SHARES 10.0%; INT’L SHARES 8.7%; U.S. SHARES 11.6%; AUST. LISTED PROPERTY 9.0%; and INT’L LISTED PROPERTY 9.7%; This compares with the average cash return of 4.3% p.a.
Slack Investor knows where he wants to be … over the long term, it isn’t cash.
August 2023 – End of Month Update
Slack Investor remains IN for Australian index shares, the US Index S&P 500 and the FTSE 100.
All Slack Investor overseas followed markets had a negative month (S&P 500 -1.8 %, and the FTSE 100 -3.4% and the Australian stock market did the same (ASX 200 -1.4%).
All Index pages and charts have been updated to reflect the monthly changes – (ASX Index, UK Index, US Index).

