FY2022 Nuggets and Stinkers and … July 2022 – End of Month Update

 So the last shall be first, and the first last: for many be called, but few chosen 

Matthew 20:16 – King James Version of the Christian Bible

Slack Investor is not a very religious person – but he is a numbers man and 84% of the global population identifies with a religious group – so I have to go with the flow here. This sort of majority demands respect. The Christian disciple Matthew was reporting on one of Jesus’s teachings. Biblical scholars think that Jesus was trying to point out that Heaven’s value system is far different from earth’s value system.

The “Last first and First last” might also be applied to how some of the Slack Portfolio stocks have been going over consecutive years. There seems to by a cycle of last years Nuggets … might end on the Stinker pile the year after – and vice-versa. Growth stocks have many virtues … but they are not immune to the cycles of price – bouts of overvaluation followed by a period of undervaluation.

The percentage yearly returns quoted in this post include costs (brokerage) but, the returns are before tax. This raw figure can then be compared with other investment returns. I use Market Screener to analyze the financial data from each company and extract the predicted 2024/2o25 Return on Equity (ROE), Dividend Yield and Price/Earnings (PE) Ratio on the companies below. This excellent site allows free access (up to a daily limit) to their analysts data once you register with an email address.

Slack Investor Stinkers – FY 2022

Financial year 2022 was the Pepé Le Pew of all of Stinktown for Slack Investor.I hold mostly growth shares in the technology and healthcare sectors. These sectors have been heavily punished across the world so far in 2022.

This is the first time I have had a negative result for my investments over a financial year since 2009. Slack Investor is a great believer in long term investing returns – usually evaluated over a 5-year period – so this year’s result, while painful, does not change my overall strategy.

Three of my “stinkers” this year were actually “nuggets” from last year. For FY 2020, Codan +161%, REA +59% and IDX +37%. Such is the cyclic nature of some growth stocks.

Codan (CDA) -58% (Still held)

Codan - Niramar

(CDA – 2025: PE 14, Yield 3.8%, ROE 25%) Codan is a technology company that specializes in communications and metal detecting. This company was one of my big nuggets last year (+161%) – so I should not have been really surprised that there could have a bit of a pullback. The decline hurt, but the fundamentals of the company remain sound. Holding on.

Xero (XRO) -41% (Sold)

Xero

(XRO2025: PE 81, Yield 0.3%, ROE 15%) Xero is an innovative cloud -based accounting provider for small business. Every business owner that Slack Investor talks to say that Xero is a boon to their business. This sort of “word of mouth” got me over-excited this year and I just held my nose and jumped in – against all my rules of avoiding the excessively high forward PE ratios of over 50! It is these high PE companies that are usually punished first in a downturn – and that’s exactly what happened. I still look at it and think its a decent growing business – but I can feel the recent bite!

Integral Diagnostics (IDX) – 39% (Still held)
Integral Diagnostics | Medical Imaging Services | Australia | New Zealand

(IDX – 2024: PE 16, Yield 4.5%, ROE 12%) This medical image company provides diagnostic image services to GP’s and specialists. IDX was another of my nuggets from last year (+37%) that has just shed all of last years gains. The Return on Equity of this company is starting to get a bit low (<15%) – But the PE and yield seem OK. Will keep this company on watch for the moment.

BetaShares Asia Technology Tigers ETF -33% (Still held)

(ASIA – 2022: PE 14, Yield 0.7%,) Growth in Asia … What could go wrong! Plenty it seems.

These “technology tigers” that make up this ETF have been part of a global selloff of tech-related shares this year. 

A lot of the Chinese companies (such as Alibaba) have been marked down because the Chinese government imposed its will on a few industries. Also the US government has hinted at action on Chinese companies that have listed on American market. However, the ASIA ETF has large holdings in such monsters as Taiwan Semiconductors, Samsung and Tencent Holdings – so I will accept the current pain and stick with this as a long-term holding

REA Group (REA) -33% (Still held)

File:REA Group logo.svg - Wikipedia

(REA – 2024: PE 29, Yield 1.8%, ROE 32%) The owners of RealEstate.com.au. which is the go to portal for house selling and buying. 65% of Australia’s adult population are checking the site every month looking at property listings and home prices. Another long-term holding.

I have only listed the stinkers that lost over 30% this year … sadly, there were many more rogues that lost over 15% for the Slack Fund. They include PPK Group (PPK) -28%; Altium (ALU) -25%; Nick Scali (NCK)-20%; Pushpay Holdings (PPH)-16%; and A2 Milk (A2M)-15%.

Slack Investor Nuggets – FY 2021

Nuggets were few and far between this year. A great benefit of investing in companies that have a high Return on Equity (ROE), and with a track record of increasing earnings, is that they sometimes behave as “golden nuggets”.

Technology One(TNE) +17%

(TNE – 2025: PE 34, Yield 1.7%, ROE 36%) This Software as a Service (SaaS) and consulting company continues to be profitable. This year is the 13th year in a row of record half-yearly profits. A high 2025 PE of 34 (Expensive) is a little scary but, if the high Returns on Equity (36%) remain, on balance, this is OK.

Macquarie Group (MQG) +10%

Commonwealth Bank Macquarie Group Finance Westpac, PNG, 1800x600px,  Commonwealth Bank, Australian Dollar, Bank, Brand, Finance Download

(MQG – 2025: PE 25, Yield 4.0%, ROE 13%) Macquarie is a complex business with a range of banking and financial services, and plays in global markets and asset management. Once again, the management seem to know what they are doing – Slack Investor remains a fan.

Honourable mention to the only other company that ended in the black – Coles (COL) a decent +8% in these troubled times.

Slack Investor Total SMSF performance – FY 2022 and July 2022 end of Month Update

In a year that Chant West describes as “a rough year for markets”. Following FY2021, which was one of the strongest years for Super funds (+18% for FY21), things have now lurched south with the median growth fund (61 to 80% in growth assets) returning -3.3% for FY22.

The FY 2022 Slack Investor preliminary total SMSF performance looks like coming in at around -14%. However, the 5-yr performance is a more useful benchmark to me – as it takes out the bouncing around of yearly returns. At the end of FY 2022, the Slack Portfolio has a compounding 5-yr annual return of over 13%.

Despite a breach of the stop loss for the ASX 200 last month, Slack Investor remains tentatively IN for Australian index shares on a dramatic rise of 5.7% this month. The FTSE 100 also had a good month (+3.5%)and I remain IN. The US Index S&P 500 eclipsed them all with a remarkable 9.1% gain – and I am now a BUY back IN.

Last month the ASX 200 price went below its stop loss. Slack Investor tries not to exit a stock against the momentum of the market, so I have been off the couch and closely watching the ASX 200. It has remained above the rising trend line and emerged above the monthly stop loss. I am tentatively still IN.
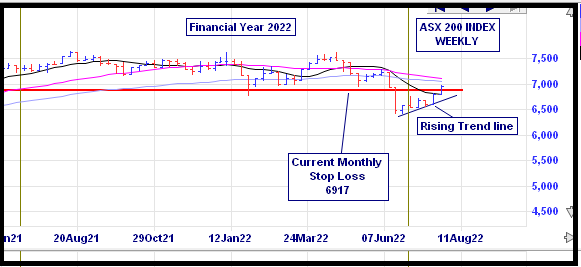
ASX 200 Weekly chart – From Incredible Charts

After a sell, it is important to have a notion when to get back IN to an Index or a stock. When trend trading, my main tool for finding a buy signal is a trend following (or momentum) system called the Directional Movement Index. There are many ways of setting up this system. Slack Investor likes the “smoothing” that is enabled by a system that looks back over the previous 11 periods – but the complexities are best left for the Resources page.
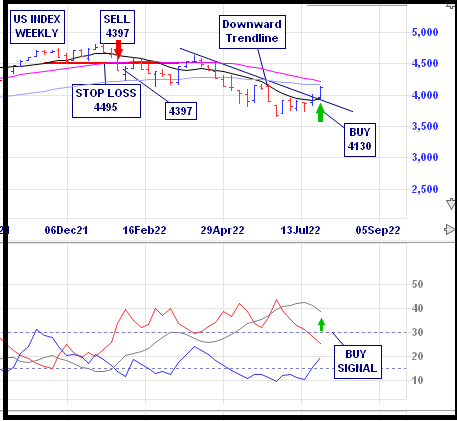
S&P 500 Weekly chart showing a BUY signal on the Directional movement Index weekly chart. The weekly price ranges are at the top and Average Directional Movement Index (ADX) patterns below – From Incredible Charts

In addition to the BUY signal from the Directional Movement Index for the S&P 500, the charts show a triggering of the “Wedgie” pattern where the stock price breaks through a long term down-trend. This reinforces the BUY.

All Index pages and charts  have been updated to reflect the monthly changes – (ASX IndexUK IndexUS Index).
Control the things you can control … Super Fees

File:Tax payment to a lord - BNF Fr9608 f11v.jpg
Tax payment to a lord – Meister der Apokalypsenrose der Sainte Chapelle

While the market is doing what it does and there is the feeling of Armageddon in the price of stocks, Slack Investor knows that he has no control over market sentiments and, as a welcome distraction, he is having a look at some of the things he does have control over – the fees that he pays for financial services. Superannuation fees are still too high – some of the highest in the OECD. This is a recurring theme for Slack Investor.

I like to think that the Slack fund is a pretty trim ship – but, there is always room for improvement. Slack Investor runs his family super through a Self Managed Super Fund (SMSF) – but this is not the best option for those who are time poor or, don’t want the stress of the management of your own retirement. On the plus side, for larger balances, if you use a low cost provider, it is relatively easy for a SMSF to restrict fees to less than 0.5% of funds under management.

High super fees linked with underperformance

Fees are the other most important factor when choosing a superannuation fund. You can’t control how markets perform, but you can control how much you pay for the management of your hard-earned money.

Stockspot Fat Cat Report 2021 – Annual Report on Superannuation funds by Stockspot that sorts each fund into “Fit Cats” (Good) and “Fat Cats” (Bad).

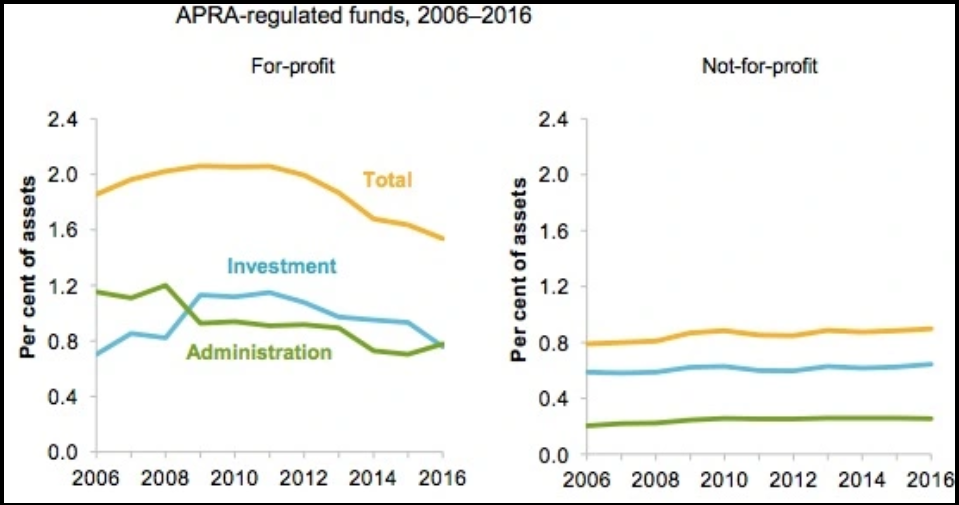
As a general rule, for profit (Retail) super providers charge fees in the 1.4-1.8 % and the not-for profit funds charge 0.8-1.0 %. For larger balances (>50K), if your annual fees are more than 1.0% of your total super balance then it is time to look elsewhere – try to get your super fees below 1.0%.

Fees Charged by APRA regulated super funds as a percentage of assets. For profit funds (Retail) funds compared to Not-for Profit funds (Industry funds) – From Crikey: Why the hell are our superannuation fees so high?

There is a clear correlation between high fees and long-term underperformance in superannuation.

Stockspot Fat Cat Report 2021

What to do?

I recommend all Australian readers to drag out their latest annual super statement and find the total amount of fees and charges. Divide the total fees by your total super amount (x 100) and you will have the percentage of your super that you are paying in fees.

Canstar have compiled a 2022 Outstanding Value Superannuation Award winners report that allocates a star rating for superannuation funds. based upon 5-year performance (after all fees) and features of each account. A four or five star rating is good. Their top rated funds for value in 2022 are all Industry funds and are listed below – these would be on the shopping list if I wanted to change my super fund.

Super FundType
Australian Retirement TrustSuper Savings
Australian Super Australian Super
Aware Super Personal
Cbus Super Cbus Industry Super
Hostplus Personal Super
UniSuper Personal Account
VicSuper Future Saver / Personal Saver

For more detail on how your super compares with others, there is a fantastic bit of superannuation comparison software, designed by Chantwest, called Apple Check. You have to give up some contact details for the form and access it through individual super fund sites … but they have provided great comparison info on super products to Slack Investor with no spamming. Worth doing if you are considering a switch and want to be fully informed of a fee comparison that applies directly to your situation.

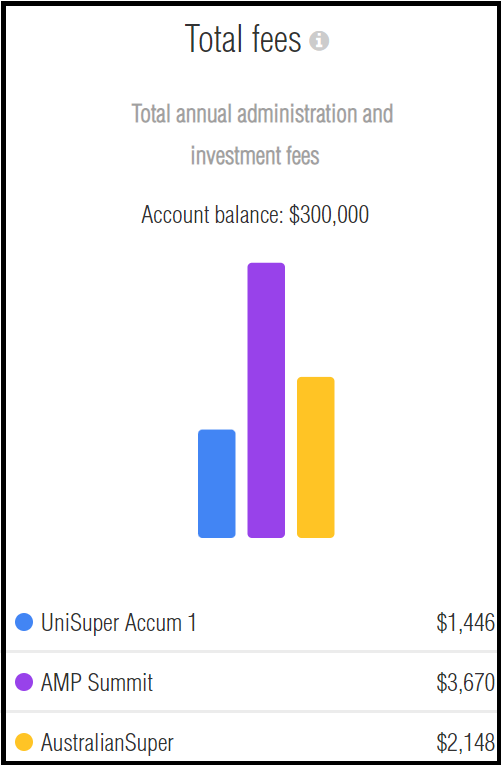
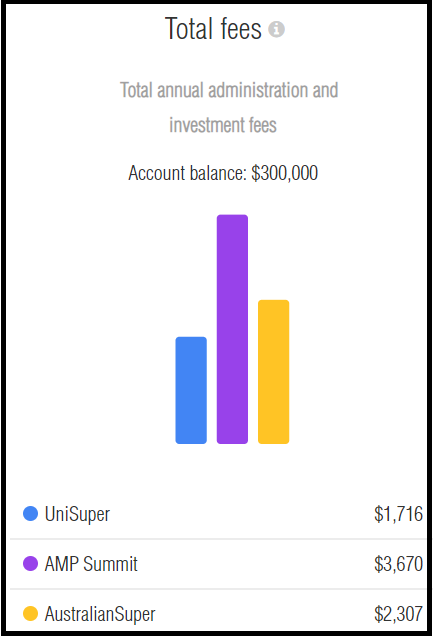
I have compared two non-profit Industry funds (UniSuper and AustralianSuper) with a for-profit Retail fund (AMP Summit) for a nominal $300K account – in both Accumulation and Pension mode. Clearly AMP Summit has higher fees for both an Accumulation a/c and a Pension a/c. I would be happy to pay higher fees of a retail fund (AMP Summit) if there was an established increase in performance. However, the Apple Check report shows a 10-year net return (investment returns after all fees) of the retail fund is at least 10% worse than either industry fund.

Apple Check comparison of fees for ACCUMULATION accounts of $300K. Unisuper (0.48%), AMP Summit (1.22%) and AustralianSuper (0.72%).
Apple Check comparison of fees for PENSION accounts of $300K. Unisuper (0.57%) , AMP Summit (1.22%) and AustralianSuper (0.77%).

Market downturns are never easy, but Slack Investor knows that this time will pass – and in the meantime, I will pursue the distraction of fine-tuning the financial fees that I do have control over.

Throwing toothpicks at a mountain … and November 2021 – End of Month Update

Throwing toothpicks at the mountain': Paul Keating says Aukus submarines  plan will have no impact on China | Australian foreign policy | The Guardian
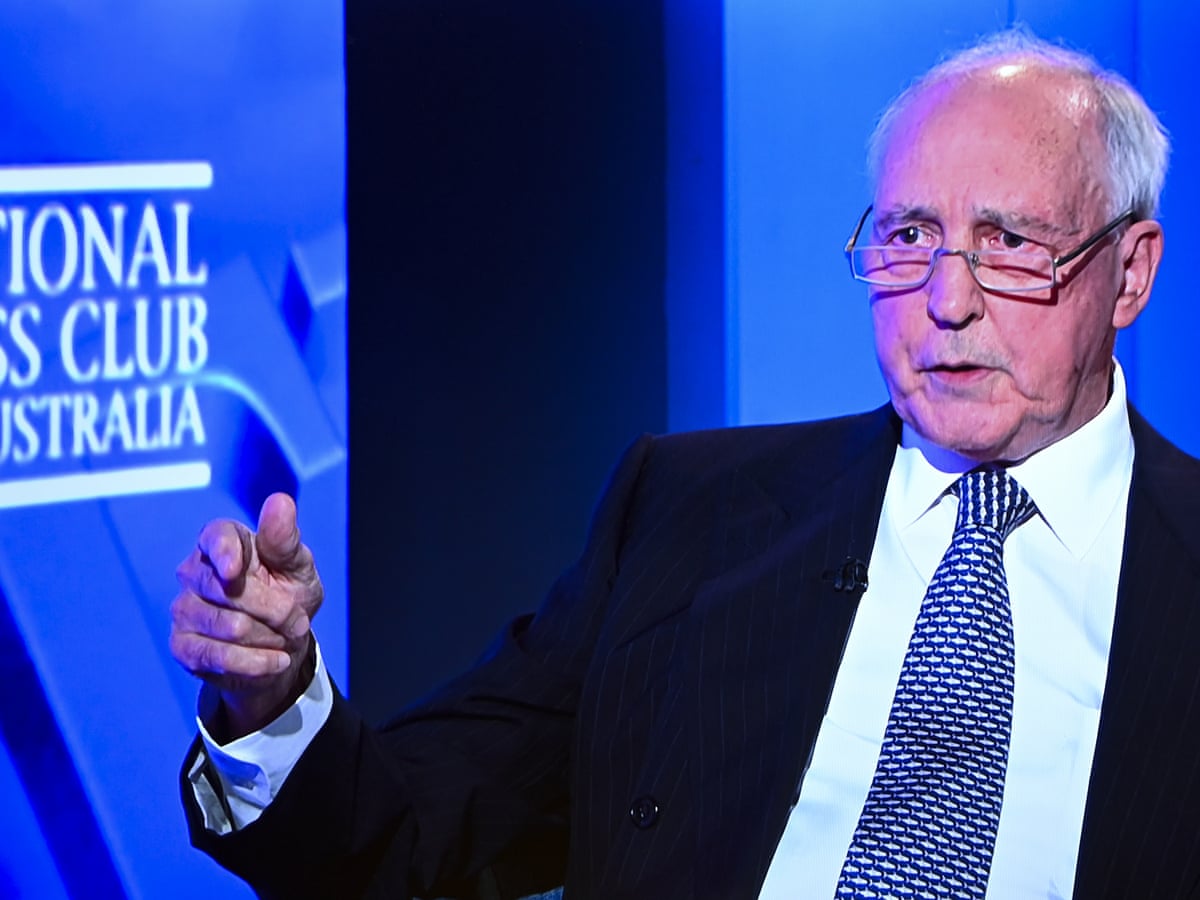
Paul Keating, at the National Press Club in November 2021, likening Australia’s recent announcement of buying 8 submarines as part of our defence strategy against Chinese expansion as “… like throwing a handful of toothpicks at the mountain.” – The Guardian

Paul Keating is an established Slack Investor hero for helping to modernise Australia’s economy and also introduce compulsory superannuation back in the early 1990’s. He has certainly not lost his ability to cut through with memorable quotes. In amongst the barbs at his latest Press Club interview was a compelling message for the need to feel comfortable with Australia’s place bordering Asia. Keating stressed the positive aspects of Australia’s potential for engagement with the region, particularly with Indonesia and China.

Now, back to finance … and the need to engage with our own mountain. At the end June 2021, Australia’s total superannuation assets were $AUD 3300 billion ($USD 2360). This staggering sum is almost 150% of the whole of Australia’s annual Gross domestic product(GDP) for 2021 of $USD 1610.

Australian superannuation fees are still too high

Although it is far from perfect, we should be proud of our superannuation system – it is the fourth largest pension pool in the world – not bad for a small country. But we can do better.

Data collected by the Productivity Commission showed that superannuation fees and costs were at the upper end of global comparators, and significantly higher than pension top dogs, Denmark and the Netherlands

Harry Chemay – Morningstar
From Morningstar: Why has Australia slipped down the global super ranks?

It is difficult to make direct comparisons to other countries as each country has its own quirks. For instance, the average Netherlands worker contributes 22.5% of salary to their defined benefits super scheme – compared to the current rate in Australia of 10% and (hopefully) moving towards 12% in 2025.

There are some structural changes that must happen to make our superannuation system more efficient. A good start is the Australian Prudential Regulation Authority (APRA) introduction of a performance test to identify poor performing super funds. But readers of Slack Investor do not need prompting from APRA – they have already engaged with their super and switched to be in one of the top performing funds.

In a recent speech, Margaret Cole, a board member for APRA, pointed out that Australia has too many small super funds – Of the 156 APRA-regulated superannuation funds, there are 116 funds that each have less than $10 billion under management.

The red ellipse shows the multitude of small superannuation funds that exist under APRA’s jurisdiction. From Margaret Cole – speech to the Financial Services Council webinar

To get costs down there must be much greater consolidation of these toothpicks to achieve economies of scale so that they can be at least a “tree on the mountain”. Unfortunately, each of these funds have their own board, investment officers, and other “hangers on”. Self interest keep them going … not the needs of their clients. Their members must overcome their super inertia and change funds if they are performing badly. Or, the funds need to be told … and regulated out of the picture.

November 2021 – End of Month Update

Slack Investor remains IN for Australian index shares, the US Index S&P 500 and the FTSE 100.

Most markets drifted down this month. The Australian market down -0.9%. The FTSE 100 down -2.5% and the S&P 500 down -0.8%. Slack Investor remains watchful with stop losses in place.

All Index pages and charts have been updated to reflect the monthly changes – (ASX IndexUK IndexUS Index).

FY2021 Nuggets and Stinkers and July 2021 – End of Month Update

It’s not whether you’re right or wrong that’s important, but how much money you make when you’re right and how much you lose when you’re wrong. 

George Soros

Now George knows how to make a dollar and, to his great credit, is a generous philanthropist. I am sure, like any successful investor, that George looks back at times on his investment decisions. Slack Investor looks forward to this time of year when I can reflectively analyse my greatest investing failures. Fortunately, my stinker to nugget ratio was good this year.

The percentage yearly returns quoted in this post include costs (brokerage) but, the returns are before tax. This raw figure can then be compared with other investment returns. I use Market Screener to analyse the financial data from each company and extract the predicted 2023 Return on Equity and 2023 Price/Earnings Ratio on the companies below. This excellent site allows free access (up to a daily limit) to their analysts data once you register with an email address.

Slack Investor Stinkers – FY 2021

Growth stocks (High Return on Equity >15% and increasing sales) are fantastic companies to associate with as they are growing and hopefully, their earnings per share, are growing also. The downside to this is that these companies are usually sought after in the stock market and command high prices in relation to their current earnings because the “future earnings” of the company are priced into the current price. This gives them a high PE Ratio. Whenever there is a future earnings revision, or a stutter in growth, there is usually a dramatic drop in price.

Slack Investor has a look at his stocks every weekend on a free chart program (Thanks Incredible Charts!). I actually pay a small amount to get the chart data early in the morning. Both of my “stinkers” this year were actually “nuggets” from last year. For FY 2020, Appen +58% and A2M +26%. Such is the cyclic nature of some growth stocks.

Appen (APX) -24%

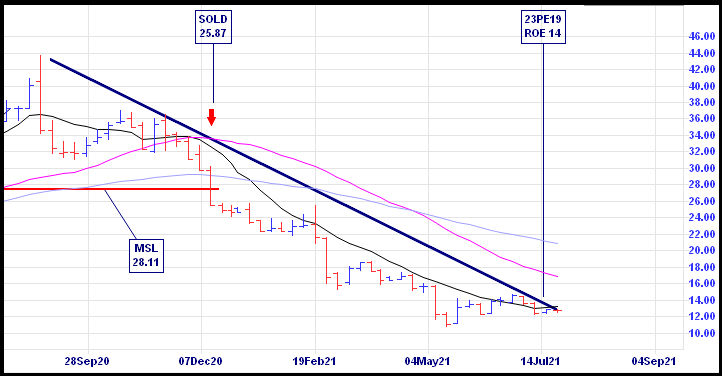
APX (2023 ROE 14%, 2023 PE 19) remains a company that puzzles me “the development of human-annotated datasets for machine learning and artificial intelligence”. The company has had a few problems due to COVID-19 and a hit to its underlying profit and increased competition. Slack Investor got out late last year at $25.87 as the weekly chart moved below the stop loss at $28.11. However, this represented a loss of 24% for the financial year.

The downward trend marked by the thick blue line is setting up niciely for one of Slack Investors favourite chart trading patterns – “The Wedgie”. When the share price punches through a downward trend line of at least 6 months … and the fundamentals are right, Slack Investor is interested. Given the forward PE for 2023 is a relatively low 19 – I might have another crack at this once the price has poked above the blue wedge line.

A2 Milk (A2M) -21%

A2M (2023 ROE 17%, 2023 PE 23) sells A2 protein milk products to the world. The actual benefits of the A2 only protein seem to be limited to easier digestion. Long term independent studies with large data sets are still in the works … but the marketing skill of this company is undisputed. COVID-19 brought big changes to sales with the collapse of the “daigou” market and worries about China trade sanctions. Slack Investor sold about half way through the downtrend – but not before taking a hit for the team.

Slack Investor Nuggets – FY 2021

A great benefit of investing in companies that have a high Return on Equity, and with a track record of increasing earnings, is that they sometimes behave as “golden nuggets”.

Codan (CDA) +161%

Codan - Niramar

What a company! Codan is a technology company that specializes in communications and metal detecting. It has made a major US acquisition this year and paid with cash. Sales are up and predicted to keep increasing. The high 2023 ROE 32%, and relatively low 2023 PE 24 (for a growth company) makes me think there will be more price growth over the next few years – I will try and top up my position this year on any price weakness.

Alphabet (GOOGL) +61%

(GOOGL – 2023 ROE 23%, 2023 PE 23) The Alphabet list of products continues to grow. I use a ton of Alphabet products every day and the company is growing fast into the cloud with cloud computing revenue jumping 46% in the March quarter. There are a few regulatory problems coming up with the US Justice department claiming that Google’s actions harmed consumers and competition. There is also the ongoing work of G7 nations trying to make international tech companies pay their rightful share of tax on revenues in each country.

Despite this, if there is one company that Slack Investor could invest in and then pay no attention to for 10 years, and still sleep well, … it would be Alphabet.

REA Group (REA) +59%

File:REA Group logo.svg - Wikipedia

The owners of RealEstate.com.au. which is the go to portal for house selling and buying (REA – 2023 ROE 38%, 2023 PE 44). The group has just completed an acquisition of Mortgage Choice and picked up a big chunk of a Mortgage software company. This expanding of the business must be good. 65% of Australia’s adult population are checking the site every month looking at property listings and home prices. However, the 2023 projected PE is very high (44). Using the Slack Investor bench marks, suggests the stock is expensive at the moment.

Integral Diagnostics (IDX) +37%

Integral Diagnostics | Medical Imaging Services | Australia | New Zealand

This medical image company (2023 ROE 16%, 2023 PE 24) provides diagnostic image services to GP’s and specialists. IDX seems to be getting a few tail winds with an ageing population and more demand for their MRI, CT and PET scans.

Macquarie Group (MQG) +36%

Commonwealth Bank Macquarie Group Finance Westpac, PNG, 1800x600px,  Commonwealth Bank, Australian Dollar, Bank, Brand, Finance Download

Macquarie is a complex business(2023 ROE 14%, 2023 PE 17) with a range of banking and financial services, and plays in global markets and asset management. The latter division looks for undervalued companies. Despite COVID-19, profits are increasing. The management seem to know what they are doing – Slack Investor remains a fan.

Betashares Global Robotics And Artificial Intelligence ETF (RBTZ) +36%

RBTZ ASX | Global Robotics & AI ETF | BetaShares

This ETF tracks the megatrend of robotics and artificial intelligence. Although the PE ratio is a bit high (2021 PE Ratio 37), this is a disruptive sector that should make gains against existing industries with the advantage of technology against rising labour costs.

Most honourable mentions to those other companies that returned over 20% for the tax year. Cochlear (COH) +34%, BetaShares Nasdaq ETF (NDQ) +33%, VanEyk MOAT ETF (MOAT) +32%, Vanguard International ETF (VGE) +29%, BetaShares HACK ETF (HACK) +31%, Vanguard Asia ETF (VAE) +28%, BetaShares QLTY ETF (QLTY) +25%. To these companies, I am grateful for your service.

Slack Investor Total SMSF performance – FY 2021 and July 2021 end of Month Update

A great year for shares, Chant West reports Super funds have delivered their strongest financial year result in 24 years, with the median growth fund (61 to 80% in growth assets) returning 18% for FY21. The FY 2021 Slack Investor preliminary total SMSF performance looks like coming in at around 22%. The 5-yr performance is a more useful benchmark to me – as it takes out the bouncing around of yearly returns. At the end of FY 2021, the Slack Portfolio has a compounding annual 5-yr return of over 21%.

Slack Investor remains IN for Australian index shares The FTSE 100 had a flat month (-0.1%) but rises in the US Index S&P 500 (+2.3%) and the ASX 200 (+1.1%).

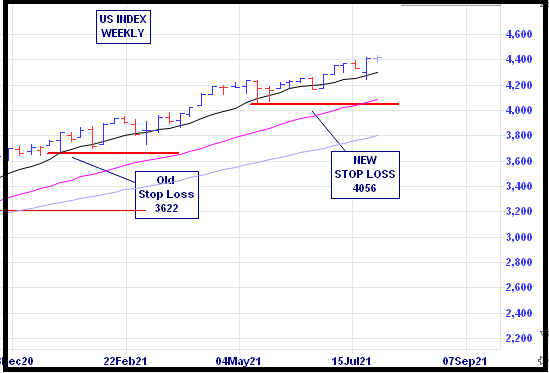
The party with the US S&P 500 just keeps on going. As the S&P 500 has moved more than 20% higher than its stop loss on the monthly chart, I have adjusted the stop loss upward to 4056 from 3622. It is difficult to decide where to put the stop loss on the monthly US Index chart. In these cases, I go to the weekly chart and look for a “sensible place” to put the stop loss coinciding with a minimum value (dip) on the chart. The current stop loss is 8% below the end of month price.

US Index (S&P 500) weekly chart showing a moving up of the stop loss this month.

The US economy entered a recession in February 2020 and has now entered a phase of expansion (since June 2020). Slack Investor is nervous though and has his stop losses live for all Index funds. I will be checking these charts on a weekly basis for breaches of the stop loss.

All Index pages and charts  have been updated to reflect the monthly changes – (ASX IndexUK IndexUS Index).

Lambo and Hanso team up for some Super Reforms … and June 2021 End of Month Update

Jacqui Lambie smiles while hugging Pauline Hanson in the Senate. Senator Lambie has pink nail polish on her fingers
Jackie Lambie “Lambo” and Pauline Hanson “Hanso (?)”, together with Stirling Griff, helped get this new super legislation pass – From ABC News

Slack Investor takes the easy way out and generally stays clear of politics … but the machinations of government often fascinate me. I have followed the development of compulsory superannuation in Australia since its inception in 1992 … so, some recent changes to Australia’s superannuation system has got me off the couch.

Your Future Your Super

Pictured above are a couple of Australian Senators with unusual pasts who have just linked up with a lesser known Senator, Stirling Griff, to help pass a significant super reform. The Your Future, Your Super Bill has just become law in June 2021 by the narrow margin of 34 votes to 30.

… the most significant change to super since its introduction in the 1990s … consumers could expect savings of more than $17 billion once it came into law.

Australian Treasurer, Josh Frydenberg – AFR

There will be a new online comparison tool for super products “YourSuper” set up by the Australian Tax Office- and a range of other changes.

From The New Daily

Super fund to follow you

In particular, I like the stapling of funds to each employee when they get there first real job. For too long, it was the default practice to start a new super fund when you changed jobs. This led to many people having numerous super funds … and multiple sets of fees and insurance. These new laws should eliminate the problem of multiple funds. Slack Investor followers would have already engaged with their super to roll all of their super into one good performing fund. However, this measure will help those who are not as committed to their long term wealth accumulation pile.

Underperformance measures

The default MySuper products will have an annual performance test. The funds that are underperforming will need to write to each member if the Australian Prudential Regulation Authority (APRA) reckons that their returns are less than the APRA benchmarks. Poorly performing funds will be assessed as unable to accept new members. An example of how APRA will pick funds for sanction is shown in their assessment of underperforming funds over 6 years in 2019 below.

APRA applying their benchmarks on performance over 6 years – Super Funds do not want to be in the red zone as they may face APRA scrutiny – From APRA MySuper Product Heatmap

Problems with Your Future Your Super

Not everyone is impressed with this new bill, the Labor party and Greens senators opposed it – the Labor opposition perhaps as it is too beholden to the whim of the Industry funds. There is also some criticism about disability insurance being in some cases industry specific and wise to staple to each industry. But, there is a parliamentary enquiry looking into this.

The underperformance measures also seem a little harsh. Average underperformance by only 0.5% will result in some APRA sanctions. Graham Hand from Firstlinks points to some better ways of managing underperformers which include a more consultative approach by APRA.

There will be some strange unintended consequences. Due to the general disengagement of the Australian public with their super – If your first super fund avoids sanctions, people will generally stay with it. As most people get their first job in retail or hospitality, this will boost industry funds such as REST and HostPlus. The AFR suggests that the Construction and Building Unions Superannuation are expected to be losers under these reforms.

Slack Investor view of the reforms … Mostly Good.

 “(I do not want to) let the perfect be the enemy of the good”

Senator Jacqui Lambie unexpectedly channelling a bit of Voltaire – From AFR

June 2021 – End of Month Update

This image has an empty alt attribute; its file name is trend-1445464__180.jpg

The financial year closes and looking at the 12-month charts for FY 2021 – I am surprised with the vigour of all invested markets. I am all IN for my Index funds!

Solid monthly rises for the ASX200 (+2.1%) and S&P500 (+2.2%) – The FTSE100 flat at +0.2%.

COVID-19 is still a big concern and has caused havoc across the globe – but the wheels of industry and speculation have kept on turning. Despite Slack Investor’s nervousness I remain invested for all followed markets. This is one of the strengths of a trend-following system – it helps overcome any misgivings of the frail human being. More analysis of the financial year in the next few posts.

All Index pages and charts  have been updated to reflect the monthly changes – ASX IndexUK IndexUS Index. The quarterly updates to the Slack Portfolio have also been recalculated.

Ride Your Own Bike

Like Sally, one day the realization will come that your best interests rely on you steering your own bike – in the direction that you want to go!

The ultimate goal is to get your three substantial piles going – house, income and investments. But before any of this happens you have to develop a mindset … I want to be in control of my financial life.

You must gain control over your money or the lack of it will forever control you. —

Dave Ramsey – Author of The Total Money Makeover

If you don’t take control, perhaps you’re plan is to take all your affairs to a financial adviser one day. Most people will feel the need for financial advice at some stage but only 20% of Australians have a financial advisor. The current structure makes getting advice a difficult step – and it’s not the financial advisors fault.

The pricing problem of Financial Advice in Australia

64% of survey participants agreed that financial advisers were too expensive.

ASIC Survey August 2019 – Financial advice: What consumers really think

The Australian Government passed a piece of legislation known as the Future of Financial Advice (FoFA) in 2012. FoFA was a series of laws that were supposed to improve the quality and transparency of financial advice. One of the main purposes was banning conflicted remuneration – where advisers were recommending products that gave them good commissions. While FoFA and the Hayne Royal Commission were well intended and vital in restoring some trust in the sector – there have been some unintended consequences.

(The Financial Services Royal Commission) identified the problem of conflicted remuneration without providing a mass market solution.

Graham Hand, Firstlinks – FoFA, the Failure of Financial Advice

There has been a huge rise in regulatory red tape and the associated compliance costs for financial planners. A combination of these costs, the big banks dumping their financial advice arms, and the need for upgraded qualifications has put this sector in crisis. The total number of licenced advisers is set to drop by a third in the next few years.

There is broad recognition that financial advisors have expertise that the normal punter does not have. However, the biggest barrier to getting financial advice is the expense. One of the big problems is that when you engage a financial advisor, they are obligated to present you with a full Statement of Advice (SOA). On the surface this makes sense, the client would want a document that takes into account your own circumstances and outlines the fees and risks of each strategy. However, according to one planner, the SOA has turned into pages of jargon, repeated disclosure and boring generic graphs. These statements are weighty tomes that take many hours to prepare. Sadly, they seem to confuse the actual advice and provide no real value to the client.

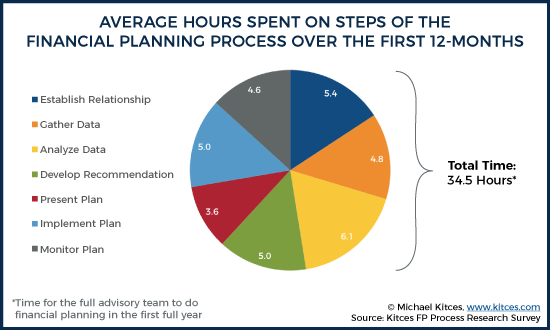
A full Statement of Advice (SOA) runs over 100 pages and the need to review all circumstances and develop a plan takes 10 to 15 hours and costs between $3,000 and $5,000 depending on complexity.

Graham Hand, Firstlinks – FoFA, the Failure of Financial Advice
From FirstLinks – FoFA, the Failure of Financial Advice, Take 2

James Kirby from The Australian uses the example of paying annual adviser fees fees of $3000 and he supposes that the structured advice that you receive will match the 4.3% pa return of the new Magellan retirement income product Magellan FuturePay (FPAY). He points out that for an investment of $500 000 and an expected FPAY return of $21 500, your advice fees would be 14% of your earnings. This does not make sense to him … or Slack Investor.

James Kirby suggests that a better model for the regulators to adopt would be that you could approach a financial adviser for advice that you need at the time … and pay the financial adviser for this “niche” advice. This is not possible under current legislation.

Take charge

So, with full service financial advice gravitating towards high net wealth clients, what is the average punter supposed to do? Robo-advisors such as Stockspot could be part of the solution. This automated service can provide help with allocation of assets other services that will suit your age and risk profile. But there are so many more financial questions you might want to handball to your financial adviser if you could afford one. Well, if you can’t … it’s up to you.

Decide what you want to achieve in the finance sense. Go through the savings basics and get your savings rate up. Take charge on where your money goes, get your superannuation set, reduce any unnecessary fees that you are paying, set a target on your financial piles.

Educate yourself on things financial. There are some great books. The Barefoot Investor is an excellent start. Some fabulous podcasts The Australian Finance Podcast will get you going and there are heaps of other Slack Investor favourites. Get involved and start to enjoy the immense freedom and satisfaction of riding your own bike.

Happiness is not in the mere possession of money; it lies in the joy of achievement, in the thrill of creative effort.

Franklin D. Roosevelt

Two Very Important Numbers

There are many numbers to note in finance world – Fees, Investment returns, etc. However, there are two extremely important numbers when it comes to financial independence. Both are percentages and the first one is the 4% “rule of thumb” and the second is your savings rate.

The 4% Rule

All followers of finance blogs would have heard of this often quoted “rule” Slack Investor acknowledges that this magic number is arguable and depends on individual circumstances but, it is an excellent way to estimate how much you will need to retire. The 4% rule is a way to “roughly” link assets with income. For example, as an estimate, if you would like to generate a $40 000 yearly income, you would need to have investments assets of $1 000 000 to earn this income using the 4% rule (4% of $1 000 000 = $40 000).

Another way of looking at this 4% rule is that you need to save 25 x your annual spending for your retirement fund so it can generate an income to cover your spending. So, if you spend $30 000 a year, you need a portfolio of $750 000 (25 x $30 000). To get an idea about what your expenses are it is important that you track them over a year using a spreadsheet or finance software. If necessary, this investment income can always be supplemented by a government pension or a part-time job.

Bill Bengen originally came up with this “4% safe withdrawal rate” in 1994. He developed it by backtesting a conservative US portfolio with data dating back to 1920 and tried to get a safe withdrawal rate that would generate an income for at least 30 years. He is the first to admit that the 4% number was always treated too simplistically and has since updated the rate to be closer to 4.5%.

Slack Investor is a bit old fashioned in liking to hold on to most of the capital that is earning the money and has a flexible approach to how much to extract from investments each year. In a good year for the stock markets, I am happy to dig deep into the investments pile – using dividends, distributions and even some capital gains as income. When the market performs poorly, it is more complicated and I have to dip into my stable income pile. Most of the Slack fund is in Australian Investments and in 2021, the Australian Index has a 12-month forward dividend yield of 3.5% . Hopefully, the shares will also increase in value over time. Over the past 10 years, Australian shares had a total return of almost 7% – with growth shares you can aim higher, but prepare for volatility. In the good years, I will also take out a bit of capital gain for extra spending. All of this is in addition to the stable income component of my investments.

Your Savings Rate

“Wealth consists not in having great possessions but in having few wants.”

Epicetus

Using the 4% rule we estimate how much will give us a sustainable retirement. But there is another number to add to our arsenal.

Just as in Lord of the Rings there is ” one ring to rule them all…”, there is also one “percentage” to rule them all in the Financial Independence world – and that is the Savings Rate percentage.

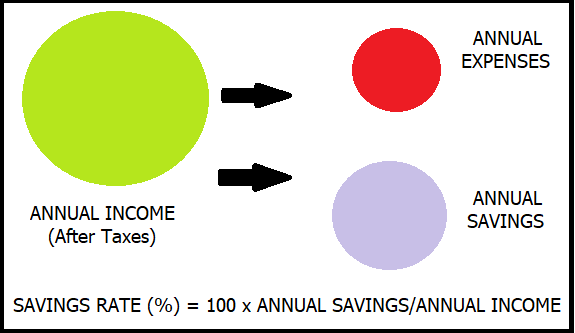
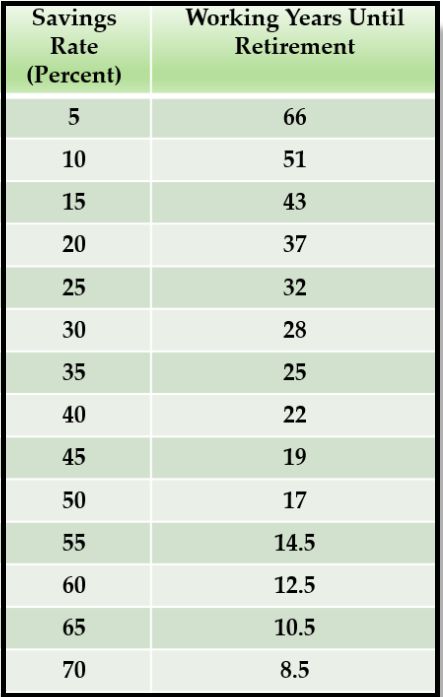
The annual expenses is critical here as this is the figure you are trying to generate out of investment income. Lets have a look at the effect that savings rate has on the number of years that you have to work until you can sustainably generate your expenses from your investments. The table below is from the great financial blogger Mr Money Mustache. There are a few assumptions used to generate this table

Here’s how many years you will have to work for a range of possible savings rates, starting from a net worth of zero:

At a saving rate of 10% you will have to work for over 50 years – we have to do better than that! There are some pretty heroic savings rates amongst financial bloggers e.g Aussie Firebug 61%; Dividends Down Under 61%; I have admiration for these savings rates and note that these bloggers are in a hurry to get to financial independence – and retire early. At 60% savings you can retire after 12.5 years of working and saving – but that sounds pretty hard.

Slack Investor was on a much slower train and lucky that he quite enjoyed his job – and didn’t mind spending 30 years saving for his retirement. I have always been a good saver but, when looking at my past savings rates, it was usually around the 30-40% level and, some years had dropped down to 20%. Raising a family and holidays are a delightful interference with savings and you just have to find a balance. In Australia, we have compulsory superannuation which currently adds a welcome 9.5 % to your savings rate.

A beautifully presented calculator at Networthify shows how the savings rate works and gives a yearly breakdown. It also shows some interesting OECD statistics for average National savings rates (e.g. The US 6%, and India 32%). The aim is to eventually save enough money to invest in a way that you average (at least) 5% return on your investments after infation. If you withdraw from this retirement pool at the rate of 4% and have enough to cover 100% of your expenses – you become financially independent – the retirement pool keeps on giving!

Automate your savings

One of the best financial habits that I formed was to take the thinking out of saving and set up automatic recurring transfers from my work money to my savings or investment accounts – Pay Yourself First. I also took full advantage of “concessional contributions” to my super account which were taxed at 15% rather than my then marginal rate of 37%.

So, automate your savings. Investment returns are important and we hope that we can exceed the 5% after inflation returns that the above table and 4% rule are based on. However, the number you have most control over is your savings rate – and that is most important.

Household Comfort … and March 2021 – End of Month Update

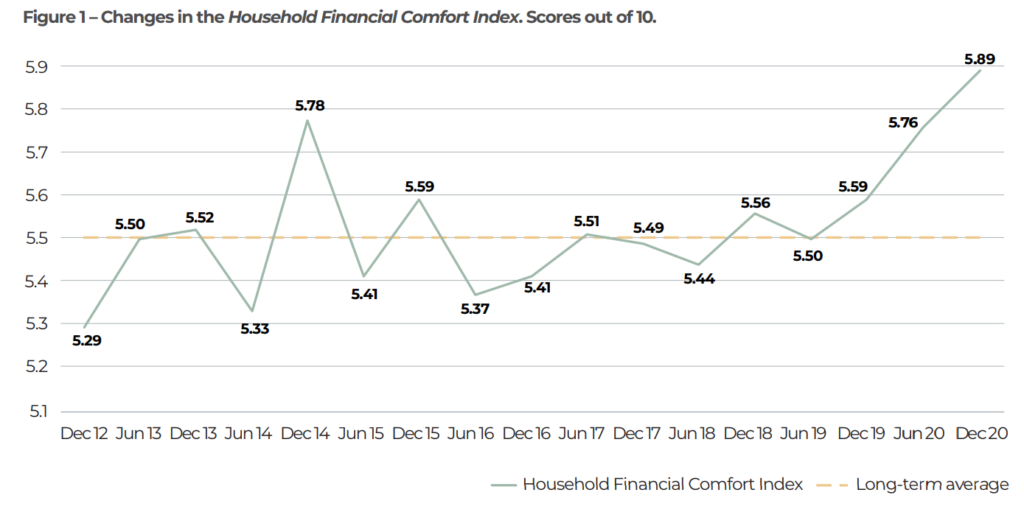
The couch seems to be looking good for some, but not for others. ME Bank have updated the annual Household Financial Comfort Index that surveys 1,500 Australians every year to get an idea of how Australia is travelling in a money sense. Slack Investor was surprised at the research results which revealed that over the past six months, to December 2020, the “financial comfort” of Australian households has reached a record high of 5.89 out of 10. This index is 5% higher than before COVID-19! However, it is full-time workers that report the highest financial comfort across the workforce.

The changes in the Household Financial Comfort Index since 2012 (Scores out of 10) – ME Household Financial Comfort Report 2020

The high financial comfort can probably be linked with some households going into “savings mode” as the uncertainty caused by COVID-19 on the economy, and the very high levels of government support.

Although, not everyone feels the same after a year of COVID-19. About 30% of households said that their financial situation has worsened. Clubs, pubs, gyms, air transport, restaurants, education, and the creative arts were hit particularly hard – with the cohorts of casual workers and adults under 24 shouldering the burden of Coronavirus disproportionally.

Household Response to the Pandemic

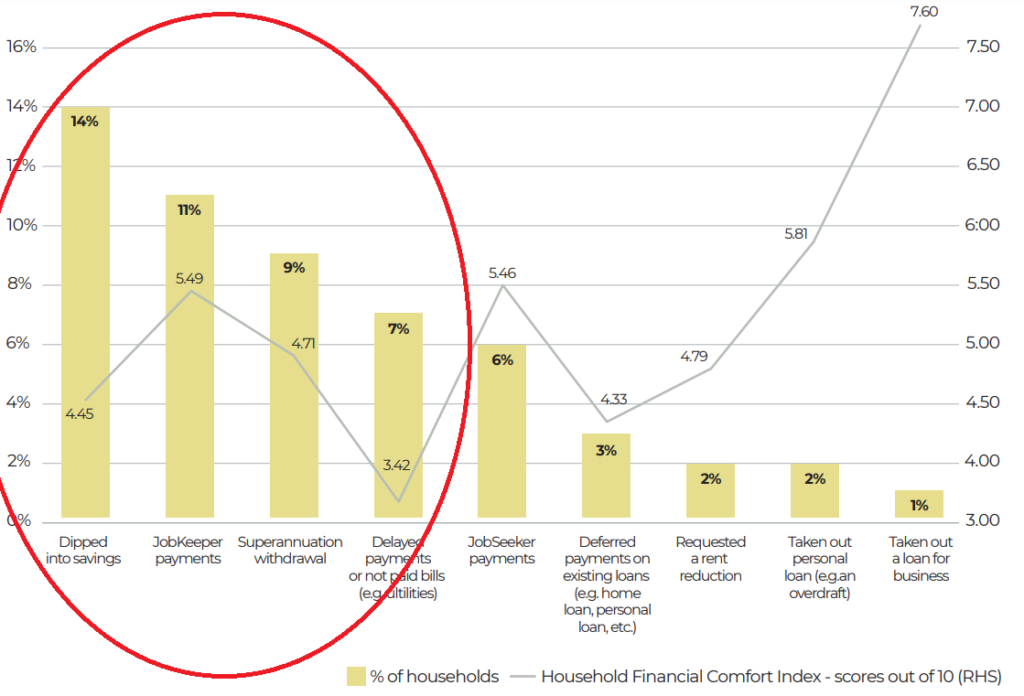
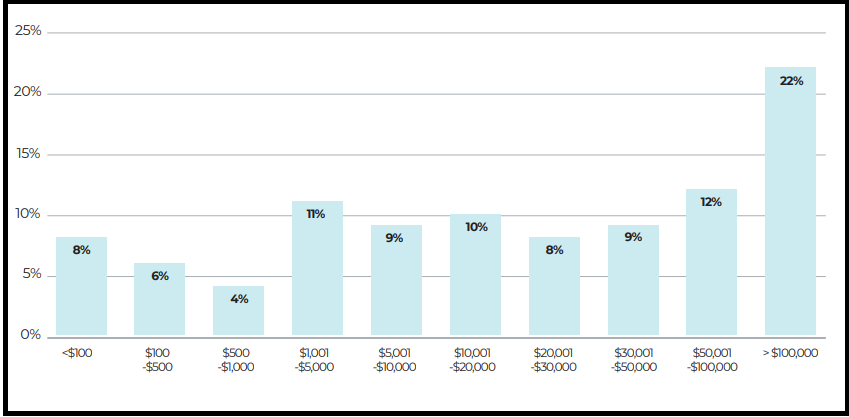
The main method that households used to ease the financial burden during COVID 19 (Columns %) and the line showing level of financial comfort associated with each method – ME Household Financial Comfort Report 2020

The main ways that households chose to ease the effects of the pandemic were 1. Dipping into savings (14%); 2. JobKeeper payments (Govt. wage subsidy) (11%); 3. Superannuation withdrawal (9%); 4. Delaying bills (7%). With JobKeeper payments having now ended, the raid on super halted, and the other main methods likely exhausted, it looks like a tipping point is approaching.

“And, at $90 billion, (JobKeeper) it’s the single largest economic support program that any Australia government has ever undertaken.”

Australian Treasurer Josh Frydenberg – ABC News

The Australian government’s massive JobKeeper program ending is likely to cause a big rupture in the economy with many small businesses who have, till now, been just “hanging on “. Many of these businesses are likely to cease trading. For employees, Treasury estimates that up to 150,000 workers will move from JobKeeper into unemployment.

Financial Cushion

With tough times ahead, there will be many who would wish for a financial cushion. Slack Investor has often banged on about the need for an emergency fund of cash that will help when one of life’s inevitable bits of bad new turns up. In December 2020, about one in five households reported virtually no, or very low, amounts of cash savings (<$1000).

How much in cash savings does your household currently hold – including savings accounts, term deposits and offset accounts? – ME Household Financial Comfort Report 2020

As for the pandemic effect on retirement savings, the reality of individual super balances is starting to bite with the report revealing that only around 18% of households expect to fund retirement with their own superannuation and 42% expecting to use both private savings and the government pension.

“Financial comfort levels are up for now, but many households
are on the cliff’s edge. They’ve lost income, their jobs and entire
livelihoods, their wafer-thin savings buffer is dwindling, and government support is the main action stopping them from falling over.”

Household Financial Comfort Report – 2020 ME Bank survey

March 2021 – End of Month Update

Slack Investor remains IN for Australian index shares, the US Index S&P 500 and the FTSE 100. All Slack Investor followed markets this month had solid rises (ASX 200 +1.8%; FTSE 100 +3.5%; S&P 500 +4.2%).

In these uncertain times, especially with the high prices on the US market, I am monitoring my index funds weekly and if, at the end of the week my Index funds are below the stop loss, then I will put a post on the blog and sell at the next opportunity. All Stop Losses are Live.

All Index pages and charts  have been updated to reflect the monthly changes – (ASX IndexUK IndexUS Index). The quarterly updates to the Slack Portfolio have also been completed.

Three Pile Theory

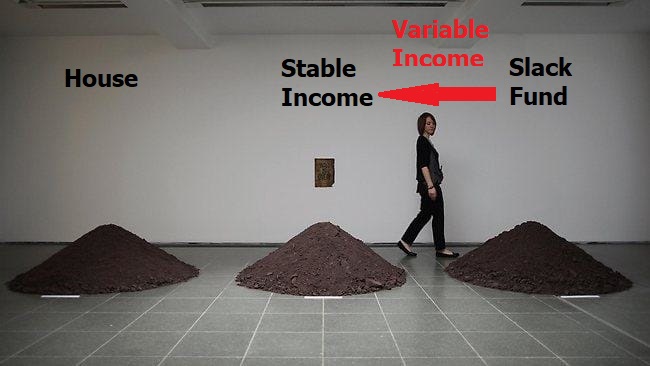
– Adapted from  ‘Three Mounds’ by Yoko Ono is displayed at the Serpentine Gallery on June 18, 2012 in London, England – From Getty Images.

With apologies to Yoko for interfering with her art, but Slack Investor first thought of his own “Three Pile Theory” back in 1989 when I had got myself a “Proper Job” and enough stability in my life to make the big plunge into Real Estate. At that time, I owned a few grains of dirt in my House pile (the Bank owned the rest), My income was OK, and my investments (which would later morph into the Slack Fund) contained a few thousand dollars in shares.

Now, 32 years later, Slack Investor still has these three financial pillars to keep himself steady.

  • House – Home ownership gives me great security and pleasure. The bank owned most of this 30 years ago – but now I have the upper hand! (~30% of Net Worth)
  • Stable Income – This used to be my job, but in retirement I have some stable income annuity style investment (~20% of Net Worth) that would pay my bills and maintain a basic Slack Lifestyle should Armageddon befall the stock markets for a few years. This income is supplemented by income from the Slack Portfolio.
  • Slack Portfolio Investments – (~50% of Net Worth) – Now currently in my Self Managed Super fund (SMSF) which is almost exclusively invested in growth companies. These are great businesses to be invested in if you have a long term horizon – however, stock prices can be volatile in these high Return on Equity (ROE) companies. I am currently retired and do not rely on the Slack Portfolio for stable income. Because of the stability of my other two pillars, I can be quite aggressive in the allocation of my investments in the Slack Portfolio – as I know I will not have to panic sell (for income) during any downturn.

Slack Investor didn’t really invent “Pile theory” – it has been around for a while in various guises – Three Buckets is a tried and true way to manage your retirement expenses by dividing your retirement stash into buckets of cash, conservative investments and more risky, growth investments.

House

My home may not feel like a palace to you, but to me, it is a whole Kingdom.

Prerona Chatterjee

There are some who argue that you are financially better off by renting over a 10-year period rather than buying. But for Slack Investor, the tax advantages – no capital gains tax on your own home in Australia; the leverage – banks are usually willing to lend at least 80% of the house value; the forced saving – your mortgage payment is a big monthly portion of your income which you set aside for a long period; and, the stability provided by home ownership make this a clear winner for me. “The Serenity” is just a bonus.

Stable Income

To cover living expenses and to give yourself “peace of mind” it is so important to have a slab of money that is not subject to the vagaries of the sharemarket. In Australia, if you haven’t enough super to go independently, you might qualify for a full or part pension.

If going the fully self-funded route, many advisors recommend your stable income should be in two parts. You should work out your living expenses for a year and then keep between 2 and 5 years worth of expenses in stable cash deposits – Let’s start with 3 years of expenses in accessible cash. The rest of you stable income pile can be in longer term cash deposits, bonds or REITS. Because the investments pile (Slack Portfolio) is in growth shares that can be very volatile, my stable income must be something that is not highly correlated to to the sharemarket.

Term Deposits– although interest rates are woefully low now on bank term deposits, it is still possible to get ~1% p.a. from some of the minor banks that still have the Government Guarantee for the first $250 000.

Vanguard Australian Fixed Interest Index ETF (VAF)

MER (0.20%) – Annual performance over 1/5 years – (3.81%/4.41%)

Vanguard Australian Government Bond Index ETF (VGB)

MER (0.20%) – Annual performance over 1/5 years – (4.08%/4.49%)

Challenger Fixed Term Annuity – Rates are pretty low at the moment, locking away a deposit for 5 years will earn a measly 1.65%.

Real Estate or Real Estate Investment Trusts (REIT) – these are a bit higher up the risk curve but as they produce income (rent) and can be associated with longer term leases – are usually less volatile than the share market. For example, Vanguard Australian Property Securities Index ETF (VAP) – MER (0.23%) – Annual performance over 1/5 years – (-13.3%/6.23%)

Investments – The Slack Fund

Because the Slack Portfolio is mostly in growth shares, I have steeled myself that this particular pile is volatile and changes value every day. I am prepared for a few low performing (or even negative) years in a row for this pile. Even great investors that have much more knowledge than Slack Investor have the occasional bad year – during some periods, share investments just perform poorly. I am accepting of this truth.

Because this Investment pile is mostly in my Self Managed Super Fund (SMSF), I am usually obliged to withdraw 4% of its total value each year – this percentage increases with age – but this payment is currently tax free for those over 60. I can use this income in a discretionary way. My living expenses should be covered by income from the Stable Income pile – and any other income is gravy.

Pile Rebalancing

Once you are in a house that you are happy in and hopefully will be near paying off any outstanding loans as you get into retirement – other than maintenance, you can leave this pile alone.

The Stable Income cash pile might occasionally need a bit of topping up from the longer term stable Income or Investments fund. Any dividend or interest income from your investments is fair game. The investment Slack Fund usually produces 2 -3% income.

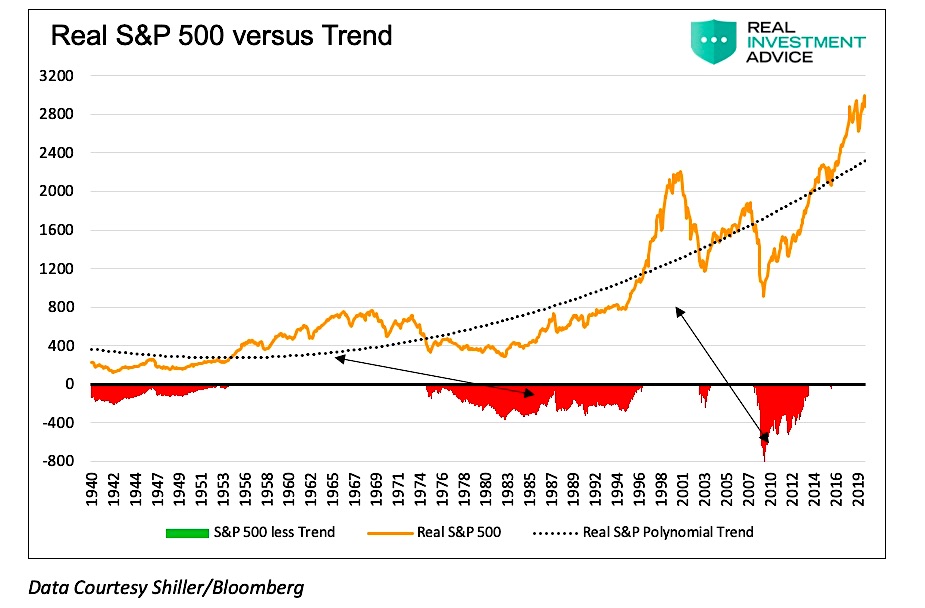
Hopefully, with 3-years worth of living expenses in the stable income pile, you can ride out a few bad years in the share market and only sell shares to top up the stable income pile when the share market has had a good run. Ideally, you would only sell share assets out of this pile when the share market is above the long term trend line. However, realistically, from the chart below (in red) there are long periods when the market is below trend. Have no fear, your basic expenses are always covered by a mixture of stable income, interest and dividends.

The long term chart of the US S&P 500 with the dotted inflation-adjusted long term trend line – from seeitmarket.com

There are other piles worthy of attention such as Health and Relationships but the finance stuff is necessary too. So get the shovel out … and start working on those piles!

SMSF is it a superpower OR Kryptonite? … and January 2021 – End of Month Update

Image from Finfit Wealth Solutions

Slack Investor hasn’t written much about Self Managed Super Funds (SMSF’s) despite his love affair with his own fund. SMSF’s are only found in Australia and represent a “hands on” way to accumulate, nurture, and eventually release your super funds as a pension or lump sum. They have the same status as a normal retail or industry super fund (e.g. Australian Super) but they are “self managed” and give the trustees (members of the fund) power over where the fund is invested. This control is a double edged sword, as it is also possible to destroy your super wealth with a SMSF by making unwise investments.

SMSF’s offer

  • Control
  • Flexibility in investments – But this can be dangerous!
  • Estate Planning and Taxation advantages

There are nearly 600,000 SMSFs in Australia with over a million member (March 2020). Although this represents less than 5% of Australia’s population, about 25% of the $2.7 trillion invested in superannuation is invested in SMSF’s. The average member balance for an SMSF was a whopping $678,621 (ATO Data 2018).

It is possible to structure an SMSF so that the investment fees are very low. A surprising finding from a SuperConcepts study was that the average annual expense ratio for SMSF’s was 2.8% for the  over 20000 funds surveyed. This seems particularly high when compared to the Slack Investor SMSF portfolio expense ratio of 0.12%  through a “no advice” online SMSF services provider like e-superfund. This suggests that most of the funds surveyed used the relatively high cost route of engaging an accountant to administer the fund. There are many SMSF providers – Slack Investor uses e-superfund which provides the legal structure and web-based audits and education. The yearly operating expenses are an amazingly low $999. The SMSF is so integral to Slack Investor’s strategy that I have set aside an SMSF page on the Slack Investor site – Alas, there is not much on there yet … but it will come!

Rainmaker are producing monthly comparisons of SMSF’s with the larger low cost My Super products offered by Industry and Retail Super Funds. The analysis can be found on their Superguard360 site.

SG360Jun17_2
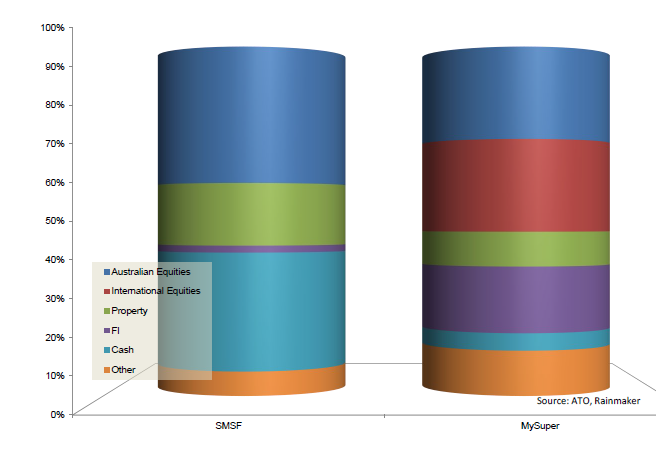
A comparison of the Asset mix of SMSF funds (left column) with MySuper funds – From Superguard360

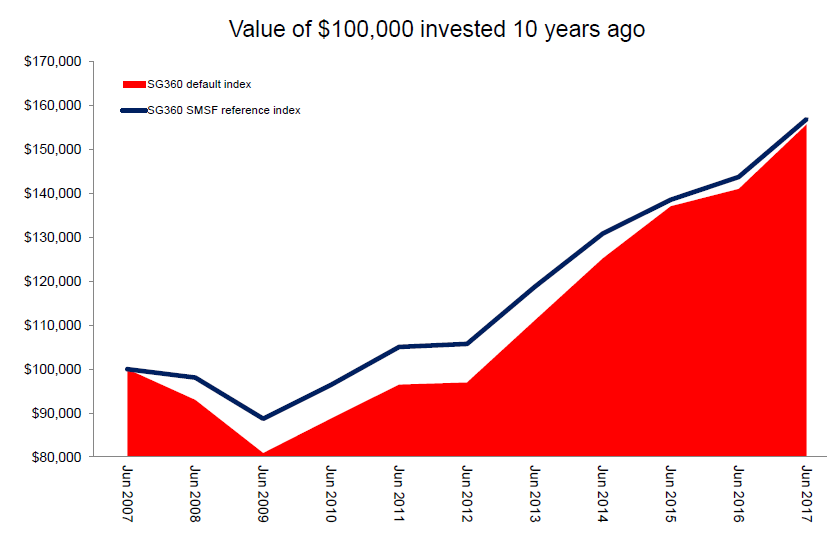
SMSF funds (above left) traditionally hold more cash, property and less international shares than the larger Industry/Retail funds (My Super – above right). SMSF’s have outperformed MySuper since the GFC (see below, SMSF’s Blue line, My Super Red block). However, with the recovery of equities, the MySuper funds have been catching up and as at June 2017, 10-year returns from both types of funds are near identical at 4.2%. Under current asset allocations, the more diversified Industry and retail funds should overtake SMSF performance – on average.

SG360Jun17_1
Comparison of how SMSF’s (Blue Line) have done , on average, against the default My Super Fund Index (Red Block) – From Superguard360

Self Managed Super is NOT for Everyone

“… That a little knowledge is apt to puff up, and make men giddy, but a greater share of it will set them right, and bring them to low and humble thoughts of themselves.”

From an anonymous author, published in 1698 as The Mystery of Phanaticism

Running a SMSF takes time and I wouldn’t recommend it to anyone that doesn’t want to be fully engaged with their financial future. Luckily, Slack Investor finds the whole finance and ATO compliance scene most interesting. Trustees of SMSF’s are held responsible for compliance with super and tax laws and there are many other risks in running a SMSF fund. A long term study of SMSF data by SuperConcepts, “When Size Matters” found that that SMSF’s below $200000 in total funds generally underperformed. However, the larger SMSF’s were comparable in performance with industry funds.

Over 10 years, there’s hardly any difference between the performance of not-for-profit funds, such as industry funds, and DIY (SMSF) funds.

SMH article (2017) summarising Rainmaker data from the ATO

Despite how well an SMSF style really suits Slack Investor – The large majority of people should not get into an SMSF – but stick with a good performing Industry Fund. Unless you are justifiably confident in your investing abilities, most people will be better of with a well diversified industry fund for long-term Super performance. It is always better to “have low and humble thoughts of ourselves” – it is too easy to destroy the value of your hard earned super.

January 2021 – End of Month Update

Slack Investor remains IN for Australian index shares, the US Index S&P 500 and the FTSE 100.

Some tested COVID-19 vaccinations have started to be rolled out internationally – but uncertainty prevails. Slack Investor followed markets all fluctuated but, overall, remained pretty flat this month. For January 2021, the Australian ASX 200 rose 0.3%, the S&P 500 fell 1.1%, and the FTSE 100 down 0.8%.

All Index pages and charts  have been updated to reflect the monthly changes – (ASX IndexUK IndexUS Index).