April 2019 – End of Month Update … and, Lets Get Concessional

Slack Investor remains IN for Australian index shares, the US Index S&P 500 and the FTSE 100.  Bumper times this month.

There were rises in all  Slack Investor followed markets (ASX200 +2.9%; FTSE100 +1.3%;  S&P500 +3.9%).  All Index pages and charts  have been updated to reflect the monthly changes – (ASX Index, UK Index, US Index).

Concessional Contributions – Lets Get Concessional!

Thanks Jane … You are inspirational to our financial independence – From deskgram.net

If you are just starting your savings program or getting your house deposit together, then this is another higher order issue to leave alone. If you have got the basics organized and have a good chunk of equity in your house, and looking to boost your super in a tax-effective way – then tune in to this super boost before the end of tax year.

Concessional contributions include your employer’s compulsory super guarantee contribution of 9.5% and any salary sacrifice contributions that you make. They are called “concessional” contributions because they go into your super account from your before-tax income and are taxed at the “concessional” rate of 15% rather than your “marginal” rate. You are not allowed to exceed the $25,000 cap on concessional contributions, so it is important to get your sums right.

For a gross salary of $90,000, your employer pays the 9.5% super guarantee of $8,550 to your nominated super fund. That means you have up to $16,450 ($25,000 -$8,550) left on your cap to concessionally contribute to super before June 30 – to save on tax and boost super.

Salaried workers can concessionally contribute by using salary sacrifice, but this involves prior employer agreement and using a salary packaging company to do the administration. Some of the contribution rules have relaxed since July 2017 and you can now contribute by Personal Contribution. There are pros and cons of each contribution method, but as personal contributions don’t need the agreement of a third-party, I find this much easier to do.

You will have to let your super fund know that you are claiming a tax deduction for this contribution. Use a standard ATO personal contribution form or, it is simpler with some super funds where an online application is all that is needed. You must get your contribution to land in your super fund before the June 30 deadline.

Benefits of salary sacrifice and additional concessional contributions

If your marginal tax rate is higher than 15%, making extra super contributions can reduce your tax. For the $90,000 a year example, your marginal tax rate is 32.5% + Medicare levy. Concessional super is taxed at just 15%. If your marginal tax is higher, you can save more. Industry super has a calculator where you can enter your own figures. For the case above, a 45-year-old will have a tax saving of $3222 this year and an extra $405,000 at retirement by maximizing concessional contribution.
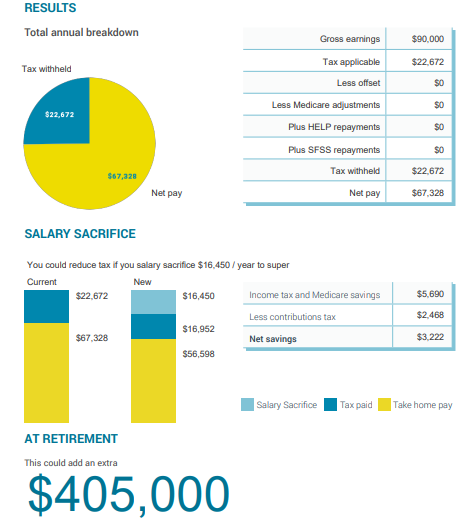
From the Industry Super Funds Calculator for a 45-year-old on $90,000 who maximizes their concessional contributions and save $3222 this year – and ends up with an extra $405,000 at retirement with these assumptions.

Let’s get concessional, concessional,
I want to get concessional,
Let’s get into concessional,
Let me hear your body talk, your body talk …

Many apologies to Olivia Newton John … for real inspiration, check out the Olivia on youtube

Slack Performance … Not So Slack

Last post I described a change to the Slack Method for managing Index funds. Index “whole market” funds are just a small part of my share portfolio – about 3%. The bulk of my share market exposure is in individual growth companies.

Slack Investor is a great believer in measurement and is most un-Slack when it comes to record keeping and recording his investment results.

Lord Kelvin at 22 (c) Glasgow Museums;

If you can not measure it, you can not improve it

Attributed to Lord Kelvin … his more verbose quote is here

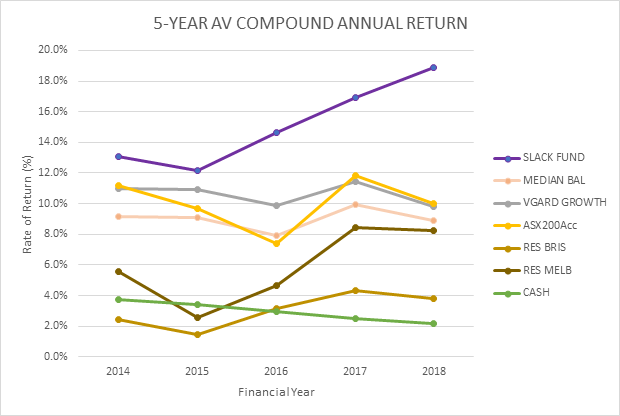
My main cycle of measurement is at the end of the tax year in Australia, June 30. Because the results of one-year performance can be a bit misleading. I am much more focused on results over 5 years as these longer term measures are more meaningful to the investor. The benchmarks I have used have been mainly sourced from the excellent NetActuary site. A shout out to the low cost Vanguard Growth Index Fund. When I tire of investing in individual companies, this (or Vanguard ETF’s) is the type of vehicle that would be a good resting place for funds that require minimal supervision.

The SLACK FUND 5-yr average compound return vs BENCHMARKS. The Median Balanced Fund, Vanguard Growth Fund, ASX 200 Accumulation Index, Residential Property median in both Brisbane and Melbourne, and Cash (Online bank Interest)

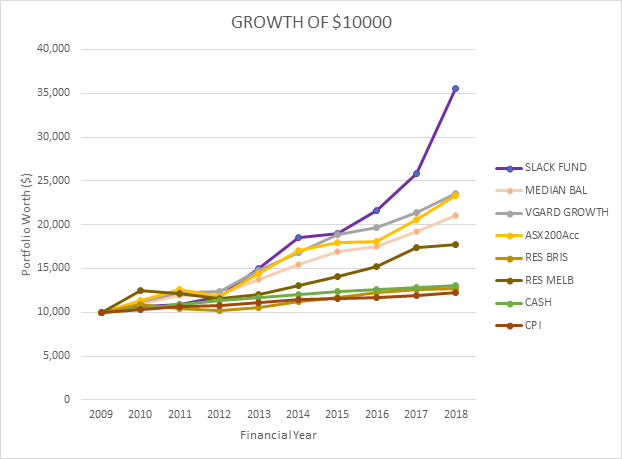
A good way of measuring growth is comparing $10000 invested in the Slack Fund in the 9 years since 2009 against benchmarks.


The SLACK FUND growth of $10000 invested October 2009 vs BENCHMARKS. The Median Balanced Fund, Vanguard Growth Fund, ASX 200 Accumulation Index, Residential Property median in both Brisbane and Melbourne, and Cash (Online bank Interest) and Consumer Price Index (CPI)

Year by year results are presented in table form below. I will add results at the end of each financial year and put them on The Slack Way page.

YEARSLACK FUNDMEDIAN BALVGARD GROWTHASX200AccRES BRISRES MELBCASHCPI
20106.69.812.313.18.524.34.23.1
20112.58.79.111.7-3.6-2.04.43.7
20128.30.41.3-6.7-2.7-4.84.31.2
201326.514.718.622.83.73.33.22.4
201423.612.714.517.46.89.32.63.0
20152.49.611.85.73.47.82.51.5
201614.22.84.20.64.98.22.21.3
201719.510.48.814.13.013.81.91.9
201837.69.210.013.01.12.31.82.1

For this site I have only presented my share trading results since 2009. Any cherry-picking of data to avoid the terrible investing years of 2008 and 2009 is coincidental. Out of the ashes of the Global Financial Crisis (Great Recession), 2009 is the year that I started my Self Managed Super Fund (SMSF Slack Fund) and from which I have independently audited results. For the record, prior to 2012, I was not what I regard as a very successful investor. My investments for the 2003-2011 period performed worse than the Median Balanced fund on 6 out of 9 occasions.

What changed? I started to go to a local investment class which made me re-evaluate my investment method (Thanks Robbie Fuller!)

  • Took a more disciplined approach to investing by documenting everything and having weekly and monthly and yearly chart reviews of my investments
  • Tried to reduce confirmation bias from my portfolio – i.e. I bought this stock for a good reason … I am smart … the price has gone down … the market must be wrong! – I would score myself 5/10 on this goal!
  • Started using charts and stop losses extensively.
  • Started investing mostly in growth companies that have some barriers to entry for competitors (moats) – Companies with manageable debt, with future PE less than 25 -30, and with a return on equity (ROE) of >15%
  • Before investing in an individual company use both fundamental analysis (Thanks Market Screener) and technical (chart) analysis (Thanks Incredible Charts) before I make a buy order.
  • Tried to follow the Peter Lynch approach to my portfolio. Selling the bad performers (weeds) and trying to add to my position on stocks that are doing well (flowers).

You won’t improve results by pulling out the flowers and watering the weeds.

Legendary Investor Peter Lynch from quoteswise.com

Investing in growth companies can have its despairing moments and I cannot guarantee that the Slack Fund will continue to outperform the benchmarks … but, the results, so far, are good.

March 2019 – End of Month Update … and Revised Slack Index Method

Slack Investor remains IN for Australian index shares and IN for the US Index S&P 500. The dogs’s breakfast of Brexit still weighs heavily in my mind but I am buying back IN for UK Index shares – as the FTSE 100  has shown remarkable resilience to the fraught politics of Brexit and displayed a monthly uptrend. I will buy back IN to the FTSE at near the end of March value of 7279 (See UK Index Page).

There were rises in all  Slack Investor followed markets (ASX200 +0.2%; FTSE100 +2.9%;  S&P500 +1.8%).  All Index pages and charts  have been updated to reflect the monthly changes – (ASX Index, UK Index, US Index).

The Slack Monthly Index Trading Method – Revised

Last month I mused about the diminishing returns of the Slack Monthly Index Trading Method. I am still outperforming the “Buy and Hold” investor in all followed markets – but the advantage is slim. Per annum outperformance is 2.9%, 1.2% and 1.1% for the ASX, UK and US markets respectively. Not really fantastic results when you consider that I am missing out on the “buy and hold” dividends for the times when I am out of the markets.

The Slack Index method was devised with a lot of back-testing on 30 years of market performances and does really well when sustained bear markets occur as it gets out of the market at a hopefully early stage in the price downturn. Ideally, the Slack method should stay in the market for the smaller fluctuations (corrections <~10%) and get out of stocks before it becomes a full bear market. The problem with my current strategy is that I am getting “whipsawed” out of the market in these smaller downturns.

Connection between US Bear markets and Recessions

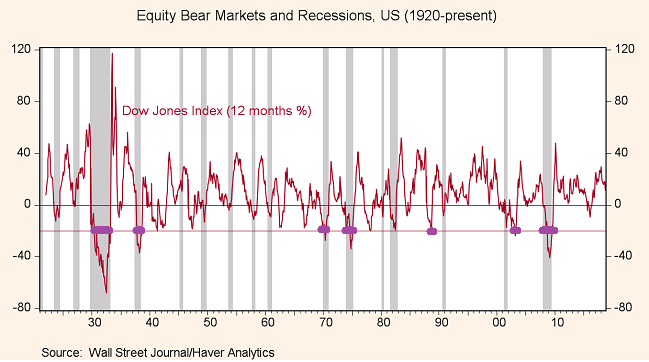
There is a link (not a perfect link!) between US bear markets (drops of more than 20%) and US recessions. In the chart below, the bear markets are shown in thick purple lines and they mostly coincide with US recessions (grey columns).

Modified chart 1920-2019 showing (in purple) the bear markets (where the red US stock prices fall >20%) and the US recessions shown as grey columns – From Gavyn Davies Financial Times – Original source Haver Analytics

All well and good so far, but we want to be out of the markets before a recession … how can we predict recession? Should we ask economists? A recent survey found that 3/4 of those surveyed thought there would be a recession before 2021. This is good to have in the mind … but not that useful in a practical sense. Economists have a poor record in predicting recessions. I don’t mean to be mean to economists … I also have had a career in prediction (weather!) and there are many similarities. Like the atmosphere, economics is complicated, not all factors are known, and not all processes are truly understood – But we do our best!

The “Inverted Yield Curve” as a predictor of US Recession

There might be an answer to predicting recessions by using the US Treasury Bond “Yield curve” . You may have heard about the yield curve (Probably not! but read here) – where short-term US treasury bill yields are compared to long-term yields. Normally, you would expect the yields on your money to be higher the longer that you lock it away – this corresponds to the periods above the red line on the graph below. Usually, the 10-year Treasury bill yield is greater than the 1-year bill yield. However, if there is a very a gloomy US outlook and the Feds are raising rates, you can earn more in the short term. This is when the yield difference [10-yr minus 1-yr (or 2-yr)] slips into negative territory, and you have an inverted yield curve – shown with the thick purple lines below. Note that these inverted yields usually occur one to two years before a recession (grey columns).


Chart showing where the yeild curve becomes inverted (purple lines) with the US recessions shown as grey columns. Modified from Morningstar report – original source Gurufocus.com

I love being the owner of companies and much prefer being in the share market than not. I will adopt the brand new exciting Slack Monthly method that should keep me in shares for the smaller downturns (corrections). I will ignore any monthly downturn signals UNLESS there is a sustained period of the US Inverted Yield Curve. I can check this at the end of the month at Gurufocus.com. This should maximise my chances of staying in shares until there is a threat of recession and the expectation of a larger downturn.

Jacinda Ardern shares a hug at a Wellington Mosque – From The Guardian

This has been a tough month for this part of the world – where, in Christchurch, a hate-filled idiot with a gun can a cause so much heartache for decent families. Great respect to the people of New Zealand and their exceptional leader Jacinda Ardern for bringing gun reform and such a strong message for humanity in the wake of this tragedy.

Power to love, tolerance and humanity.

Innovation Boom

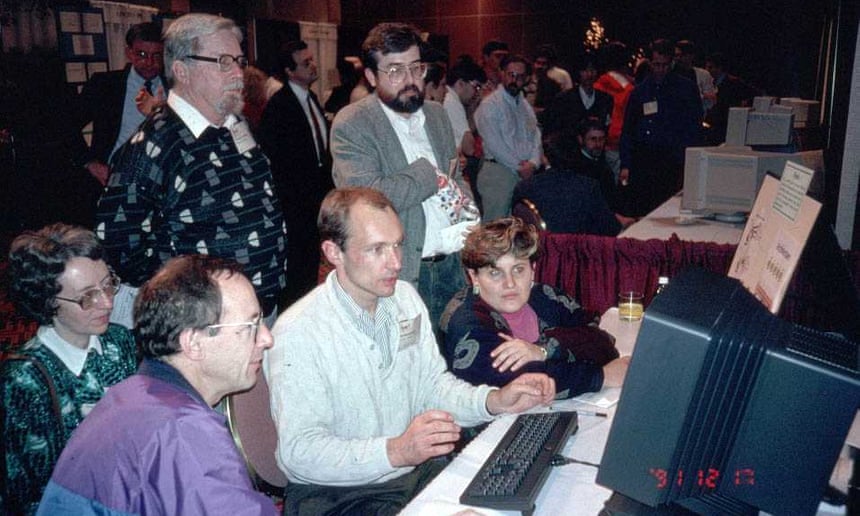
Tim Berners-Lee (in the white shirt) demonstrating the world wide web to nerdy enthusiasts at a 1991 conference in Texas.  – From theguardian.com

I have been lucky enough to live through one revolutionary innovative idea that has changed the world. The magnificent Internet – a global system of connected computer networks which has been developing since 1983 – but it was Tim Berners-Lee who introduced the publicly available World Wide Web in 1991 – This was a way of connecting the vast resources and documents on the internet through hypertext and URL’s.

It was 26 years ago, in 1993, when things really started to take-off with the first graphical web browser. Imagine how different the world was without the internet innovations such as Search Engines, Web Browsers, Real time streaming, emails, e-banking, online shopping, wi-fi and, my favourite, GPS linked to an internet map.

My portfolio is filled with companies that have made growing businesses based upon this innovative technology. Altium (ALU), Appen (APX), RealEstate.com (REA), Rhipe (RPH), and Seek (SEK) are all companies that make extensive use of the Internet.

The science man in me (Nerdy part) doesn’t really trust a graph without a vertical scale but I came across this image below from an Ark Investment report that really made me think. It puts other great innovations into some historical context and points to a series of new innovations that are predicted to have a large effect on economic activity in the future – One thing I don’t agree with on the image is the author’s notion of tapering off the impact of internet as we go towards 2020. But I can see that at least some of the innovations mentioned on the right will have a big impact on our future.


Impact of innovations on the economy – ARK Investment Management LLC, 2018 from Ark Invest

Part of being Slack is not wanting to research all of these head-hurting new ideas myself (but they do sound interesting!) and I think I should outsource this to someone else. Luckily there are a few research boffins at BetaShares that have come up with the BetaShares Global Robotics and Artificial Intelligence ETF – (RBTZ).

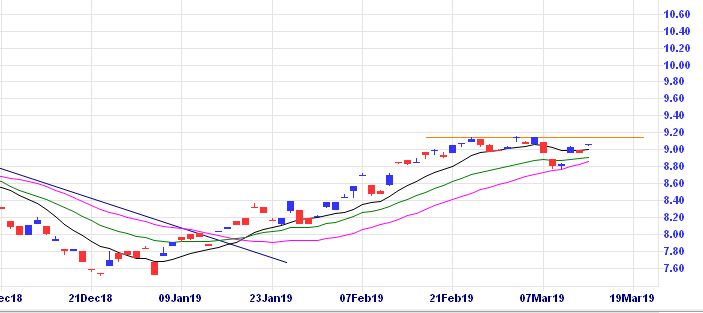
The ETF covers two of the emerging innovative sectors, Robotics and AI. This fund invests in an index of companies involved in Industrial Robotics and Automation, Non-Industrial Robots, Artificial Intelligence and Autonomous Vehicles and Drones. There is a cost – a management expense ratio of 0.57% ($57 per $10000 invested p.a.). Costs of investment are really important for the total returns on your investments. In this case, this is a cost that I am willing to pay and am looking for an opportunity to invest in the RBTZ ETF soon as I have finally unloaded my Challenger (CGF) shares and have a bit of cash to invest. I will wait till this chart shows some upward price momentum and breaks through the orange line “double top resistance” on the CGF daily chart at $9.15.

Daily RBTZ chart BetaShares Global Robotics and Artificial Intelligence ETF – from incrediblecharts.com

Oh … and in passing, thanks to Sir Timothy John Berners-Lee for that world wide web thing … it was a pretty good idea!

February 2019 – End of Month Update … and Challenger rethink … and Trump

Slack Investor remains IN for Australian index shares and OUT for UK Index shares. The US Index S&P500 has now shown enough sustained positive momentum on the monthly chart that I am buying back IN on the S&P500 today (1 Mar 2019).

Recovery continues with rises in all  Slack Investor followed markets (ASX200 +5.2%; FTSE100 +1.5%;  S&P500 +3.0%). 

A Reprieve for Challenger

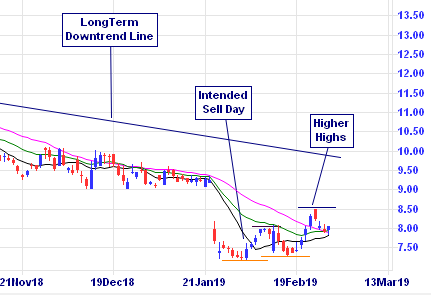
Last post I was looking to get out of Challenger … a stock that I have fallen out of love with … due to months of disappointing declining share price. On the day of intended disposal, I noticed that it had gone up 2%. Slack Investor doesn’t like to swim against the tide … and I delayed … it went up again the next day on increased volume – the sign that someone is buying the stock in some numbers. The daily chart started to look like an uptrend was being established. Higher Highs and Higher lows … so, I am still an owner of the stock until this uptrend pattern breaks. This takes a bit more vigilance than Slack Investor really likes as it takes a daily look at the chart pattern … The reasoning is that it is annoying when a stock bounces back immediately after I sell (this has happened a few times!) and I will ride this (could be temporary) upswing as long as it lasts.

Challenger (CGF) Daily chart -From Incrediblecharts.com

Trump

Image from tenor.com

The Donald is never far away in the news. Never boring … frequently appalling. A question in #Quora asked “Why do some British people not like Donald Trump?” An English writer, Nate White, penned this magnificent response in full here – but you can get the jist from the opening paragraph .

Trump lacks certain qualities which the British traditionally esteem.
For instance, he has no class, no charm, no coolness, no credibility, no compassion, no wit, no warmth, no wisdom, no subtlety, no sensitivity, no self-awareness, no humility, no honour and no grace – all qualities, funnily enough, with which his predecessor Mr. Obama was generously blessed.

From an article by Nate White

Further education on the quality of Donald Trump’s character can be found on the Donald Trump sexism tracker. It is a great article that is almost impossible to finish without feeling a little ill – and an uneasy feeling about how we got to this point.

All Index pages and charts  have been updated to reflect the monthly changes – (ASX Index, UK Index, US Index).

Terrible Things

Yes, … there are some images that stick in Slack Investor’s head … and this is one of them! The average ceramic toilet should last 50 years. The relentless view from a toilet’s perspective must be pretty confronting – and the cumulative exposure must be horrific! Apart from now treating each toilet that I encounter with great respect … and giving acknowledgement for past suffering – this image has made me think of the terrible things I’ve seen.


Residents of Idalia, Townsville survey the damage. Picture: Michael Chambers – Courier Mail

Firstly, a shout out to those in Townsville (Where Slack Investor has a house). A massive flood event has occurred on the Ross River and affected many homes. The mud, the silt, the mould, the smell, and the destruction as water has invaded homes is horrific … and definitely qualifies as a terrible thing. As one who has had flood water in his home, fortunately not in the main living areas, my thoughts are with those badly affected as the town moves toward recovery.

Terrible things of a far lesser order

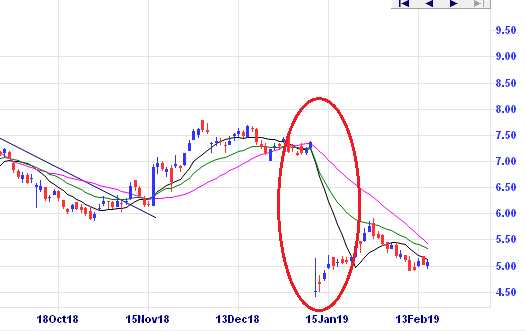
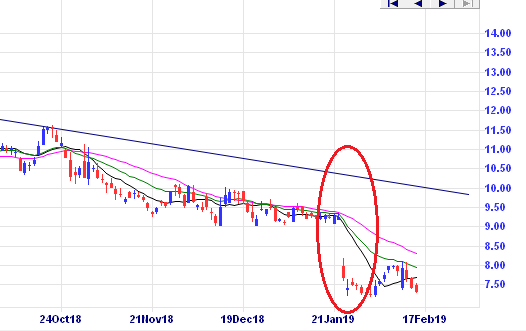
We are now in the “confession season” where Australian companies must report to the market. Slack Investor is predominantly invested in “growth” companies – and there is inevitably always some bad news with some of these stocks where the companies sales do not meet expectations – for whatever reason. As news breaks there is usually a rapid sell-off and the price drops dramatically.

Daily chart for Costa Group (CGC) – From incrediblecharts.com
Daily chart for Challenger (CGF) – From incrediblecharts.com

Now the nature of Slack Investors slackness is that he doesn’t get involved in the daily ructions of a stock price – but he is confronted with these sorry charts at the end of each week (and month) when he does his portfolio reviews – He must decide what to do next! A good start is to read the press for any information on why these stocks have fallen – Is it a panic sell … or is there something fundamentally wrong with the prospects for this company at this time.

The top chart is of Costa Group (CGC), a food producer with interests in mushrooms, blueberries, raspberries, tomatoes and avocados. A profit downgrade led to the big price drop, but consensus seems to be that the sell-off was overdone due to the seasonal nature of fresh food supply. The long term prospects for sustainable growth in Australia and internationally look good and Slack Investor is a remainer in CGC. More useful advice to millenials (But this actually makes sense!)– as well as eating the odd “smashed avacodo“, aspire to owning a company that produces them!

I originally liked the story behind Challenger (CGF), an annuity provider that should be able to tap into the retiring “baby boomer ” market. There are a few articles on Challenger that discuss the recent 8% profit downgrade that led to this slump – blame is apportioned to the Hayne Enquiry, recent poor investment returns and politics. CGF was one of my defensive big picture stocks (on a good dividend 4.7%) that I was sure would come right – but the downward trend on the chart would suggest that I have hung on for too long. The stock price might bounce back – but it seems that there are enough headwinds to inhibit growth in the near term. I will be looking for a chance to rotate out of CGF and into another company such as Treasury Wine Estates (TWE) over the next few weeks. TWE had some cash flow problems this reporting season, but is projected to grow sales and revenue with a good return on equity in the next few years (14.1% in 2020).

January 2019 – End of Month Update … and vale Jack Bogle

What another wild month for shareholders! … Rises in all Slack Investor followed markets (ASX200 +3.9%; FTSE100 +3.6%). The volatility is best illustrated by the US Index S&P500, down 9.2% last month, and this month, up 7.9%!

Slack Investor has sold his  US and UK Index Funds and remains out until a positive trend on the monthly charts can become established. He remains tentatively IN for Australian index shares – ASX 200.

Actively trading the index funds on a monthly basis has been profitable for Slack Investor since 2004 but this recent high volatility is causing a rethink on my index trading strategy as my trading advantage statistics are starting to shrink. So far, my advantage over the ‘Buy and Hold” Index investor for the ASX200, FTSE100 and S&P500 is 43%, 23% and 8% – but this does not account for any missed dividends while I have been on the sideline. Since 2004 this represents outperfermance of 2.9%, 1.5% and 0.5% per year, respectively. For now, I am sticking with the strategy – but imagine how slack I could be if I just bought and held these index funds.

Farewell John C. (Jack) Bogle … and great thanks

Jack Bogle (in 2012) – founder of mutual fund company Vanguard – from source

An established Slack Investor hero, Jack Bogle died this month aged 89. The founder of Vanguard, he was a great friend to all investors. Warren Buffet was asked to comment on his passing
“Jack did more for American investors as a whole than any individual I’ve known”

A fitting tribute to his achievements can be found on the Vanguard site.

The finance industry has for a long time gouged the ordinary folk with fees and layers of complication. Before Jack Bogle, mutual funds were setup to manage other peoples money for a profit. In 1975, it was common to charge the punter 1-2% for the privilege of managing their money – This is $100-$200 for each $10000 invested for yearly management! There was also a range of other investment fees which could amount to 4% of your initial sum. Investments would be have to be arranged through “brokers” who would also take a slice. The “Vanguard Experiment” set up an independent mutual fund that operated “at cost”. He introduced the first low-cost index fund that followed the top 500 US stocks. Vanguard now has 20 million investors and manage over $5 trillion in assets.

“If a statue is ever erected to honor the person who has done the most for American investors, the hands down choice should be Jack Bogle. For decades, Jack has urged investors to invest in ultra-low-cost index funds … In his early years, Jack was frequently mocked by the investment-management industry. Today, however, he has the satisfaction of knowing that he helped millions of investors realize far better returns on their savings than they otherwise would have earned. He is a hero to them and to me.”

Warren Buffet – from his February 2017 Letter to Shareholders

Vanguard have managed funds (where you apply to Vanguard directly) and exchange traded funds (ETF’s) where you buy the funds as a share on the stock exchange through your low-cost broker. Both are good ways to expose yourself to the stock market. For my investing style, where brokerage costs are not a big consideration – I prefer the simplicity of ETF’s.

A Vanguard Australian listed ETF that provides exposure to all of the world’s companies (Ex-Australia) is VGS. Slack Investor bought VGS last month on the technical signal “break of a long-term downtrend” and it has a reasonable yearly management fee of 0.18% – That is $18 for every $10000 invested … not Bad! But because Vanguard have set the cost benchmark, many other funds and ETF issuers are trying harder to keep costs down. The Australian listed SPY (State Street) which I use to track the US index has a management cost of $9.45 per $10000. A shout out to the Australian owned BetaShares which provide an ASX200 ETF A200 for a remarkably low $7 per $10000.

Jack Bogle repeatedly pointed out that it was extremely difficult for an active fund manager to outperform index funds over the long term.

Over a 15-year period prior to June 30, 2018, only one in 13 large-cap managers, only one in 21 mid-cap managers, and one in 43 small-cap managers were able to outperform their benchmark index .

SPIVA US Report Mid-Year 2018

My new year’s resolution is to start rotating out of the few high cost active funds that I own (e.g. Platinum Capital (PMC) and the Montgomery fund – where the management fees are over 1%) – to focus more on the passive index funds – where costs are low. I will try to do the active trading myself in individual shares while I comfortably outperform index funds on a 5-yr basis. Slack Investor will eventually phase out his active trading for a more passive portfolio .

All Index pages and charts  have been updated to reflect the monthly changes – (ASX Index, UK Index, US Index).

Workin’ the Wedgie – Breaking Downtrends

The “Wedgie” is a classic Australian image that brings delight to the Slack Investor. Last post, I referred to a breakout from a “falling wedge” in the ASX 200 weekly chart. There are all sorts of patterns that technical (using charts) investors use. Slack Investor concedes that, as the pattern was longer than 3 months – he should have referred to the pattern as “breaking a long-term downtrendline“. However, this term is not as engaging to the eye, or as dead set funny, as the “Wedgie”.

The breakout from a long-term downtrend on a share price chart is one of the classics and the technical signal has more validity on a weekly chart than a daily one. Slack Investor loves this pattern and has been patient over the last few months as stocks have been sinking worldwide. He has trimmed his portfolio and has some cash and feels now is the right time to test the waters. This breakout from a long downtrend has the potential to be a trend “reversal”.

There comes a time when stock prices fall to a price that buyers start coming back into the market and the share price comes back up. If it is sustained, this is called a “reversal”. In “Technical Speak”, a new trend is only established when a new “higher low” is established – so, this is an early call – supported by the establishment of a stop loss on all buy orders.

Trading the long term downtrend breakout

Admittedly, these trades just make the definition of a long term downtrend – but it has been a steep fall!

To be considered a long term trendline, the trendline should be at least 3 months. The longer the trendline the more bullish it will be when the stock breaks above the trendline.

From Dstockmarket.com
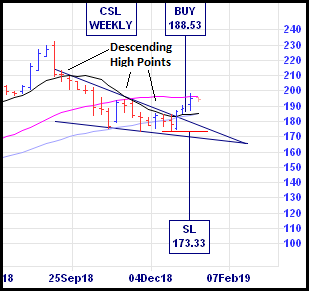
CSL Weekly chart – from incrediblecharts.com

The wedge pattern can be seen on the CSL chart. The critical part of this shape is the upper line of the wedge on your chart software. I highly recommend the free (if using day-old data) Incredible Charts to do this type of stuff. This upper line connects at least 2(and preferably 3) descending high points (that establish the downtrend) on your weekly chart. To get into this trade early, buy whenever the closing price breaks above the top downtrend line. Technically, a new uptrend has not been established yet. Confirmation of a new trend comes when a new “higher high” and “higher low” has been established. A more conservative entry point is when the new trend becomes obvious. An established trend trading rule is

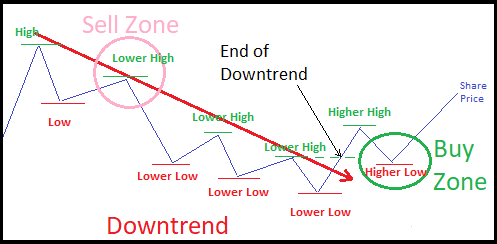
Buy the Higher Low and Sell the Lower High

A full explanation of this confusing set of words can be found in the Tyler Yell article at dailyfx.com or, shown schematically below

Image demonstrating the trend trading zones for the “Buy the Higher Low and Sell the Lower High” strategy. It boils down to selling when a downtrend is established (Lower High) and buying when a new uptrend is established (Higher Low). More trend stuff in a previous post The Trend is Your Friend.
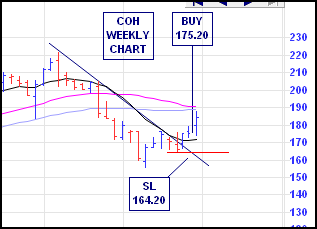
Cochlear weekly chart – from incrediblecharts.com

But, enough of the theory.
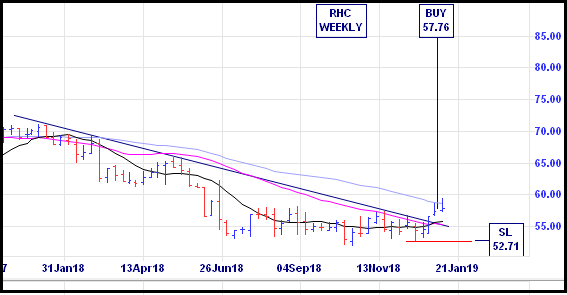
Normally, I would wait until the new uptrend is a bit more entrenched, but the companies below have been on Slack Investors watch list for some time and they have a track record of increasing dividends. They have high P/E ratios as they are growth companies (and their projected growth is factored into their price). But what really impresses me is the way they use their capital. From Marketscreener.com, COH has a forecast 2020 Return on Equity (ROE) of 44%; RHC 23% and CSL 38%. If I put money into a bank deposit, I might get a paltry 3%. These companies are very good at getting returns on their investment (equity) – and I want to be involved!

Ramsay Health Care Weekly chart – from incrediblecharts.com

There are other Australian stocks on my Growth Stocks watchlist that show this downtrend breakout pattern. They include ALU, APX, CAR, CCP, FPH, SEK, and A2M. Unfortunately, my investment funds are not limitless. Not all of them will be winners, this is not advice, but I’d rather invest in companies like them – than get a “wedgie”.

I will report back on all of these “buy signals” in a year.

December 2018 – End of Month Update … and Moving Day

What a month! … In amongst the Christmas and New Year Celebrations, Slack Investor has been forced to get OFF the couch!

Slack Investor is on the SELL and is leaving the US, UK Index Funds – for now. He remains tentatively IN for Australian index shares – ASX 200.

“The Donald” from Time Inc.

Trumpishness and Brexit, future US rate rises, and stock valuations in the US add to the uncertainty and wild fluctuations.  The FTSE 100 is down 3.6% and S&P 500 is down a whopping 9.2% for the month. Time to sit things out and wait for the next uptrend in the markets. It is always sad to see the end of a long successful trade and the run in the US S&P 500 has yielded 153.8% over 9 1/2 years. In Australia … we would call this a great innings and clap the US Index off the field … A fantastic Bull Run!

My efforts with the FTSE 100 are far less spectacular with an overall loss of 7.4% – However, I am glad to be out of that market with all of the Brexit confusion.

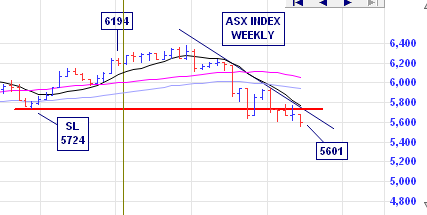
The Australian ASX 200 had a reprieve after passing through its stop loss last month, but it is still hanging in there. As the share price is still below its stop loss, I was ready to let it go this month. However, a “Bullish” pattern emerged on the weekly chart.

The Falling Wedge

The “Falling Wedge” is a classic part of Technical analysis … it can be “Bullish” (Reversing the downtrend)  or “Bearish” (Continuing the downtrend)- depending on what happens with a breakout of this pattern. 

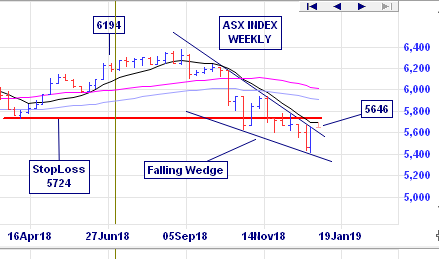
Weekly chart of ASX 200 – A Falling Wedge pattern is formed by drawing a trend line along the top of 2-3 of the descending high points and a support line connecting 2-3 of the low points.

The weekly chart above shows a distinct breakout from the “falling wedge” pattern (Labelled 5646). This MAY indicate a reversal of the downtrend. The ASX 200 Index is now on a weekly watch and if the share price falls back into the “wedge” at the end of the week, I will put out a post and exit the stock.

The recent price plunges have made for a dismal calendar year 2018 for stocks. Without including dividends, ASX 200 -6.9%; FTSE 100 -12.5%; and the S&P 500 -6.2%.

I naturally hope for a change in trends and wish a prosperous New Year to you all.

All Index pages and charts  have been updated to reflect the monthly changes – (ASX Index, UK Index, US Index). I will update my portfolio holdings page in the next few days.

Optimism

Slack Investor has always been on the “glass half full” side of life – but acknowledges the decided benefits of pessimism. 

The nice part about being a pessimist is that you are constantly being either proven right or pleasantly surprised.

George F. Will – from source

Slack Investor would much rather hold shares than not … and be involved with companies that are growing and part of the economy than using more passive investments such as cash. However, he must keep his eyes open occasionally – and keep a watch on major market trends.

ASX200 Weekly chart – From incrediblecharts.com

Let’s firstly have a look at the markets that Slack Investor is involved in. The ASX200, FTSE100 and S&P500 are all in a distinctive downtrend. Typical is the ASX200 weekly chart shown above. This downtrend may go further but Slack Investor is seeing some signs for optimism – At least in the Australian market.

There is a high level of uncertainty in global markets at present. Europe has Brexit and Italy. The US has investigations into Donald Trump’s election campaign. China has the threat of a trade war with the US. But my sense is that the market has become risk averse rather than fearful. There is no sign of panic selling as yet. But investors are clearly on the defensive and prepared to sell off vulnerable stocks.

Colin Twiggs – Trading Diary

But, all is not lost … Despite large amounts of emotion in the market. The fundamentals of emerging economies are still good.  Vanguard estimates that a recession in 2019 is not likely – that the more likely scenario is a slowdown in growth, led by the U.S. and China. 

Shane Oliver, head of investment strategy at AMP Capital, said “history tells us” a major bear market requires a recession in the U.S., but that is not happening. He advises that U.S. monetary conditions are “far from tight,” with fiscal stimulus still in play and no signs of excessive market conditions that normally precede a recession.

Marcus Padley is also on on the side of the optimists and concludes that the current situation in the ASX is more of an opportunity than a disaster. He notes that average correction for Australian markets is  13.72% and takes 109 days. The current correction has been 13.2% and it has taken 59 days -Brutal! On that basis, we have already completed an average correction in half the usual time. These corrections are never fun and test even the most strident of investor. But Slack Investor IS an investor much more than he is a trader.

Slack Investor has already had a hard look at his portfolio … and said goodbye to some … and is hanging on to most – as he thinks that most of his individual shares represent reasonable value at current prices. I’m sitting tight for now with a bit of cash in the bank should things turn around, Sadly, more decisions will have to be made at the end of the month – but for now, I am grateful for the good things in life … Happy Christmas to you all.