February 2020 – End of Month Update … and wisdom of “the Buff” in times of trouble

A wild month in all stock markets with increasing concerns of the punters about virus COVID-19 and its effect on the world population and economy. There is a selling fever at the moment. Slack Investor is no predictor of the future, but he reminds himself that stock prices are set by the market and there are often times when prices exceed the “value” of each individual company – and times when prices fall due to panic selling. Stock markets are volatile and while we frail humans (and a few robots!) are in charge of setting the price – this will always be the case. Some markets have had an official correction (10% fall from their peak). This is quite normal and usually happens after a period of strong rises. Marcus Padley points out that

“Normal” risk is the stock market having a 20 per cent correction every three years and bouncing rapidly afterwards.

Marcus Padley in article from The Age

Slack investor has two systems going with his shares. With his funds that track whole Indexes, he attempts to time the market a little with the use of stop losses. However, for individual companies, I deal with them on a “case by case” basis and think about how this current Coronavirus crisis will affect them. If I owned companies in tourism, international education, airlines, or those who source most of their goods in China – I would be cutting my losses and getting out. If the crisis worsens, and COVID-19 is declared Pandemic, then I would have to have a closer look at my share holdings as health epidemics are a risk to all businesses.

The Federal Reserve bank of Cleveland have the probability of a US recession within the next year at 32.9%. This probability is starting to creep up again. The current value exceeds the Slack Investor threshold of 20% and my monthly stop losses for Index funds are “switched ON”

Slack Investor remains IN for Australian index shares (ASX200 down 8.2% this month) and the US Index S&P 500 (down 8.4%). I have not had much luck with the fluctuating FTSE100 and it has breached its monthly stop loss (down 9.7%). So I’m OUT. The latest trading cycle showed a loss of 9.6%. But since 2004, the Slack Investor timing method for indexes has beaten the FTSE “buy and hold” strategy by 17%.
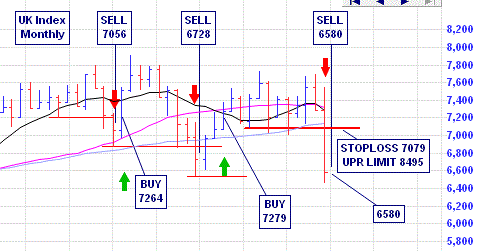
Monthly chart of the FTSE100. The latest cycle is showing a buy at 7279 and a sell at 6580. From Incredible Charts.

All Index pages and charts  have been updated to reflect the monthly changes – (ASX IndexUK IndexUS Index).

When “the Buff” talks … Slack Investor Listens

Warren Buffet from the New York Times

It is not unusual for Warren Buffet to expand on his thoughts on investing. Every year his investment company Berkshire Hathaway reviews the last 12 months and gives a fair chunk of investment thinking according to Warren Buffet and his distinguished offsider Charlie Munger. The full 2019 year letter is here.

Year after year the advice is remarkably constant.

“What we can say is that if something close to current rates should prevail over the coming decades and if corporate tax rates also remain near the low level businesses now enjoy, it is almost certain that equities will over time perform far better than long-term, fixed-rate debt instruments.”

Warren Buffet from the Berkshire Hathaway annual letter for 2019

In other words, despite the world-wide Corona virus inspired rout on stock prices, “the Buff” feels quite comfortable with his exposure to shares “over time” and feels confident that his portfolio will outperform bonds and cash.

Warren Buffet tries to tune out the daily fluctuations in share price and he has always said that investors should see themselves as long-term part owners of corporations. “The Buff” looks for companies with low debt, good management and a high return on equity. Mr Buffet does not anticipate selling any of his top 15 stock holdings.

Corrections aren’t much fun, and Slack Investor has as much investing prowess as Mr Buffet’s toenail, but, Like “the Buff”, I would rather have the bulk of my investments in good companies than anywhere else.

The Wedgie is Working – January 2019 Wedgie stocks 1-yr review

Australian lifeguards are known to roll their Speedos up during surfboat races to give better contact between the buttocks and the wooden seat of the boat while rowing. The image is gratuitously included because “Wedgies” are just …just … funny! -Downloaded from http://westalai.blogspot.com/ – may be subject to copyright

Slack Investor introduced one of his favourite technical chart patterns in January 2019 … “The Wedgie”. I promised to look at the results in 12 months time.

Looking at charts of stock prices and trying to recognise useful patterns is known as Technical Analysis. Some investors do not have faith in in this dark science … and Slack Investor would not act on chart signal alone – the underlying company must be sound with established earnings and good prospects.

“The Wedgie” is Slack Investor’s name for a pattern more boringly known as the “breaking of a long-term downtrendline“. You have to admit … “the Wedgie” has a more of a ring to it.

The breakout from a Wedgie on a share price chart is discussed in detail in the original post and it is when the share price rises out of the wedge pattern. The top of the wedge downtrend line should be drawn for a period of at least 3 months and connect at least 2 (and preferably 3) descending high points.

This pattern has the potential to be a trend “reversal” – Lets see how it has performed over 12 months for the Slack Investor bought stocks. The first 3 are all still in the portfolio.

CSL – Commonwealth Serum Laboratory

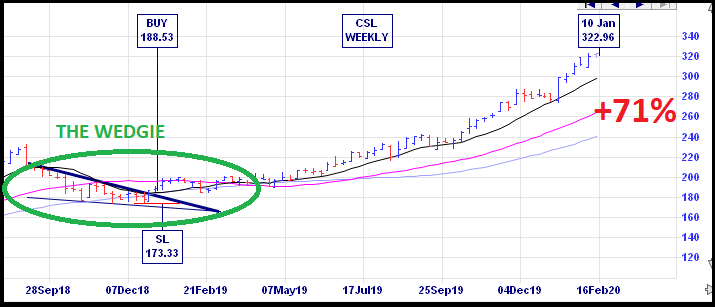
This great company share price was consolidating a year ago but has recently boomed with a 71% gain.

COH – Cochlear

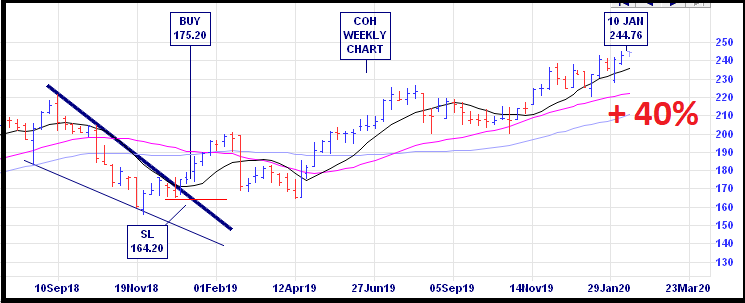
Weekly Chart for COH – from incrediblecharts.com40% gain.

RHC – Ramsay Health Care

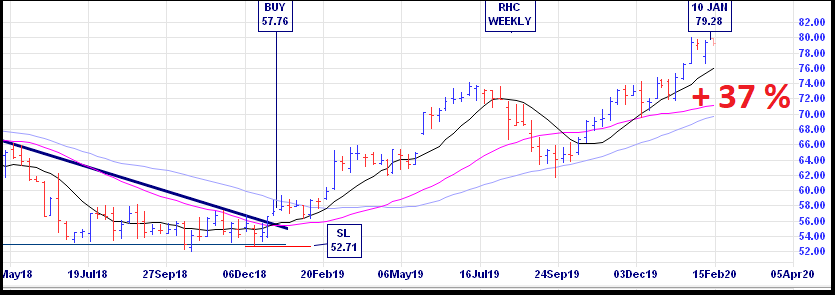
Weekly Chart for RHC – from incrediblecharts.com 37% gain.

In the January 2019 post, ALU, APX, CAR, CCP, FPH, SEK, and A2M were also mentioned as breaking the wedgie pattern. All of them have made very good gains since the breakout from “the wedgie”. Gains of 73%, 64%, 48%, 76%, 74%, 29% and 25%, respectively – from January 18, 2019 to February 10, 2020. Slack Investor thinks that, so far, the Wedgie is working in most cases! – but, it has no guarantee – vigilance is required.

The Wedgie does not always work, CGC – Costa Group –

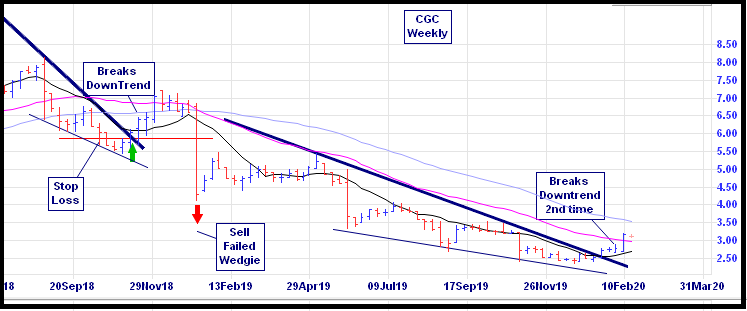
Weekly Chart for CGC showing two distinct wedge patterns. The first one showed promise then the price quickly turned south after some earnings downgrade announcements. The second wedgie looks worthy of investigation – from incrediblecharts.com

CGC was not mentioned in the original post and clearly the first break of the downtrend in November 2018 lost a bit of steam due to drought and supply problems – Slack Investor was, sadly, an investor in this stock at the time – and it was a loser! This is an example of the wedgie pattern NOT working. However, for all of 2019, CGC has been in a long-term downtrend but the pattern is starting to get interesting again as the longer the downtrend line the more bullish it will be when the stock breaks above the trendline.

As always, however great the pattern may look, Slack Investor is interested in the fundamentals of this stock before he will invest. Wisetech (WTC) is also breaking its Wedgie. Using marketscreener.com, CGC has a good 2021 forecast PE and yield, but the 2021 ROE is too low (<15%). WTC has good Return on Equity (ROE) but the 2021 forecast PE is too high for me (Slack Investor likes the forecast PE to be less than 40-50) … So, despite good looking technical patterns, it is no investment from Slack Investor for these two.

SI Wedgie 2020 P/E 2021Yield % 2021ROE % 2021
Costa GroupCGC173.39
WisetechWTC820.221

Let’s visit CGC and WTC in 12 months for the sake of curiosity. Long live the Wedgie!

January 2020 – End of Month Update … and Super Australia

Slack Investor remains IN for Australian index shares, the US Index S&P 500 and the FTSE 100.  The ASX probably had a bit of catching up to do and put in a big month (+5.0%) – These type of rises make Slack Investor nervous! There was also an opportunity to revise upward the stop loss for the ASX 200. When the share price gets to be 20-25% above a stop loss on the monthly charts, I usually look for a sensible place to put a new stop loss at a higher value. The ASX 200 is still in an uptrend – and a “Higher Low” had been established at 6396 on the monthly chart. The Stop Loss was moved upward to 6396.

The FTSE100 (-3.4%) lost last month gains and the S&P500 was flat at (-0.2%). Both are still well above monthly stop loss levels.

The Federal Reserve bank of Cleveland have the probability of a US recession within the next year at 25.9%. There has been not much change in the past 3 months. There was a peak at 41% five months ago. The current value exceeds the Slack Investor threshold of 20% and my monthly stop losses for Index funds are still “switched ON”

All Index pages and charts  have been updated to reflect the monthly changes – (ASX IndexUK IndexUS Index).

The introduction and growth of Australian Super

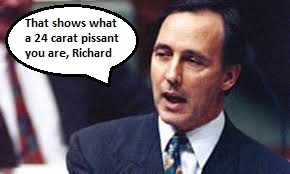
Former Australian Prime Minister and Treasurer, Paul Keating introduced compulsory Australian Superannuation and often used “cut through” language. In this case, to reporter Richard Carleton. Background on what constitutes a “pissant” can be found at grammarist.com

Not really a fan of insulting language but sometimes it is necessary to cut through, and Paul Keating was a master of this art. Imagine what it was like back in 1991 – where Keating, with the help of Trade Union Leader Bill Kelty, was able to convince Australian unions and workers that an overdue 3% pay rise should go into compulsory savings. Instead of going into worker’s pockets, he argued that the payrise should go into a retirement scheme called “superannuation”. ABC economist Peter Martin describes this incredible feat of persuasion as a means to avoid inflation at a critical time in Australia’s economy.

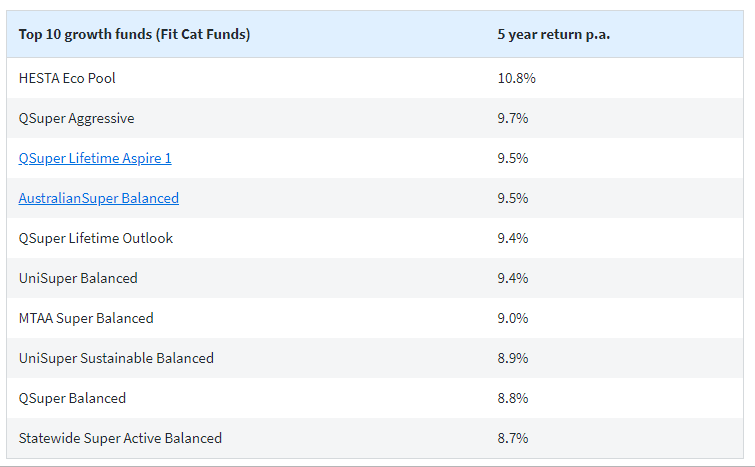
The most excellent compulsory Australian super has been going since 1992, accounts for 9.5% of workers income, and now stands at 2.9 trillion AUD . According to ASFA, Australia is the 4th largest holder of pension fund assets in the world. But the Productivity commission says that super fees are still to high and that some super funds are duds. For most of your working life, you should be in a “growth” fund that is not a dud!. The Chant West compiled funds below have an excellent track record over 10 years – a good place to start.

From Morningstar, using Chant West growth funds data, (61 – 80 per cent allocation to growth assets). Performance is shown net of investment fees and tax.

New Australia Day please

In contrast to many current day politicians, Paul Keating was a real leader, prepared to argue the case for a proposal – even if it wasn’t initially popular.

Australia Day is currently celebrated on January 26th – The anniversary of when Captain Arthur Phillip took formal possession of the colony of New South Wales in 1788. This date does not sit well with many indigenous people who understandably see this as a commemoration of “invasion day”. It is time for a new date! – the anniversary of the opening of the first Federal Parliament in Melbourne, 9 May 1901 has been suggested.

May might be a bit cold though. Noel Pearson suggests the more inclusive celebration of both the 25th and 26th of January. The first day a recognition of the 65 000 years that indigenous Australians occupied the land – and a putting to bed the false idea of “Terra Nullius”. The second day, a celebration of modern Australia.

Nice work Noel … I am sure Paul Keating would approve – and two holidays instead of one … very Australian.

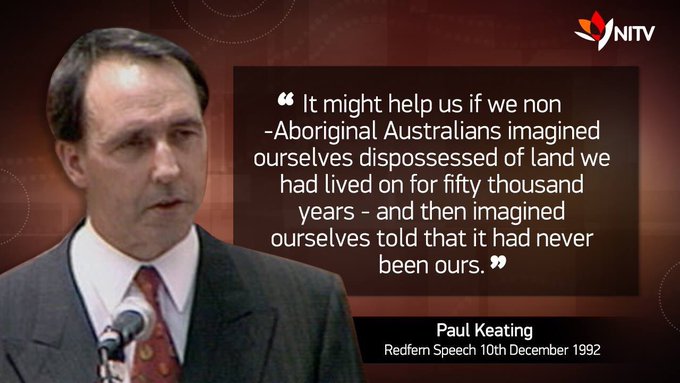
Some thoughts from Paul Keating (and his speechwriter Don Watson) in his landmark Redfern Speech in 1992 from NITV 25-year anniversary of this address.

2019 Calendar Review and, at last … some quality

Slack Investor’s in-depth reviews of performance are done at the end of the Australian financial year (30 June) – but a brief look at how things went in calendar year 2019 is in order. It has been a great year for the share investor. Roger Montgomery reports that the Australian All Ordinaries Accumulation Index delivered a return of 24.0% in calendar 2019 – more than double long-term average annual total return. Other World Index yearly changes for 2019 (without dividends) are listed below.

Indicies% Change
Australian All Ordinaries19.10%
S&P 50028.90%
Nasdaq35.20%
Nikkei 22518.20%
FTSE 10012.10%

Quality Street

Slack Investor puts a bit of time into initial stock selection. Before entry to the Slack portfolio, I comb the company universe for high Return on Equity stocks that have low debt and a proven track record of increasing dividends. Delighted to report that a couple of Australian ETF’s have recently emerged that do a similar thing, using parallel principles to the great Benjamin Graham in selecting quality stocks – automatically!

BetaShares Global Quality Leaders ETF – QLTY

QLTY provides access to the 150 highest quality global companies (ex-Australia) based on a combined ranking of four key factors – return on equity, debt-to-capital, cash flow generation ability and earnings stability.

VanEck Vectors MSCI World ex Australia Quality ETF – QUAL

QUAL has a similar objective screening process, to fill its stock register. Companies must have a high return on equity, stable annual earnings growth, and low financial leverage. 

There are common elements to the top 10 holdings for each ETF. Companies like Apple, Visa, Facebook and Alphabet feature on both registers. Either of these ETF’s would be a great addition to a portfolio but Slack Investor would lean towards BetaShares QLTY because of their slightly less expensive management costs (0.35% vs 0.40%). Past results indicate there is outperformance attached to this “quality” approach.

My only criticism is that both ETF’s have quality filters that do not seem take into account how expensive the stock is. When Slack Investor researches stocks, I usually dismiss a company if the forecast earnings (+2 years) produce a PE that is over 40. With QUAL and QLTY, it is quality first, regardless of price. I am mollified slightly by the determination that, in the past,

MSCI World Quality Index traditionally has its strongest relative performance during economic downturns

From Van Eck Whitepaper

Sometimes people ask me what stocks to buy – and I seldom have a good answer for them – particularly if they are just starting out on the path of buying shares and their portfolio carries the risk of just one or two stocks. These two ETF’s have given Slack Investor an easy answer.

  • Instant Diversification – International exposure
  • Access to high growth companies with a good track record of increased earnings
  • Rules based stock selection – no ‘active manager’ fees -this should keep expenses low ~ 0.4% … but could be lower!

The early results are not bad either with Morningstar listing one-year performance for 2019 for QUAL and QLTY at 35.8% and 34.5%, respectively.

These sort of products might just put Slack Investor out of a job!

December 2019 – End of Month Update … and the decade of asset appreciation

Apologies for the late post this month – just returned from holidays. Slack Investor remains IN for Australian index shares, the US Index S&P 500 and the FTSE 100.  The Slack Investor followed overseas markets had strong monthly rises. The FTSE100 (+2.7%) probably due to the resolution of the British Election; and the S&P500 (+2.9%) had good employment data and their economy is going OK. I add these comments as a bit of mindless speculation in hindsight. The ASX200 (-2.4%) did not do so well in December … not sure why … but (please insert your own reason here). Might be what the great leg-spinner Shane Warne calls “Natural Variation”.

The Federal Reserve bank of Cleveland have the probability of a US recession within the next year at 27.0%. This has been steadily reducing since a peak at 41% four months ago. The current value exceeds the Slack Investor threshold of 20% and my monthly stop losses for Index funds are still “switched ON”

All Index pages and charts  have been updated to reflect the monthly changes – (ASX IndexUK IndexUS Index) and the quarterly updates to the Slack Portfolio are also recalculated.

The ‘Twenty Tens’s – You should have been here!

This was quite a decade with lots of stuff happening. Popular Mechanics has identified 10 bad trends that have developed since 2010. Number one of their list of things we want to leave behind is “Science Denial” A perplexing trend that is encouraged by the internet and the desire to find “news” sources that reflect your own opinions. Slack investor would hope the 2020’s see a return to rationality – but is not too optimistic.

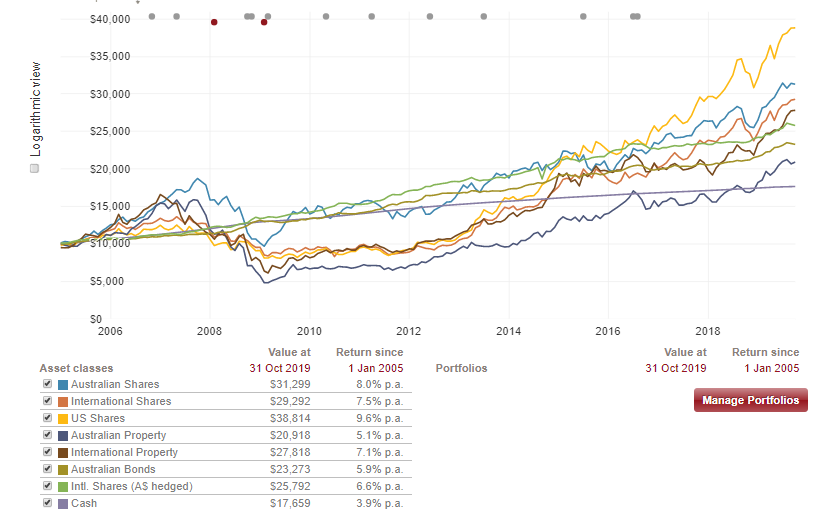
On the investing scene, the 2010’s were a great time to own assets. After the GFC in 2008/9 there has been a substantial return on most asset classes. This has been led by the US Market which used to be known as the “nation of ideas”

The last 15 years by investment class from Vanguard Australia. After the 2008/9 world recession there has been a remarkable recovery in all asset classes – though cash has lagged behind. This positive trend for over 10 years is very unusual.

The US economy is still going OK, but they have been encouraged by the historical low interest rates and tax cuts. The US (and most other developed countries) has recently lapsed into political tribalism. There has also been Trump’s sanctions on world trade. In the background, there has been a change in the balance of world growth. In terms of global growth, China, India, Indonesia, Russia and Brazil will account for over half of all global growth through to 2024.

It has been a great investment decade but there are always economic cycles and shifts in world economic balance. The 2019 calendar year has also been a beauty – more on this next post. Slack Investor remains on board the investment train … but cautious.

That’s not a Bull … This is a Bull!

The “Fearless Girl” statue in front of the “Charging Bull” sculpture in New York City on March 29, 2017 – Photo by Volkan Furuncu/Anadolu Agency/Getty Images

Slack Investor is a little bit saddened to discover that the great combination of the “fearless girl” and the “Charging Bull” in New York City was only a temporary thing. The girl was removed at the end of November 2018 due to an artistic dispute with the Bull creator Arturo Di Modica. The “Charging Bull” remains in Manhattan as a reminder of the inspiration that a bull market can bring after a market crash.

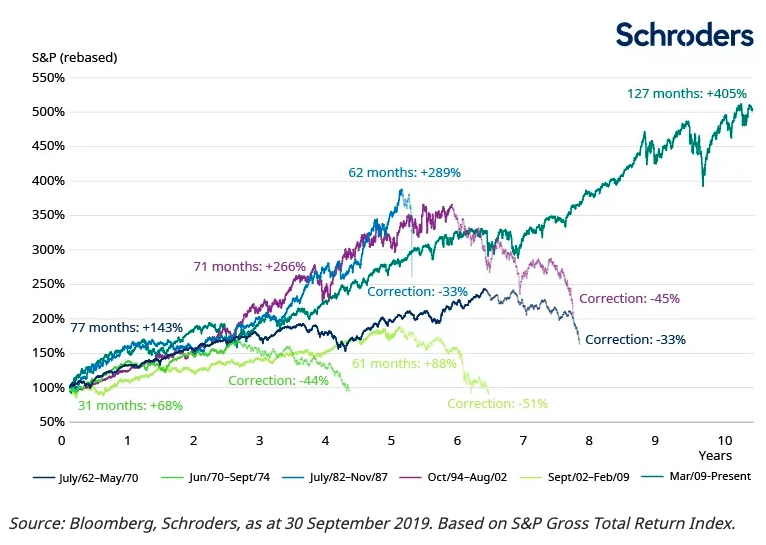
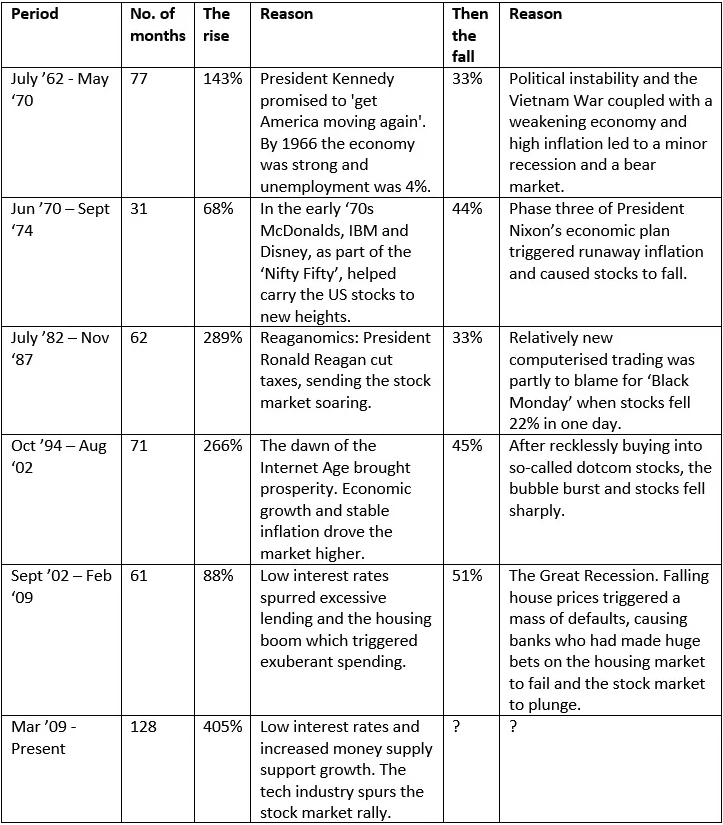
Bull Markets start when there is a 20% rise in the stock market from a previous low point. The current Bull Market has been a whopper – although there have been a few “corrections” along the way, it has now lasted over a decade and is setting new records (see chart below). The reasons behind this magnificent rise are obvious in hindsight – a mixture of the rise of technology stocks and a slow-but-steady economic growth, record corporate profits and record low interest rates.

From Schroders Australia. Chart showing the extent of the last 6 bull markets. The previous bull run, Sep 2002 to October 2009 (shown in light green) lasting 61 months (6 1/2 years ) is eclipsed by the current bull run shown as the dark green line at 127 months (to 30 September). The use of the word “Correction” in this chart to indicate the extent of the bull market collapse is a bit confusing. Normally, a “correction” is defined as at least a 10% decline, it turns into a “Bear Market” when there is a 20 percent drop in a major U.S. index

A reminder of some of the spectacular bull markets in the past 60 years is in the table below prepared by Schroders.

From Schroders Australia

The table above outlines the reasons for the end of each bull market and their is usually a trigger, prior to a market collapse.

  • a weakening economy, or an increase in the cost of money (higher interest rates)
  • “irrational exuberence” – where buyers are paying grossly inflated prices for assets
  • a cataclysmic world event

I can’t rule out the last one … but the US economy seems to be rolling along alright. Over the past week there have been a couple of events that bode well for the bull market to continue. In the UK, “buffoon in chief” Boris Johnson, has beaten the unelectable Labour candidate Jeremy Corbyn and now a quick Brexit looks on the cards. Stock markets generally love the removal of the uncertainty that elections present. The Trump/China trade deal seems to have also made some progress with a “phase one” deal announced. This should avert an escalation of the trade war. Low interest rates seem to around for quite some time. Stock valuations are high but not crazy high.

Slack Investor eases back onto the couch. There has to be really good reasons for Slack Investor to exit the world of high earning companies with products that the world wants.

Slack Investor is off on a bike riding adventure in Vietnam over Christmas and New Year. My usual End of Month Update will be delayed until about January 7, 2020. In the meantime, be fearless .. but also aware! The stock market moves in inevitable cycles. I am optimistic in the short term – and will enjoy my holiday. The good news is that even if the Slack view is wrong, there is always the subsequent “Higher Highs”as the market recovers. Good companies will survive any downturn and eventually return to a fair price.

The best of the fest … and a happy new year to all!

November 2019 – End of Month Update … and Mayfair Platinum

Slack Investor remains IN for Australian index shares, the US Index S&P 500 and the FTSE 100.  The Slack Investor followed overseas markets had rises all round this month. The ASX200 (+2.7%), a recovering FTSE100 (+1.4%), and a booming S&P500 (+3.1%).

The Federal Reserve bank of Cleveland have the probability of a US recession within the next year at 29.1%. This has been steadily reducing since a peak at 41% three months ago. The current value exceeds the Slack Investor threshold of 20% and my monthly stop losses for Index funds are “switched ON”

All Index pages and charts  have been updated to reflect the monthly changes – (ASX IndexUK IndexUS Index).

Mayfair Platinum – “Investing has changed” – No it hasn’t!

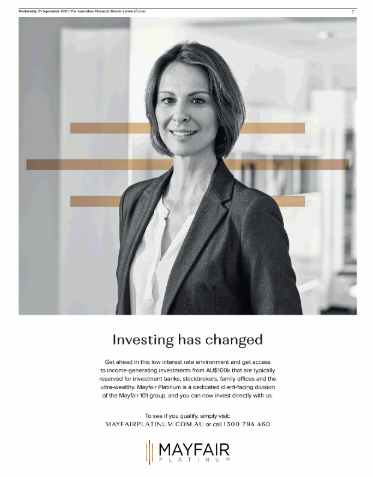
Full-paged ads spread across the Australian press in in the last few months. Mayfair 101 launches Mayfair Platinum. These ads were everywhere, paid plugs in the AFR, News Ltd, Finance sites, “influencers”, roadshow, and google ads.

There has been a barrage of advertisements in the press. Mayfair 101 says “We’ve been listening closely to investors who are frustrated by the sustained fall in interest rates. ” Their M+ Fixed Income product offers a juicy 5.45% for a 12-month term. Slack Investor is worried that this grand media campaign may fool some investors into thinking this vehicle is just as safe as bank deposits.

” M Core Fixed Income is a secured, asset-backed investment product that provides the benefit of the Group’s extensive diversification strategy coupled with our Australian real estate portfolio including our recent strategic investment in Mission Beach and Dunk Island.

Mayfair 101 Managing Director James Mawhinney, commenting on one of their products – from the Mayfair Platinum site.

Hang on Mr Mahwinney … did you say “secured” … you definitely didn’t say safe! By a quick comparison of their products, it seems that you don’t even get security with a paltry $100K invest – you need $250K to get the “secured asset backing” of their M Core product.

Mayfair 101 launches Mayfair Platinum, it “provides customers the opportunity to earn return rates between 3.65 and 6.45% p.a.

Mayfair 101 has been aiming a recent massive ad blitz to cashed up investors who are frustrated with the low returns offered by bank term deposits. They have been very successful since they set up in 2017, rapidly growing their fund to $100m in April 2019 and aiming for $250m. Mayfair advertising is littered with lines like “Tired of term deposit rates?”, “A popular cash and term deposit alternative…”, “Do you qualify?” – this campaign has plenty of fizz.

Slack Investor knows a bit about North Queensland, and the beautiful Mission Beach and Dunk Island area. There have been a number of tourist booms in the past, but each time they have been defeated by either a tropical cyclone, distance to international airport, rising interest rates, or a domestic tourism downturn. Tourism investments are definitely risky!

As well as cyclone ravaged Dunk Island, the parent company Mayfair 101 has investments in technology and cryptocurrency companies, and according to the Guardian, another abandoned island, in Venice – an area suffering from heavy flooding this month.

“In the modern age of investing, we are mindful that profit-generation is no longer the sole benchmark for a company’s success”

James Mawhinney Mayfair 101, from The Guardian

Sorry Mr Mawhinney , I’m not sure where you live, but in the Slack Investor world, profit generation is definitely the most important benchmark! At best, the Mayfair products seem speculative investments that carry a good deal of risk – a long way from the safety of the government guarantee for bank term deposits (up to $250K).

One of the few advantages of getting older is that you get to see the cyclic nature of investment. A good reminder of 35 years of investor busts can be found in the Chanticleer Reviews. Mayfair … You’re “investor-facing division” is not getting any of Slack Investor’s money. Despite the slick presentations and corporate glitz – this, as my mother used to say, “has got a real smell about it! “

I cannot give financial advice, but Slack Investor would not invest in Mayfair Platinum, and, if I had invested, I would take out my money as soon as I could (while the Mayfair distribution and withdrawal record is still intact). I would try other types of investment such as higher yield industrial shares or industrial/office REIT’s if I wanted higher returns than bank deposits.  These latter vehicles also have risk attached …. but, I’ll wager, much less risk than tourist property speculation, tech companies, and cryptocurrency plays.

It may take some years, but this Mayfair 101 thing … it’s not going to end well for the punters!

What’s that smell? … Banks!

With great thanks and acknowledgement to the insightful and talented Randy Glasbergen

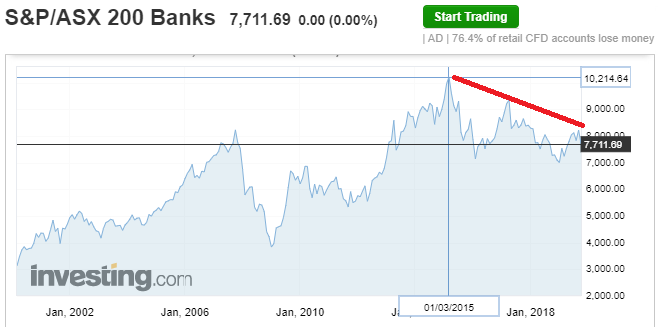
KPMG have just reported that banks are starting to lose their shine and the big 4 banks in Australia have reached a “turning point”. Slack Investor would argue that, after a pretty good recovery post the GFC, Australian Banks have been in decline since early 2015. NAB is the last to confess this reporting season … They are all businesses that will find growth difficult.

With its full-year profit of $4.8 billion, down 13.6 per cent, it joined ANZ, Commonwealth and Westpac in announcing a big decline in earnings.

From abc news
The ASX Bank Index since 2000. Except for the GFC 2008/9, the banks have performed well – as well as paying high dividends. Things changed in March 2015 where, despite temporary recoveries, there has been a general decline in share price. From Investing.com

Self Managed Super Funds are a great place to park your super money for the hands-on investor. But, they are not for everyone. You really need to have a real interest in investing and at least $200 000 in your super savings. According to ATO Data, at 31 December 2017, the most commonly held SMSF share investments (by investment size) are below: There are a lot of banks!

Commonwealth Bank
Westpac Banking Corporation
National Australia Bank
Magellan Global Fund
BHP Billiton Limited
Platinum International Fund
ANZ Limited
Telstra Corporation
CSL
Wesfarmers

Not a bad portfolio for the past 10 years … but, the tide for the banks has already turned with low interest rates affecting margins, increased competition from the more nimble digital banks, the Hayne Royal commission “blowback” forcing the banks to separate from their profitable wealth management businesses, and recent dividend cuts announced. A closer look at the top 5 SMSF shares with financial statistics from the excellent marketscreener.com. The 1-yr returns over the past year for each stock are lifted from marketindex.com.au .

SMSF 2017 Top 5 Shares P/E 2020Yield %ROE %1-yr Ret %
Commonwealth BankCBA155.51312.4
Westpac BankWBC145.911-3.7
National BankNAB1261216.7
BHP BillitonBHP125.32210.9
ANZ ANZ12612-3.9
Average 135.7146.5

Slack Investor can understand the lure of juicy bank dividends for SMSF funds. But, if the dividend is coming with a reducing share price due to the bank business shrinking – then this is not a good deal – and perhaps look to higher yield industrial shares or industrial/office REITs for that cherished income rather than banks.

Sing the praises for Return on Equity (ROE) and Earnings per Share (EPS) Growth

This is one of the first financial statistics that I look at when deciding on a company to buy. Return on Equity is a company’s Net Profit ÷ Average Shareholder Equity. If a company had a net worth of $10 million and made a profit of $2 million, its ROE would be 2/10 x 100 = 20%.

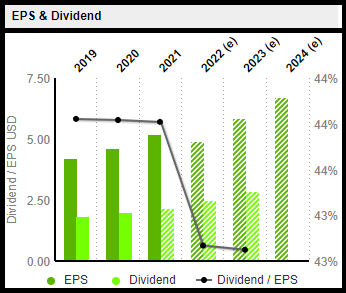
High ROE companies generate a lot of cash – this cash they can then use to grow their business. If they also have a good increase in their Earnings Per Share (EPS) – Slack Investor would classify them as “Growth” Companies.

CSL Earnings per Share- and projected EPS for 2022 -2024

Generally, companies with a ROE of >15% get Slack Investor’s attention but some businesses require lot of infrastructure before they can generate profit. For this reason ROE is best used to compare companies in the same industry. For contrast with the 2017 SMSF, let’s have a look at Slack Investor’s Top 5 stocks from the Portfolio page (This is not advice!). Data gathered from marketscreener.com and marketindex.com.au .

Slack Investor Top 5 Shares P/E 2020Yield %ROE %1-yr Ret %
CSL LtdCSL381.23538.3
Altium LtdALU461.63144.9
Cochlear LtdCOH411.73826
Macquarie Group LtdMQG164.41611.5
REA Group LtdREA401.33527.9
Average 362.03129.7

The average ROE for the Slack Portfolio is much higher than for the 2017 SMSF top 5 (31% vs 14%) . They also all have a projected increasing Earnings per Share (EPS) – and this indicates the Slack preference for growth companies.

However, with growth comes volatility and the Slack Investor top 5 would not suit those who rely on their investments for income. The Slack portfolio would probably suit an investor with a longer term view and a separate income. If you are still working and want to grow your wealth through shares … then the ROE should be one of your guiding lights for company selection.

The Real October 2019 – End of Month Update … and Australia’s debt binge

Apologies to my faithful email subscribers, two days ago an unfinished version of this post was released into the ether. Slack Investor has rudimentary skills in the blogging arts and didn’t know how to recall the post. Anyway … this is what it was supposed to look like – with all information updated!

Slack Investor remains IN for Australian index shares, the US Index S&P 500 and the FTSE 100.  The Slack Investor followed overseas markets are a mixed bag with a flat ASX200 (-0.4%), and a dropping Brexit plagued FTSE100 (-2.2%). The good old US has shrugged off chants of “Lock him up” for their president and the S&P500 has had a monthly increase of 2.4%.

The Federal Reserve bank of Cleveland have the probability of a US recession within the next year at 31.0%, this has been gradually dropping since a peak at 41% two months ago. However, the current value exceeds the Slack Investor threshold of 20% and my monthly stop losses for Index funds are definitely “switched ON”

All Index pages and charts  have been updated to reflect the monthly changes – (ASX IndexUK IndexUS Index).

Household debt – the couch is getting a little uncomfortable

According to 55,000 respondents to the ABC’s Australia Talks National Survey, debt is a major problem for the nation.

On an individual level, 37 per cent are struggling to pay off their own debts, with almost half of millennials reporting that debt is a problem for them personally …

Australia Talks National Survey

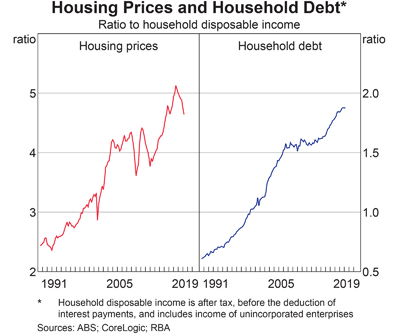
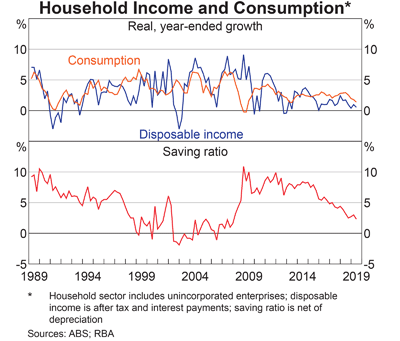
Australia may not be in the top four countries for Rugby these days but we are one of the world leaders in terms of household debt. In fact, we are second only to Switzerland. I am ashamed to say Australia’s Household Debt is world class and edging towards 200% of income. With such a big chunk of our disposable income leaking to debt, it is no wonder that recent interest rate cuts are not having much effect on the economy as Australian consumers try to tighten the belts. According to the Reserve Bank, it seems that, with stagnant wages growth, most are coping with their debt by reducing their consumption.

Basically, the Australian economy is facing a long period of sluggish demand growth as our record high household debt becomes a giant millstone around the economy’s neck.

From macrobusiness.com.au

Debt can be multi-headed with mortgage, credit card, personal loans and education components. The ME Bank survey has found that there is stress in some parts of the community. If your employment income is steady, in these reducing interest rate times, the fortunate have been able to keep up existing monthly payments to reduce overall debt. This is a good strategy. Most Australian homeowners are ahead of their payments – so there is a bit of a buffer. RBA statistics show that the average borrower is almost 36 months ahead of their required payments. Though, there are worrying signs in some households.

Of households with debt, there was an increase in the
number expecting they ‘will not be able to meet their
required minimum payments on their debt’ and ‘can just
manage to make minimum payments on their debt’ in
the next 6–12 months – 43% combined compared to
38% in December 2017.

ME Bank survey 

With the number of mature-age Australians carrying mortgage debt into retirement increasing rapidly, many are intending to use a portion of their super (which was supposed to fund retirement!) to try to extinguish their debts when they retire. The ME Bank Survey found that even with compulsory superannuation, only around 18% of households expect to ‘fund retirement with their own super’ (down four points in the past six months). The proportion of households expecting to ‘use both private savings and the government pension’ increased two points to 42%.

I hope that our politicians have a plan for all of this – although, as this involves a bit of thinking beyond the next election, I doubt it!

Portfolio Trim and Fitcats

From House Beautiful – May be subject to copyright

On the theme of a trim … who doesn’t like a bit of topiary. My portfolio has had a little haircut in the past 3 months as I have been thinking about the potential of a recession and the effect it might have on my investments. Lacking the skills of Nostradamus, Slack Investor has chosen the “middle path” for his individual stocks i.e . Between doing nothing and “selling everything”, I have chosen to fiddle with about 20% of the portfolio. Some of the things I have bought are expanded on below, in order of investment commitment. This is not advice, just a random walk through stock selection. To make room for the new purchases I sold a few high PE stocks and a few underperformers. The sold stocks include APX, CGC, PMC, AGL and CTD.

Alphabet -Google ( GOOGL)

This is new ground for Slack Investor as GOOGL is US based company and the investment has the additional complexity that I have to use an international broker (Saxo) to purchase shares on the NASDAQ exchange. But, I feel the extra effort is worth it as I can’t think of a better company to ride with through the next 10 years.

Google search has 92% global market share. Chrome is the world’s most widely used web browser. Android is the world’s most popular mobile operating system with 2 billion-plus active users. YouTube is watched for more than 1 billion hours a day. Alphabet has about US$100 billion in cash which, for a sense of scope, is larger than the combined market values of TelstraWoolworths, and Macquarie.

Joe Magyer from Motley Fool on the dominance of Google’s Alphabet

I use Google products countless times a day and with a Return on Equity of 21 % and a reasonable Price Earnings ratio (for the growth tech sector!) of 24. I would like to own more of this and will seek to add to my position over time. The international shares thing is a bit of a hassle and has some extra expenses. A far easier, way to get a slice of Google (and other great tech growth companies) is by buying the Australian-listed NASDAQ ETF (NDQ). Alphabet represents 8.6% of the NASDAQ Index.

Vanguard Australian Fixed Interest ETF (VAF)

For ETF’s, I naturally lean towards Vanguard due to their relatively low fees and a commitment to keep them low (Thanks Jack Bogle!) I bought this ETF to try and derisk my shares portfolio by getting some exposure to the Australian Government Bond and Fixed Interest Market. I have also bought some Vanguard Emerging Markets ETF (VGE) and Vanguard Global Infrastructure (VBLD).

Centuria Industrial REIT (CIP)

The lure of property rentals during tough times and a bit of exposure to Industrial Real Estate has brought me to this area. I was tossing up buying Goodman (GMG) or Centuria. Both have a similar Weighted Average Lease Expiry (WALE) and occupancy rate. GMG has a relatively high 2020 PE of 26.1 compared with a CIP 2020 PE of 14.8. CIP also has a more fruity yield of 5.7%. Case Closed.

United Overseas Australia (UOS)

A Malaysian real estate developer … Steady on, this sounds a bit wacky! – UOS is a bit of a speculator for Slack Investor. Real estate is a place where I am underdone and I am alway convinced by good arguments. A respected investor (by me), Tony Hansen, from EGP Capital has this stock as his highest portfolio allocation. UOS has a solid cash position, a decent yield and the discount to net worth got me over the line. What is life without a little bit of risk!

Fitcats – Get your super runnin’

With apologies to the legendary Steppenwolf, Slack Investor has the news from Chris Brycki (the tireless CEO of Stockspot and author of the Fatcat/Fitcat report). He has produced his yearly assessment of the best super funds (Fit Cats) and the worst (Fat Cats). Fat Cat Super Funds on average charge 2% a year in fees, while, in comparison Fit Cat Super Funds charge less than 1% a year in fees. 

“One of our golden rules of superannuation is; the less you pay, the more you get. Always pay less than 1% p.a. in fees so your super isn’t eroded by high fees. I know 1% doesn’t sound like a lot, but for the Aussies stuck in these Fat Cat Funds they’ll be worse off by $200,000 or more compared to their friends who are in a low-fee fund,” 

Chris Brycki, Stockspot

So, if you haven’t already done so … get financially fit, grab yourself an account number in one of these top performers. Most will allow new customers. Then continue to get some Fit Cat action by asking your employer to make any future contributions to your new account. Then rollover your super to the new fund and your sweet.