Warren Buffet and his offsider the late Charlie Munger are dead set Slack Investor Heroes – and a reminder that the USA offers a crucible for outstanding qualities to emerge in individuals – as well as, in some presidential types, some not so good qualities. Mr Buffet is a great investor and philanthropist and full of insightful but humble advice that is worth heeding. Every November he writes a letter to his Berkshire Hathaway shareholders and it is a delight to read in full. This will be his last shareholder letter as he is retiring at the grand age of 95.
‘Our stock price will move capriciously, occasionally falling 50% or so as has happened three times in 60 years under present management. Don’t despair; America will come back and so will Berkshire shares.’ – Berkshire Hathaway 2025 Newsletter
Even investors as great as Warren Buffet are not immune to large market swings. After all, it is your long-term performance that is the most critical for a lifetime investor.
‘Since 1965, shares of Warren Buffett’s conglomerate, Berkshire Hathaway (BRK.B), have delivered a compounded annual return of 19.9% — almost double that of the S&P 500 over the same period.’ – Investopedia using data from the Berkshire Hathaway 2024 Newsletter
Warren Buffet liked to look at current market valuation (S&P 500) as a ratio with the current US Gross Domestic Product (GDP). At 30 June 2025 the ratio was 217%. A long way above the trend line and a warning that the S&P 500 was growing at a rate much faster than the general economy – this is a danger sign.
The Buffet Indicator is the ratio of the total United States stock market to GDP. The ratio is now two standard deviations away from the historical trend line – from Current Market Valuation
Market Value – November 2025 Update
Slack Investor also likes to keep up to date with how the markets are travelling for value and he has been using charts for the Cyclically Adjusted Price to Earnings ratios (CAPE). This value is also known as the Shiller P/E Ratio after Robert Shiller the economics professor that made this measure popular. Slack Investor first started using CAPE as a ‘value’ tool in September 2021. The most recent post on Market Value was mid-April 2025 about 6 months ago.
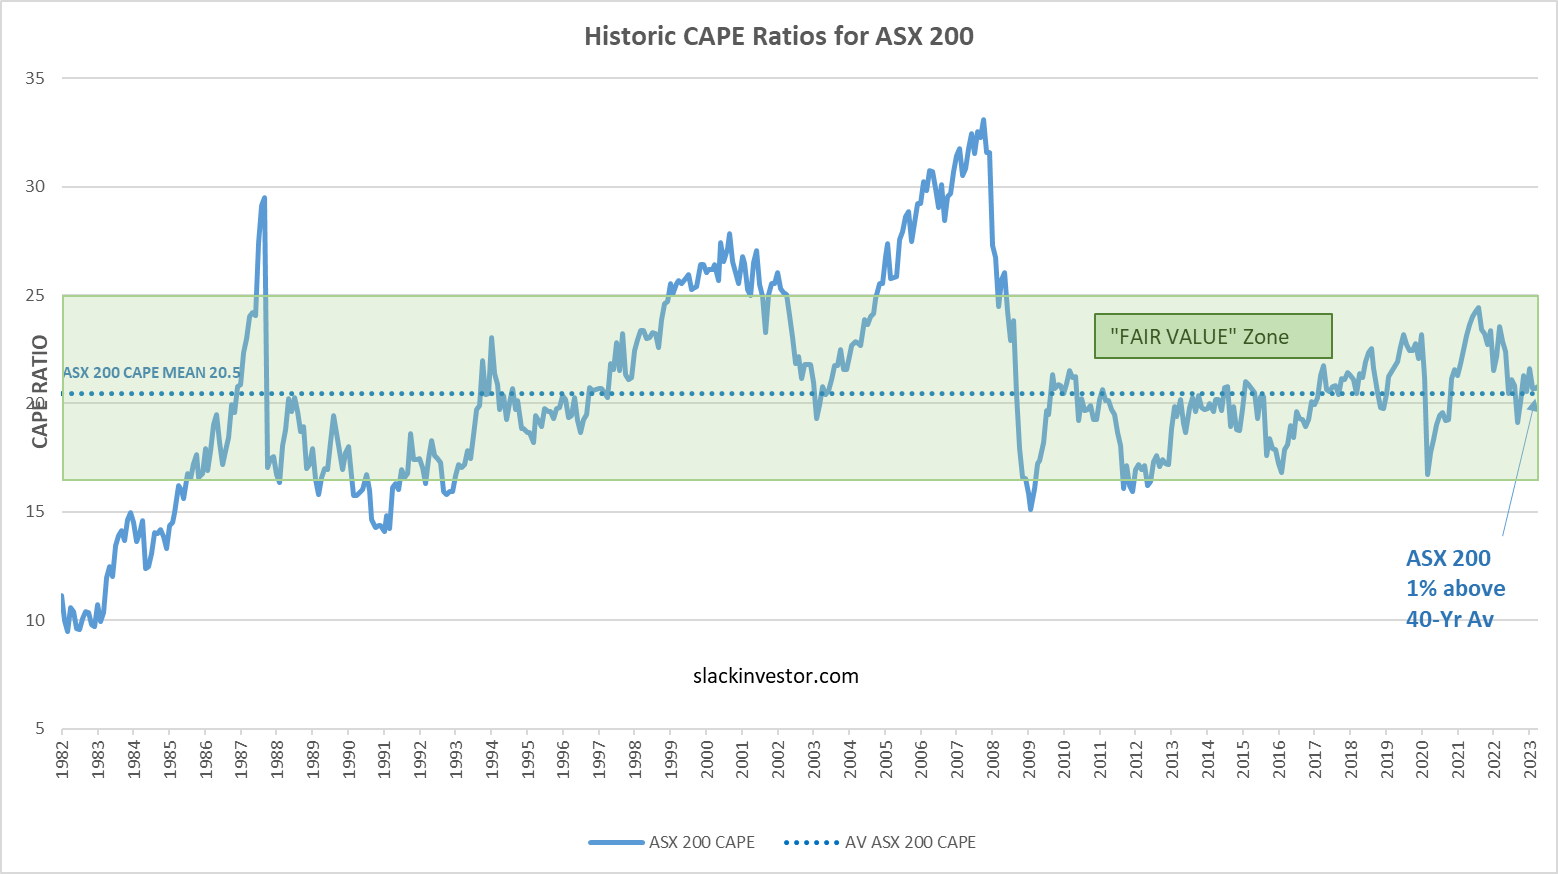
For the following charts, Slack Investor uses monthly CAPE data from Barclays, the 40-yr mean is calculated and plotted together with the latest actual CAPE values up until 31 October 2025. A ‘fair value’ zone is created in green where the CAPE is within one standard deviation of the mean (average) – click images for better resolution.
ASX 200 CAPE Value 22.89 (11% above long-term av.)
ASX CAPE values – up to 31 October 2025
FTSE 100 CAPE Value 18.24 (5% above long-term av.)
UK CAPE values – up to 31 October 2025
S&P 500 CAPE Value 39.76 (59% above long-term av.)
US CAPE values – up to 31 October 2025
The UK and Australian markets are not too overvalued. However, in terms of the Shiller P/E the S&P 500 has entered some lofty territory. Unfortunately, whenever the S&P 500 has a large correction the effects are usually felt in other markets.
There is some good research that links CAPE to long-term returns … and future returns are what gets Slack Investor excited. The predictive skill of the Schiller CAPE is not very good over 1-yr and 5-yr periods. However, it does show some skill for periods of 10 years and longer. The tight spread around the trend line indicates that the Shiller P/E might have some predictive skill.
Shiller P/E and S&P 500 10-year annualised forward returns since 1983. The data shows 41 years of S&P 500 10-year average annual returns based upon the Shiller PE ratio (from 10 years ago). Slack Investor has modified the chart and circled the 10-year average returns based upon the times when the Shiller P/E was previously around 40 – From Invesco.com
If this relationship holds, the average S&P 500 10-year annualised forward returns are predicted to be close to zero or negative. This indicates that now is not a good time to start buying the S&P 500. Tech stocks (with high P/E) have fallen sharply lately and this could be early signs of a readjustment.
Slack Investor is not one with predictive skills. He just plods along – staying mostly invested and knowing that he has his stable income pile to ride out any market gyrations. Cripes … even the great Warren Buffet’s Berkshire Hathaway stock had 11 negative years between 1965 to 2024. Slack Investor could only dream of emulating the Buff’s long term compounded annual return of 19.9% over 55 years.
Slack Investor reads a lot of finance news each week. Sadly, there now seems to be a portion of the finance news that seems to come from AI sources. However, there is still a lot of good stuff by real people – and he came across an excellent article by Carl Capolingua that had some great investor truths that apply to the current market.
A disciplined investor doesn’t fight the market – they respect it. They accept the market is responsible for their investing outcomes, win, lose or draw. They also accept that they have absolutely no control over the market or the outcomes it delivers. – Carl Capolingua, Livewire Markets
The original article focuses on the difficulty of letting go of investments that have shown a loss. Slack Investor is still searching for this zen state and has written about his own troubles with selling stocks that have had a sudden fall. However, the quote above sums up ‘the bargain’ that Slack Investor has made with stocks and their volatility. I don’t know when the next correction (or worse!) is coming … but I know it’s coming.
World Markets are Expensive at the Moment
Although Slack Investor collects his own data on relative market value using CAPE numbers, the remarkable Ashley Owen has produced a great graphic showing the relative size of the world markets and how expensive they are at the moment in terms of PE and Yield. Clearly, the US market looks over ripe and any corrections here will historically influence all other markets.
World markets plotted by PE Ratio and Yield – From the very erudite Ashley Owen of Owen Analytics
Short-term Returns are Volatile
The chart below shows that the S&P 500 returns for a calendar year are all over the place, but if you just hung on, and didn’t sell the S&P 500 when times were tough, you would be rewarded with an average annual return of 12.2% over 30 years. Not Bad. Australian shares have returned an average yearly gain of 11.5% from 1900 to 2020.
Yearly Returns of the S&P 500 (green columns) and 15-yr rolling returns (blue line) – From T. RowePrice
Slack Investor knows that for an ordinary person, the stock market is the place with best long-term returns with minimal transaction costs. The bargain – to accept volatility in return for long-term gains – is accepted.
He tinkers with his Investment Portfolio of predominantly growth shares, but mostly he leaves it alone.
He will not sell his shares after a correction and convert to cash.
He has elevated his cash position slightly (6% cash, 94% invested) in case some bargains come up post-correction.
These are choppy times and there is an uncertain near-term future – situation normal in the stock market. Some of his portfolio (e.g. CSL, WTC, TLX) have had big falls lately. However, Slack Investor has had a look at future revenue predictions and has not completely given up on these stocks. Though, CSL is losing its shine as a growth company in Slack Investor terms.
He will keep riding that stock market horse … and push to the forefront of his mind the pleasant times at the rodeo bar with his cowboy mates … reflecting on our glorious achievements.
October 2025 – End of Month Update
Slack Investor is IN for Australian index shares, the US Index S&P 500 and the FTSE 100.
The S&P 500 (+2.3%) and the FTSE 100 (+3.9%) have continued their strong monthly growth. Slack Investor is pleased to stay on board but there he remains nervous about the US markets. For the ASX 200, (+0.4%) a flat month with plenty of volatility.
All Index pages and charts have been updated to reflect the monthly changes – (ASX Index, UK Index, US Index).
Apologies to all readers who may have jumped on the CSL train in the past 5 years due to Slack Investor continually ‘bigging up’ this grand old stock. He has always been impressed with companies that spend a good portion of their profits in Research and Development.
‘CSL have committed to spending 10% of global revenue on R&D for new and existing products.’ –Livewire
Slack Investor has been a holder of this company since the ‘good old days’ (before 2020). But has occasionally topped up when the price dipped below $300. So, he does share some of the recent pain.
The latest price slump was on the back of the FY 2025 results and the announcement that one of CSL’s components, CSL Seqirus, was to be demerged. The markets were not that impressed with the planned restructure and slowing growth momentum.
However, some sectors of the business are doing well. CSL Behring and CSL Vifor reported strong growth.
This CSL horse should have some good riding ahead
The 2025 AGM indicated that management were taking the knife to costs and staff in a restructure of the business that is underpinned by the Seqirus spinoff and $500 million in pre-tax savings.
‘Despite all the headwinds from competition and regulatory price cuts, they’re (CSL) still growing double digit. I think that’s a pretty good business.‘ Daniel Moore – IML, reported in Livewire
When nervous … Slack Investor will always go back to the numbers. Market Screener – Finance Tab for CSL supplies some of the answers. The Income chart looks healthy.
Income (Black) and projected income (Striped Grey) for CSL – Market Screener
Looking at the projected PE, ROE and growth from Market Screener – future predictions look OK.
Another wild month. The S&P 500 (+3.5%) and the FTSE 100 (+1.8%) remain in all time high territory. The ASX 200 sputtering and down 1.4% for the month.
Slack Investor remains IN for all markets.
The recent strength of the US market has pushed the closing monthly value to more than 15% above my old stop loss. I adjusted the stop loss upwards to a new ‘higher low’ of 6212 for the S&P 500.
All Index pages and charts have been updated to reflect the monthly changes – (ASX Index, UK Index, US Index).
The quarterly updates showing the current holdings and cash position of the Slack Portfolio have also been completed.
Slack Investor Hero John ‘Jack’ Bogle with a fitting ‘HOLD’ mantra.
Bogleheads and Vanguard
Slack Investor has paid tribute to the contribution that Jack Bogle has made to the investing world. He started Vanguard Investments in 1974. Bogle’s philosophy wasn’t about trying to beat the index and charging high costs – instead, he would offer a low-cost alternative fund based on the US index. Mr Bogle’s pioneering work with these low-cost funds has led to the popular low-cost Exchange Traded Funds (ETF’s) that proliferate today. Astonishingly, there are now more ETF’s listed in the US (4300) than actual companies (4200).
Slack Investor can well remember the days when a fund manager would charge you 4% of your capital for entry and then lift a further 2-3% in annual fees for the privilege of investing your money – that was not the ‘good old days’.
‘Bogleheads’ are a group of mainly US followers of Jack Bogle’s philosophy and they strive for long-term growth through low-cost, diversified index funds while minimizing fees. They are generally ‘Buy and Hold’ investors. One of their strategies is the three-fund portfolio – where investing is simplified into three low-cost funds – one for the local share market, one for international shares and one for bonds. For the US, the conservative recommended proportions are, your age defines the % in Bonds and the remainder percentage is split so that roughly 20% is in international equities.
In Australia, such a portfolio is a little more complicated as you need to cover yourself for currency risk – and hedge your international exposure for any fluctuations in the Australian dollar. Exposure to emerging markets is also recommended as a diversifier of risk. A Bogleheads type of portfolio is possible using 5 Vanguard funds.
The 5 ETF’s for an Australian Bogleheads portfolio. Management Expense Ratios (MER) ar shown for each ETF. For a younger person, Australian Bogleheads suggest proportions VAS: 20%, VGAD: 20%, VGS: 40%, VGE: 10% and VAF: 10% – From Passive Investing Australia.
Slack Investor can see the attraction that Bogleheads have in passive investing and, when he loses his mojo, will opt for a more simplified Boglehead-approved passive exposure to growth and cash/bond assets. Stockspot also offer diversified portfolios using just 5 ETF’s – with excellent performance so far.
Vanguard Financial Year Total Returns for major asset classes
Extract from the FY 2025 Vanguard Index Chart Brochure showing the total returns for each asset class for the financial years since 1996. Top performing asset class for the year is highlighted in green and the worst in pink.
Vanguard Annual Chart
It is now time for Slack Investor’s favourite chart – a succinct demonstration of long-term investing. The essence of successful investing is to be invested at leastsomewhere in appreciating assets – and then, let time do its work. Below is an extract from the Vanguard 2025 long-term investing chart. The numbers on the right are the results of investing $10,000 in the Index funds of the indicated asset classes for 30 years.
Extract from the 2025 Vanguard Index chart (Just the 2007-2025 portion is shown) – the dollar values on the right are the results of investing $10,000 in index funds in each asset class for 30 years (since July 1995). – Check out the full 30-year glory of the Vanguard 2025.PDF chart – Click image for the whole 30-yr chart.
August 2025 – End of Month Update
Slack Investor is IN for Australian index shares, the US Index S&P 500 and the FTSE 100.
The S&P 500 (+1.9%) continues its progress. Slack Investor is pleased to go with the flow but remains nervous for the US markets. For the ASX 200 (+2.6%) and the FTSE 100 (+0.6%), also some monthly gains.
The latest reporting season has brought a few shocks to the Slack Portfolio. Big falls in Botanix (BOT), Telix Pharma (TLX), and CSL. Not so worried about CSL, but looking to reduce holdings in the less established companies (BOT, TLX) when things settle down. Next blog, Slack investor will go into detail how he is dealing with a few sudden drops in individual stocks.
All Index pages and charts have been updated to reflect the monthly changes – (ASX Index, UK Index, US Index).
Slack Investor likes to measure things, especially long-term results. In the world markets, for FY 2025, the FTSE 100 Total Return Index was up 10.8% (FY 2024 up 11.8%). Dividends helped the Australian Accumulation Index to be up 9.0% for the financial year (FY 2024 +12.2%). The S&P 500 Total Return Index is again the top performer – and was up 15.2% (FY 2024 +24.2%). All of these Total Return Indices include any accumulated dividends.
Slack Investor has stuck to his strategy of mostly investing with growing companies that are profitable (Return on Equity >15%), have an established earnings record and, not too expensive (forward P/E ratios <50). He expects a bit of volatility in his growth oriented investment portfolio. He is reassured that, despite the odd negative year in the Slack Fund, the dividends and his separate Stable Income portfolio are doing what they should – keeping Slack Investor with enough cash to ‘keep the wheels on’ the Slack lifestyle – should the stock market sour.
Slack Portfolio Results FY 2025
All Performance results are before tax. The Slack Portfolio is Slack Investor’s investment portfolio. He is glad to report an annual FY 2025 performance of +18.1%. Full yearly results with Australian benchmarks are shown in the table below. Slack Investor realises that only long-term results really count.
For property values, Slack Investor is using the Home Price Index supplied by PropTrack. The Index uses median values for each city – I would have preferred calculations that include the net rental yield, but this will have to do. Of course, the real estate industry avoids true measurement of real estate performance by collecting figures only on gross price changes – they ignore the significant transfer costs involved (Stamp Duty, Conveyancing, Bank Fees, etc) and, the costs of any home improvements and renovations.
For FY 2025, the Australian Share market Total Return Index (ASX200 Acc) was up 9.0%. The Vanguard Diversified Growth ETF (VDGR), comprising International shares (42%) and Australian Shares (28%), increased by 12.7%. Inflation is now within the Reserve Bank target – with the CPI at +2.1%.
The Cash rate of 4.3% is above inflation. Cash is important – but not a way to grow your wealth. The average readily available cash rate of return since 2010 is 2.6% and, for cpi measured inflation, it is 2.7%.
Although Slack Investor collects yearly figures, the 5 and 10-year compound annual performance gives me a much better idea about how things are really going. Long-term results will smooth out any dud (or remarkable!) yearly figures. The Slack Fund is still ahead of most Benchmarks – but running a close second is Brisbane Residential real estate over a five-year period.
The Slack Fund average 5-yr compound yearly return vs BENCHMARKS in chart form.
10-year compound annual rate of return
The Slack Fund has been around a while and generating some good long term data (10-yearcompound ‘rolling’ annual rate of return). Over this time frame, the Slack Fund has been performing very well. For FY 2025, a 10-year annual rate of return of over 17% – Go Slack Fund! The 10-yr data is shown below in table and chart form.
It is useful to note that, the 10-yr rates of return for the Median Balanced Fund, Vanguard Growth fund, ASX200, and residential property in Brisbane and Melbourne are also good long-term investments. These appreciating assets generate a 10-yr compound annual rate of return in the region of 6-9% p.a.
The Slack Fund average 10-yr compound yearly return vs BENCHMARKS in table form. Prior to 2022, 10-yr Vanguard Growth fund figures were not available. AV. YEARLY is the annual mean of all the data since 2019.
Although Cash is necessary to add stability and flexibility to a portfolio. From the chart below, Cash as a long-term investment vehicle, is a poor choice.
The Slack Fund average 10-yr compound yearly return vs BENCHMARKS in chart form.
15-year compound annual rate of return
Perhaps because Slack Investor is showing signs of age, he notices that there is enough accumulated data for rolling 15-yr rates of return. Happy to report solid long-term results.
The Slack Fund average 15-yr compound yearly return vs BENCHMARKS in table form.
Growth of a $10 000 Investment Since 2009
The beauty of compounding with a succession of good performance results can be seen in the chart below showing the growth of an initial investment in June 2009 of $10 000.
The Slack Fund has exceeded my expectations. Also, the chart shows that investing in either shares or residential property has been a solid way of growing your money over the long term.
‘Do not judge me by my success, judge me by how many times I fell down and got back up again.’
Nelson Mandela
Slack Investor is obviously not in Nelson Mandela’s league … but I do admire President Mandela’s resilience. Learning to live with stock prices that go down is an important part of successful investing.
This post is a bit of an annual ‘poke around’ in the portfolio. The percentage yearly returns quoted in this post include costs (brokerage) but, the returns are before tax. This raw figure can then be compared with other investment returns.
I use the incredibly useful Market Screener to analyze the financial data from each company. This excellent site allows free access (up to a daily limit) to their analyst’s data, on the financials tab for each stock, once you register with an email address. Slack Investor extracted the predicted 2027 Price/Earnings (PE) Ratio and Return on Equity (ROE) and average forecast revenue growth for the financial years 2025, 2026 and 2027. He then condensed all this information into one number, the Slack Factor, to make things easy for Slack Investor’s limited brain. The Slack Factor is still ‘experimental’ but, increasingly, Slack Investor is using it to differentiate between stocks – the higher Slack Factor, the better.
Slack Investor Stinkers – FY 2025
Financial year 2025 was big on volatility. Despite this, Slack Investor’s followed markets all ended up with solid total returns when dividends are taken into account. Australia +9.0%, the UK +10.8%, and the US +15.2%. Slack Investor knows that stinkers are a part of the game, even in good years – and managed to attach himself to a few stinkers along the way.
Webjet (WEB + WJL) -46%
This is a complicated story as Slack Investor bought into Webjet (WEB) which then split into two entities. The ‘sizzle’ was that Web Travel Group contained a wholesale booking business that was growing fast. Suffice to say, that sales didn’t meet expectations and both companies sank. He then lost faith and sold both. When it comes to the travel business, Slack Investor wants to be only a consumer as there seems too much competition in this field.
CSL (CSL) -18%
(CSL – Forecast 2027: PE 22, ROE 18%, Av. Growth 14%, Slack Factor 12). CSL is a big holding for Slack Investor (10% of portfolio) and, for the past 6 years, has been rangebound between $230 and $330. It has not had the chart of a growth stock but, they have continued to spend on Research & Product Development at levels around 10% of revenue. This should be a good thing for future earnings. The eternal optimist in me is thinking … this is the year! But, I also thought this last year … and the year before … there is a strong chart signal this year though – the powerful ‘wedgie’! If it wasn’t already such a large part of my portfolio, now would be a good time to buy.
Botanix Pharma (BOT) -12%
Slack Investor entered the murky and volatile world of Biotechs with a small stake (0.2% of portfolio) in Botanix Pharmaceuticals. So far, not very good! It seems there is a lot that can go wrong in this field for startups.
Slack Investor also went backwards with his holdings in Dicker Data (DDR), GlobalX ACDC ETF, and Cochlear (COH) – all now sold. Wisetech (WTC) and Alphabet (GOOGL) were also on the slide but, thankfully now recovering.
Slack Investor Nuggets – FY 2025
Nuggets are a blessing in any portfolio – this Financial Year, there were some bewdies. Slack Investor continues to invest in high Return on Equity (ROE) companies with a track record of increasing earnings. If expectations are met, companies with these qualities sometimes behave as ‘golden nuggets’.
TechnologyOne (TNE) +124%
(TNE – Forecast 2027: PE 64, ROE 34%, Av. Growth 20%, Slack Factor 11). Technology One is a great Australian success story. It sells software as a service to other companies internationally. I first came across this company through Rudi Filapek-Vandyck – who included TNE as one of his ‘All Weather’ stocks. Glad to be an owner of TNE, as well as owning many other of Rudi’s All Weathers. Very highly valued (2027 PE 64) now though!
Pro Medicus (PME) +104%
(PME – Forecast 2027: PE 154, ROE 53%, Av. Growth 38%, Slack Factor 13). Pro Medicus is a developer and supplier of healthcare imaging software and services to hospitals and diagnostic imaging groups. The Price to Earnings ratio is frighteningly high (2027 PE 154) – but Slack Investor is enjoying the journey.
Codan (CDA) +75%
(CDA – Forecast 2027: PE 27, ROE 23%, Av. Growth 20%, Slack Factor 17). Codan is a technology company that specializes in communications and metal detecting. It is one of Slack Investor’s core holdings. CDA has had a checkered past – a nugget in FY 2021 (+161%), a stinker in FY 2022 (-58%), a nugget in 2024 (+54%), and again, a nugget (+75%) in 2025. What has kept me in the stock was its low debt, (generally) increasing earnings, and the high profitability (ROE 23%).
Supply Network (SNL) +70%
(SNL – Forecast 2027: PE 30, ROE 38%, Av. Growth 18%, Slack Factor 23). Supply Network are a bus and truck parts distribution company using the Multispares brand. Although there are competitors in the big-vehicle parts business, what sets SNL apart from the rest is their great management and strict adherence to processes and efficiency. They have consistently held a profitability advantage over their rivals. They have maintained a high Return on Equity (ROE) of 36% even as the company has expanded and grown in price. What a well-run company!
Megaport (MP1) +52%
(MP1 – Forecast 2027: PE 74, ROE 18%, Av. Growth 55%, Slack Factor 13). Megaport provides software that helps other companies tocreate and manage secure network connections between offices and the cloud. They must be doing something right as their average predicted revenue growth for the next 3 years is 55%! I’m in, but this is one of Slack Investor’s more risky buys!
Nick Scali (NCK) +43%
(NCK– Forecast 2027: PE 18, ROE 28%, Av. Growth 14%, Slack Factor 22). Nick Scali is well known in Australia for importing and retailing furniture. They have done an excellent job of expanding their business in Australia due to their fine management skills. They expanded into the UK in 2024 and have been quietly, and efficiently, getting on with the job. Future profitability remains good (ROE 28%), and PE not too high.
Some very honourable mentions to some top results this year that didn’t quite make the nuggets. BetaShares Global Cybersecurity ETF (HACK)+38%; Resmed Technologies (RMD.AX)+38%; XRF Scientific(XRF)+37%; Wesfarmers(WES)+35%; Coles (COL) +29% and REA Group (REA) +24%.
Slack Investor Investments performance – FY 2025
After a bonanza FY 2024, this was a wild ‘Trump affected’ FY 2025. In the Australian superannuation scene, the median growth fund (61 to 80% in growth assets) did manage to return+10.5% in FY 2025.
Slack investor has just two piles of funds for his retirement – the Stable Income pile (Cash and Conservative) and an Investments Pile. The Stable income represents around 25% of total retirement funds. I used to rebalance each of my piles after every year, but the stable pile now has enough in it that, together with dividends from my investments, could supply me with enough living expenses to last out an extended (3-yr) bad run of the stock markets. Slack Investor would not be forced to sell stocks. The stable pile has again produced a moderate return of nearly 5% (inflation plus ~ 2.5%).
The Investments Portfolio rise nicely with preliminary figures showing an 18.1% rise at June 30, 2025. A good result for Slack Investor in his growth investments pile. Including the relatively low returns from my stable income pile (4.7%), overall, the weighted return on all my retirement funds grew 14.6%.
For the most part, Slack Investor concentrates his annual performance details for the much more exciting Investments pile.
For Slack Investor, the 5-yr performance is a more useful way of measuring – as it takes out the fluctuations of yearly returns. At the end of FY 2025, the Slack Investments Portfolio has a compounding 5-yr annual return of around 15%. Full results and benchmarks expected next post.
July 2025 – end of Month Update
The new financial year has started off positively for Slack Investor markets. The ASX 200 + 2.3%; FTSE 100 +4.2%; and S&P 500 +2.2%. He remains IN for all index positions.
I have taken the opportunity to adjust upwards the stop losses on all followed index markets. The prices had crept up to around 15% above their old stop losses. See Index pages for details.
All Index pages (ASX Index, UK Index, US Index) and charts have been updated to reflect the monthly changes.
Slack Investor has a healthy regard for those who make a living based upon their performance. It is a general financial wisdom that, if you are following large companies, you will very probably be better off in the long term with passive index funds.
Percentage of active funds that underperform (orange) over a 15-yr period – Spiva
However, some active boutique stock pickers may have an advantage when it comes to smaller international companies. In this category, 33.65% of active funds are able to outperform over a 15-yr period.
Slack Investor is currently backing his own abilities on the stock picking front. But, there will come a time when I lack the ability or inclination to do the (admittedly limited) research work. Also, there are some Slack Investor readers who would like to outsource this task.
Hyperion Global Growth Companies Fund ETF (ASX: HYGG)
I don’t follow individual companies in overseas markets that closely – but there are those that do – and do it very well.
HYGG is not a low-cost fund as it has a Management Expense Ratio of 0.70% and an outperformance fee of 20% against benchmarks. The ETF, to date, has not paid a dividend. However, in this case, it seems that the managers are offering good value net of fees.
Growth of the Hyperion Global Growth Companies Fund after fees and costs have been extracted since 2014 – Hyperion
One-year performance (2024 May +47.3%) is impressive. However, Slack Investor is after the real grafters who can produce impressive results over the long-term. Hyperion is establishing a case for consideration.
5 and 10 year Performance of HYGG – net of fees – Hyperion
The advantage of an active fund manager is that they can be nimble and take advantage of any opportunities that the Hyperion analysts discover.
Holdings
% Portfolio Weight
1-Year Return
Forward P/E
Tesla Inc
12.29
65.9
166.67
ServiceNow Inc
9.42
34.16
60.98
Microsoft Corp
7.95
10.73
33.11
Palantir Technologies Inc Ordinary Shares – Class A
7.65
498.55
263.16
ASML Holding NV ADR
7.15
-20.81
28.74
Spotify Technology SA
7.1
143.26
71.43
Amazon.com Inc
7
12.14
33.67
Block Inc Class A
5.72
2.88
17.73
Meta Platforms Inc Class A
4.61
41.9
28.65
Table of the top holdings of HYGG, their portfolio weight, 1-yr return, and forward PE at May 2025.
When it is time to really ‘get on the couch’, Slack Investor would take a look at these blokes to invest his money. This Hyperion crowd seem to know what they are doing.
June 2025 – End of Month Update
The financial year closes and the Australian, UK and US markets are all in positive territory for the financial year.
Slack Investor remains IN for all followed markets. The ASX 200 (+1.3%) and FTSE 100 (-0.1%) moved modestly. It is a continuation of good times in the US with the S&P 500 rising 5.0%. Are our American friends delusional in an expensive US market? Or, is Slack Investor missing something.
All Index pages and charts have been updated to reflect the monthly changes – (ASX Index, UK Index, US Index). The quarterly updates to the Slack Portfolio have also been completed.
Examples of the reams of CHESS holding statements that have cluttered my mailbox for years
I have never had a dispute with my broker about how many shares I own in a company … and, I am sure, that by waving a paper CHESS Holding Statement that I couldn’t dispute a logged transaction or a contract note. But, in an unexpected (due to very low expectations!) breakthrough from the ASX, they have finally opted for the possibility of a non-postal way of receiving your CHESS Holding Statement. But, of course, they have had to make the transition complicated.
Years ago, when Slack Investor first tried to get his holding statements electronically, he was told on the phone by the ASX that ‘it was impossible’ as they do not hold email addresses – just postal addresses for each holding! Hence the reliance on the postal service.
To get this started. you must contact your broker – who, is also your CHESS sponsor for your shares and ETF’s. In Slack Investors case, he has two Australian brokers: SelfWealth and Commsec. Each of them have to be informed – as each CHESS sponsor will have their own HIN for your holdings.
For SelfWealth, they have a link to explain proceedings. For Commsec, there is also a link to show the necessary steps. Slack Investor had to login then navigate to Portfolio / Holdings / View or Edit Account Details. Then elect to receive statements electronically.
In both cases, once you have opted in, you will receive multiple notifications from the ASX. A printed notification mailed to your postal address will confirm the change.
The CHESS statements Portal
There will also be an ASX CHESS Statements Portal registration email – where you will have to establish a username and password plus, an email confirming a change to communication preferences.
Phew … but it’s worth it! Slack Investor suggests you start this process now.
Once your email is registered with the ASX, future holding statements should be emailed. Slack Investor doesn’t even want that – the Broker tally of his shares is fine with him. Slack Investor’s preferred way of interaction will be through the CHESS statements login page – where you can view (or download) your statements.
May 2025 – End of month update
Slack Investor remains IN for Australian index shares, the recently bought US Index S&P 500 and, the FTSE 100.
May has been a good month for UK, US and the Australian Index.
The S&P 500 (+6.1%), the ASX 200 up 3.8% and, the FTSE 100 up 3.3% as the endless tariff fiasco unfolds .
All Index pages and charts have been updated to reflect the monthly changes – (ASX Index, UK Index, US Index).
Mining for coal must have been a tough gig back in 1909. Slack Investor has had it far sweeter in his mining for good companies that have been beaten up by the recent Trump escapades. Sadly, in these lower price times, he is fully invested. But, even after a beating, it doesn’t stop him thinking about possible future investments. Sometimes the best ideas come from other people.
Quality at a Discount
Livewire is a financial newsletter that offers free subscriptions and Slack Investor is a keen reader. Livewire depends on contributors from the financial industry and is always worth a look. An article by Tom Stelzer of Bell Potter caught his eye on April 8, 2025.
Tom seems like an astute fellow and his methods for sifting through stocks rang a bell with Slack Investor. Similar to Slack Investor he combines growth, profitability and P/E Ratio to come up with a stock list – in an organized way. Slack Investor might argue that the method is not quite as elegant as his Slack Factor analysis, However, Bell Potter do have a standard screen for ‘quality at a discount’ – and this seems far less effort.
(Tom) assesses their potential for growth, earnings momentum and looks for stocks with notable P/E compression over the last few weeks to produce a list of 20 quality mid and large-cap companies that are well-positioned and likely undervalued – Tom Stelzer, Bell Potter
Slack Investor notes that 9 of the 20 stocks presented are currently in the Slack Portfolio. The above tables were just the first sort. Tom then looked hard for those quality companies that were not overpriced. The Post 12MF PE column (12-month future P/E ratio) was used here.
Bell Potter came up with four companies that they consider good buys after the recent slump – they are listed in the table below. Slack Investor has also provided a further screen by calculating the Slack Factor for each of the companies.
The ingredients in the Slack Factor were obtained from Market Screener. Where ROE is the forecast ROE (ROE 2027), EPSG is the forecast EPSG for the next three years (EPSG AV) and, PE Ratio is the forecast PE Ratio (PE 2027). The Slack Factor is then calculated – a high Slack Factor is usually good news.
Of the 4 recommended Bell Potter stocks. The Slack Factor indicates that TLX and REA are the standout buys for Slack Investor – at the moment.
April 2025 – End of month update
Slack Investor is OUT of the US Index (S&P 500)! He sold his small US Index holding on Monday 07 April, 2025 at 5048. After the rebound, the latest monthly chart indicates this might have been a mistake – and reinforces his belief that Slack Investor has no great skill in timing the market. The 25-yr market timing experiment will continue till 2029. Slack Investor remains IN for Australian index shares, and the FTSE 100 as, at the end of the month, they were above their stop losses.
Slack Investor has never been a huge fan of the ‘American Way’ but did hold an admiration for their ingenuity and general work ethic. I have never seen such wilful destruction of American international standing in such a short time. As well, Trump’s capricious economic policies have the S&P 500 all over the place. The US Index recovered its losses and rose 10.3% since its 10.0% slump early April. Trump is 100 days in … 1461 to go.
For the ASX 200 (+3.6%) and the FTSE 100 (-1.0%), it has also been a wild month.
All Index pages and charts have been updated to reflect the monthly changes – (ASX Index, UK Index, US Index).
Slack Investor is enjoying the relative calm in the markets over these past couple of days. It is a good time to update the charts for the Cyclically Adjusted Price to Earnings ratios (CAPE). He first started using CAPE as a ‘value’ tool in September 2021 and, the most recent post on Market Value was for the end of December 2024. That feels like such a long time ago – pre-Donald 2.0. The markets have been on quite a ride since then.
Shiller P/E and S&P 500 10-year annualised forward returns from 1983. There is a clear relationship between higher CAPE and lower expected 10-yr returns for the S&P 500. Data valid as of 31 December 2023 – Investco
For the following charts, Slack Investor uses monthly CAPE data from Barclays, the 40-yr mean is calculated and plotted together with the latest CAPE values – estimated up until 14 April 2025. A ‘fair value’ zone is created in green where the CAPE is within one standard deviation of the mean (average) – click images for better resolution.
ASX 200 CAPE Value – 3% above long-term av.
ASX CAPE values – estimated up until April 14 2025
FTSE 100 CAPE Value – 10% below long-term av.
UK CAPE values – estimated up until April 14 2025
S&P 500 CAPE Value – 32% above long-term av.
US CAPE values – estimated up until April 14 2025
Market value and Market Timing Experiment
The ASX 200 and the FTSE 100 are both within 10% of their 40-yr CAPE average. When within the green ‘fair value’ range, Slack Investor has patience and he will be assessing these charts at the end of the month.
The US index chart was, and still is, above the ‘fair value’ range and Slack investor had the S&P 500 on a weekly check. Last week it plunged below the stop loss and Slack Investor sold. These are early days in the Trump 2.0 experience – given current form, there will be more surprises.
The US Index is just a small part of the Slack Portfolio (1.6%). The bulk of his portfolio is currently riding the market roller coaster – patiently in search of long-term returns.