The Slack Buying Process … and August 2021 – End of Month Update

The moneychanger and his wife, by Marinus van Reymerswaele, 1538, Public Domain, via Wikimedia Commons

As much as Slack Investor hates retail shopping – he loves to have the opportunity to buy into companies. Like any new relationship, when you buy a stock, you are not really sure about how its going to work out – but its exciting!

I have never been good at predicting when the stock market will have a correction … and the current high valuations (PE Ratios well above the long term average) do make me nervous. However, Slack Investor would much rather be in the game than out of it and I have been looking for a few companies that would hopefully not suffer too greatly if a correction occurred in the stock market.

This is not advice … just an insight to the Slack Investor bumbling buying process. My rate of converting bought shares into winners of 55% is not that impressive – but my overall performance results are good.

I get heaps of buying ideas from investment sites such as Motley Fool, Livewire, ShareCafe. But I will always, always, check things out for myself before parting with any Slack Dollars. This involves a rigorous screening of the fundamental financial metrics PLUS a look at how the stock chart is going on Incredible Charts. This technical analysis consists of a quick scan to see if the chart is in a continual growth trend … or has just had a “breakout”, or broken out of a downtrend.

Let’s put on the buying boots. As well as the companies below, Slack Investor has also recently added to some small positions in PPK.ASX and TNE.ASX.

Slack Investor Buys Alphabet (GOOGL.NASDAQ)

Half of my buying cash went into an existing holding – Alphabet (GOOGL), This money making juggernaut is part of the new economy and I could buy this company all day. The first step is to go to the phenomenal MarketScreener.com. Registration is free on this site and they allow you to look at analyst data for up to 5 stocks a day.

Search for your stock and then finding the Financials Tab for that company. Firstly, I look at the chart Income/Sales and Earnings per Share. An increasing trend is good and, if the estimated earnings (2021 – 2023) are also increasing, I’m acutely interested. I do a quick check on debt levels. Alphabet is a cash king – has more cash than debt – solid tick.
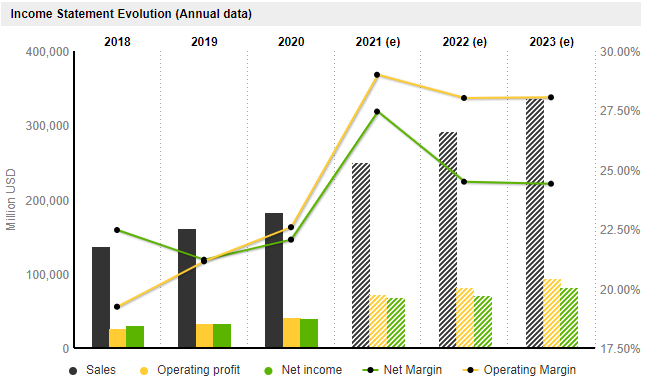
Income statement for Alphabet (GOOGL on the US NASDAQ exchange) – from MarketScreener

I continue with MarketScreener to extract the Return on Equity (ROE), both past and forecast. I hope that it is above 15% – Big Tick. The final bit of vital information is the Price Earnings (PE) Ratio and it is here that I gauge whether the stock price is too high for Slack Investor. For a good growth stock, I try not to buy into companies that have a projected PE of more than 40-(50 at a pinch). The analyst estimates for GOOGL is a forecast PE of 23.0 in 2023 – Tick

YEAR2018201920202021(e)2022(e)2023(e)
ROE18.619.319.027.225.825.2
PE Ratio23.927.229.928.026.623.0
Table of fundamental financial metrics for Alphabet. The documented Return on Equity (ROE) and Price Earnings (PE) Ratio are shown for 2018-2020. Analyst estimates are shown for later years – MarketScreener.com

Slack Investor Buys NASDAQ 100 ETF (NDQ.ASX)

Not everyone has access to direct access to US shares – if you only have an ASX broker, then to get exposure to Alphabet, a good substitute is to buy the BetaShares NASDAQ ETF (NDQ) – Alphabet represents 8.1% of this ETF – and you get profit machines like Apple, Amazon, Microsoft and Facebook thrown in. I topped up my holding here as well.

The ROE for the NASDAQ Index is 17.7 and increasing (30 June 21) – Above 15, Tick. The projected 2023 estimate for the Price/Earnings Ratio for the NASDAQ Index is 22.47 – Below 40, Tick – Very reasonable for growth sector companies.
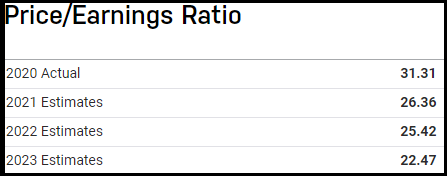
NASDAQ 100 Index 2020 PE Ratios and Forward Estimates of PE for 2021, 2022. 2023 – From nasdaq.com

Slack Investor Buys Coles Group (COL.ASX)

YEAR201920202021(e)2022(e)2023(e)2024(e)
ROE29.832.837.034.933.334.3
PE Ratio12.422.922.423.422.821.4
Table of Fundamental metrics for Coles Group . The documented Return on Equity (ROE) and Price Earnings (PE) Ratio are shown for 2019-2020. Analyst estimates are shown for later years MarketScreener.com

The Return on Equity (ROE) for this retail business is pretty impressive and, the PE Ratio would be pretty good for a growth company – but the Income Chart below reveals that Coles is not really a “growth” company – so the expectation is that the PE Ratios should be much lower, in the early 20’s or below would be the Slack Limits for slow growth companies.
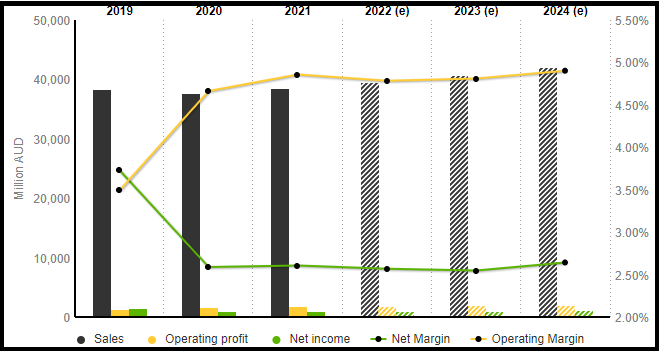
Income statement for Coles Group (COL.ASX) showing a very gradual increase in projected income – Compare this with the Alphabet chart above – from MarketScreener

The income chart shows some pretty shallow growth and the slow earnings per share (EPS) growth makes the Coles Group something that Slack Investor would not usually be interested in. But, I go to Coles Supermarket at least twice a week and I actually like going there as a company part owner. Coles is in the “stable income” section of the Slack Portfolio rather than “Growth”. Even if the worst of times was thrust upon us and there was a recession in the next few years, a business like Coles will keep on performing. I would much rather put up with the price fluctuation of shares and have my money in a business like this at a projected yield of 3.5 – 4% p.a. than have Slack Dollars tied up in cash for 2 years in a Big 4 bank term deposit at 0.3%.

August 2021 – End of Month Update

Slack Investor remains IN for Australian index shares, the US Index S&P 500 and the FTSE 100.

There were significant rises in all followed markets (S&P 500 +2.9%, and the FTSE 100 +1.2%). The Australian stock market is also in record territory (ASX 200 +1. 9%). This is all happening during extensive COVID-19 related lockdowns in the populous South Eastern part of Australia.

Slack Investor is normally relaxed about most things, but I am moving to the edge of my couch and starting to get ready for action. Looking at the monthly charts for all the indexes, in these boom times, the index prices have been getting too far ahead of my stop losses for comfort. I have tightened up my rules for adjusting stop losses upwards.

All Stop Losses are live and are being moved upwards every month if the index price exceeds the stop loss by 10% or more. All Indexes have got this treatment this month – It is sometimes difficult to work out where to put the stop losses on the monthly chart. I usually go to the weekly charts and find a minimum on the weekly price range that is within 10% of the current price (see below). If the stock price is below the stop loss at the end of the week – I will usually sell at the next opportunity.
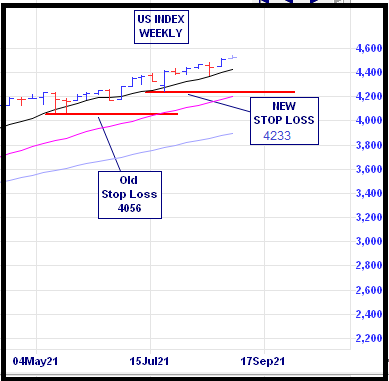
The weekly US S&P 500 Index chart showing an upward adjustment of the stop loss from 4056 to 4233 – Thanks Incredible Charts

All Index pages and charts have been updated to reflect the monthly changes – (ASX IndexUK IndexUS Index).

Financial Year 2021 Slack Results

“In the business world, the rear view mirror is always clearer than the windshield.”

Warren Buffett 

Slack Investor has a proven track record in not being able to predict where speculative assets (such as Bitcoin or precious metals) are going. I would also add to the “speculative list” some companies whose share price have become divorced from the link to their actual earnings. As a rough guide, I try not to invest in companies that have a forward P/E ratio of greater than 50. I get these forward P/E ratios from the excellent Market Screener site.

This means that I have missed out on the great gains of being by in companies like Afterpay (APT – 2023 P/E ratio 190) or TESLA (TSLA – 2023 P/E ratio 193). Some folk have made a lot of money with these companies …. but they are just too speculative for me. Slack Investor tries to “stick to his knitting” with growing companies that have an established earnings record and forward P/E ratios <50.

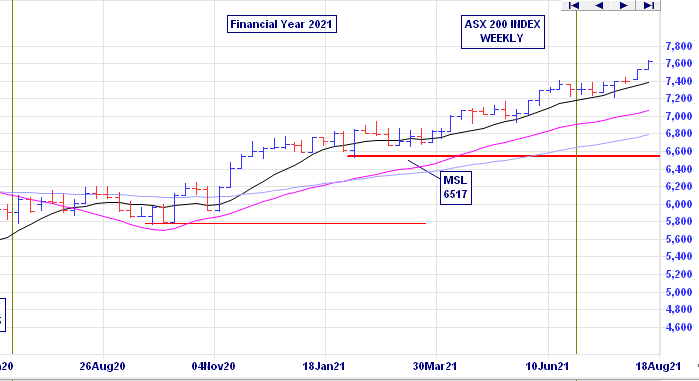
After an eventful FY 2020 and the COVID-19 dip in the markets around the world. FY 2021, has seen very good gains for most global markets. In the UK, the FTSE 100 Total Return Index is up 18.1% (last FY 20 down 13.8%). Dividends helped the Australian Accumulation Index to be up 27.8% for the financial year (last FY down 7.7%). These Americans remain stupendously optimistic … the S&P 500 Total Return Index was UP 36.4% (last FY up 12.0%) for the same period. All of these Total Return Indexes include any accumulated dividends, wheras the chart below of the ASX 200 for FY 2021, just shows stock prices.

ASX 2oo Weekly chart for FY 2021 – started at 5897 and finished at 7313 (30 June 2020 – 30 June 2021) – Incredible Charts – Click for better resolution.

Slack Portfolio Results FY 2021

All Performance results are before tax. The Slack Portfolio had a cracking year with annual FY 2020 performance of +21.7%. Full yearly results with benchmarks are shown in the table below. It was also a top year for all benchmarks (Median Balance Fund +13.0%, Vanguard Growth Fund +20.3%, ASX 200 Accumulation +27.8%).

Against all Slack Investor predictions … Real Estate turned out to be a great investment in the Brisbane and Melbourne markets for FY 2021 (+17.9% and +10.7%) – Perhaps I should also give up on the “looking ahead” in the residential property market – I just don’t get it!

YEAR SLACK FUND MEDIAN BAL VGARD GROWTH ASX200Acc RES BRIS RES MELB CASH CPI
2010 6.6 9.8 12.3 13.1 10.8 26.9 4.2 3.1
2011 2.5 8.7 9.1 11.7 -2.4 0.9 4.4 3.7
2012 8.3 0.4 1.3 -6.7 1.3 -0.9 4.3 1.2
2013 26.5 14.7 18.6 22.8 7.7 8.3 3.2 2.4
2014 23.6 12.7 14.5 17.4 11.5 12.8 2.6 3.0
2015 2.4 9.6 11.8 5.7 7.7 15.6 2.5 1.5
2016 14.2 3.1 4.2 0.6 8.4 9.5 2.2 1.3
2017 19.5 8.1 8.8 14.1 6.5 17.7 1.9 1.9
2018 37.6 7.2 10.0 13.0 5.2 3.9 3.9 2.1
2019 19.7 6.2 9.8 11.5 1.7 -6.0 2.0 1.3
2020 9.4 0.3 0.6 -7.7 8.4 13.8 1.1 -0.3
2021 21.7 13.0 20.3 27.8 17.9 10.7 0.2 3.8

The Slack Fund yearly progress vs BENCHMARKS. The Median Balanced Fund (41-60% Growth Assets)Vanguard Growth FundASX 200 Accumulation IndexCorelogic Residential Property total return in both Brisbane and Melbourne, and Cash (Australian Super Cash Fund) and Consumer Price Index (CPI)

The five-year compound annual performance gives me a much better idea about how things are going and will smooth out any dud (or remarkable!) results.

Slack Investor 5-year compound annual rate of return – compared to benchmarks – Click for better resolution.

The beauty of compounding with a succession of good performance results can be seen in the chart below showing the growth of an initial investment in June 2009 of $10000.

The rate of growth of $10000 invested by Slack Investor in FY 2009 – compared to benchmarks – Click for better resolution.

The lessons of long term investing

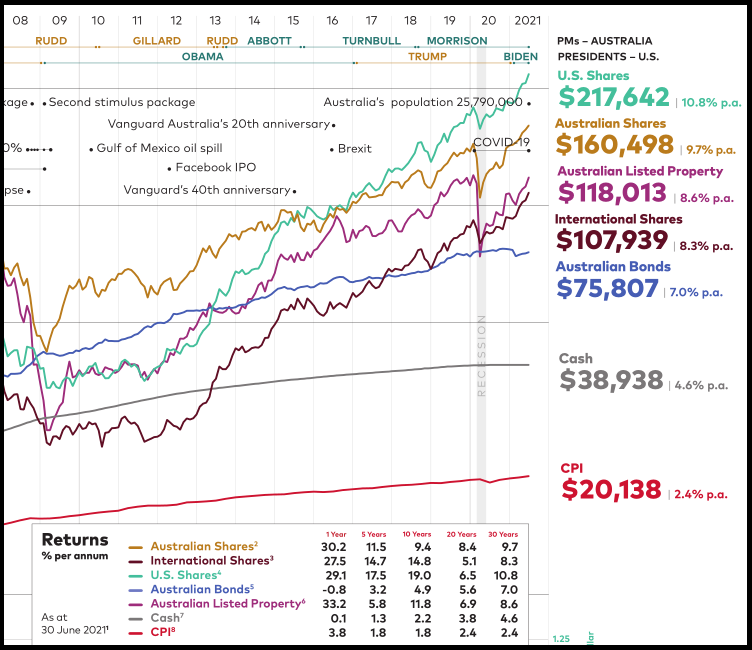
Every year Vanguard publish their performance data on each asset class. Slack Investor looks forward to this – as it reminds him of the power of the appreciating asset classes of Shares and Property. Vanguard highlights the volatility of asset values in the short term – but also emphasizes the joys of holding and accumulating shares or property for long periods of time. These asset classes have steadily increased in value over the last 30 years. $10000 invested in Australian Shares in 1990 would have compounded to $160 498. Staying in Cash would have yielded $38 938.

2021 Vanguard Index Chart

Extract from the 2021 Vanguard Index chart (Just the 2008-2021 portion) – the dollar values on the right are the results of investing $10000 in index funds in each asset class for 30 years (since July 1991). – Check out the full glory of the Vanguard 2021 PDF chart – Click for better resolution.

Financial year total returns (%) for the major asset classes

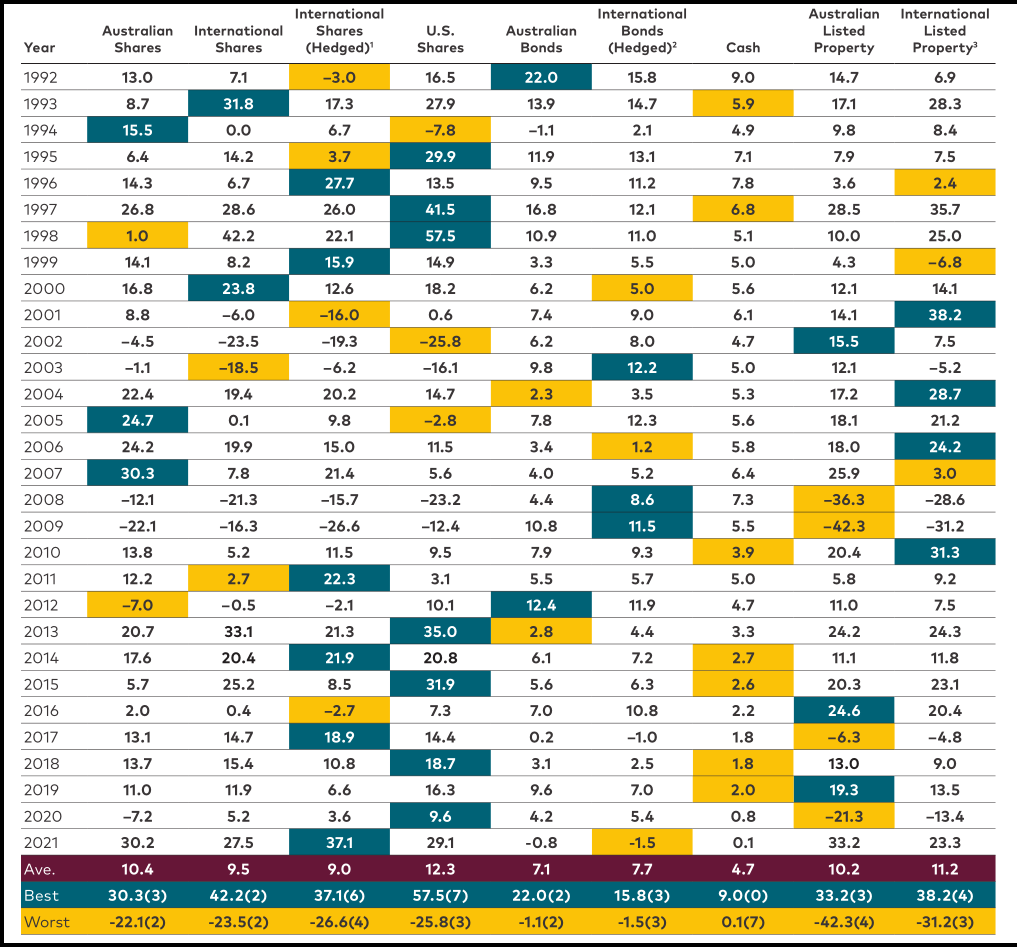
In the chart below, for each asset class the total annual returns are given and the best performing class for each year is marked in green … and the worst in gold. What stands out to Slack Investor is that is rare for and asset class to lead in annual returns (green) for two years in a row – and there are years where the leading asset class (green) becomes the worst performer (gold) in the next year. This drives home the often repeated sentence in the finance world.

Past performance is not a guarantee of future results.

Total returns for each asset class for the 30 years since 1991 – Check out the full glory of the Vanguard 2021 PDF – Click for better resolution.

This table highlights the benefits of diversification across asset classes for the long term investor.

Sitting on the couch, Slack Investor is quietly pleased with his 2021 results – Roll on Financial year 2022. However, when comparing this year’s bumper returns with the long term average returns for Australian and International shares of around 10% – Slack Investor can’t help but be a little nervous.

.

FY2021 Nuggets and Stinkers and July 2021 – End of Month Update

It’s not whether you’re right or wrong that’s important, but how much money you make when you’re right and how much you lose when you’re wrong. 

George Soros

Now George knows how to make a dollar and, to his great credit, is a generous philanthropist. I am sure, like any successful investor, that George looks back at times on his investment decisions. Slack Investor looks forward to this time of year when I can reflectively analyse my greatest investing failures. Fortunately, my stinker to nugget ratio was good this year.

The percentage yearly returns quoted in this post include costs (brokerage) but, the returns are before tax. This raw figure can then be compared with other investment returns. I use Market Screener to analyse the financial data from each company and extract the predicted 2023 Return on Equity and 2023 Price/Earnings Ratio on the companies below. This excellent site allows free access (up to a daily limit) to their analysts data once you register with an email address.

Slack Investor Stinkers – FY 2021

Growth stocks (High Return on Equity >15% and increasing sales) are fantastic companies to associate with as they are growing and hopefully, their earnings per share, are growing also. The downside to this is that these companies are usually sought after in the stock market and command high prices in relation to their current earnings because the “future earnings” of the company are priced into the current price. This gives them a high PE Ratio. Whenever there is a future earnings revision, or a stutter in growth, there is usually a dramatic drop in price.

Slack Investor has a look at his stocks every weekend on a free chart program (Thanks Incredible Charts!). I actually pay a small amount to get the chart data early in the morning. Both of my “stinkers” this year were actually “nuggets” from last year. For FY 2020, Appen +58% and A2M +26%. Such is the cyclic nature of some growth stocks.

Appen (APX) -24%

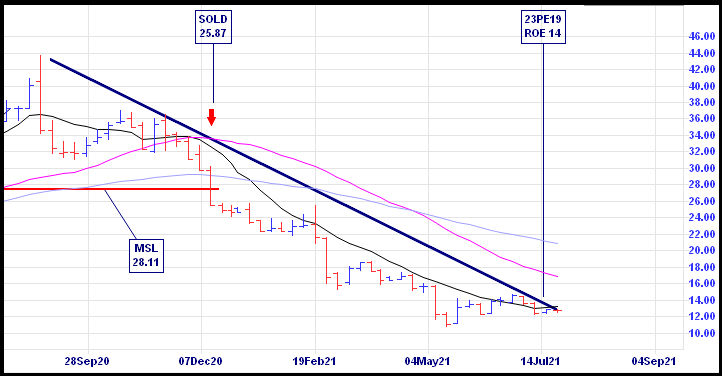
APX (2023 ROE 14%, 2023 PE 19) remains a company that puzzles me “the development of human-annotated datasets for machine learning and artificial intelligence”. The company has had a few problems due to COVID-19 and a hit to its underlying profit and increased competition. Slack Investor got out late last year at $25.87 as the weekly chart moved below the stop loss at $28.11. However, this represented a loss of 24% for the financial year.

The downward trend marked by the thick blue line is setting up niciely for one of Slack Investors favourite chart trading patterns – “The Wedgie”. When the share price punches through a downward trend line of at least 6 months … and the fundamentals are right, Slack Investor is interested. Given the forward PE for 2023 is a relatively low 19 – I might have another crack at this once the price has poked above the blue wedge line.

A2 Milk (A2M) -21%

A2M (2023 ROE 17%, 2023 PE 23) sells A2 protein milk products to the world. The actual benefits of the A2 only protein seem to be limited to easier digestion. Long term independent studies with large data sets are still in the works … but the marketing skill of this company is undisputed. COVID-19 brought big changes to sales with the collapse of the “daigou” market and worries about China trade sanctions. Slack Investor sold about half way through the downtrend – but not before taking a hit for the team.

Slack Investor Nuggets – FY 2021

A great benefit of investing in companies that have a high Return on Equity, and with a track record of increasing earnings, is that they sometimes behave as “golden nuggets”.

Codan (CDA) +161%

Codan - Niramar

What a company! Codan is a technology company that specializes in communications and metal detecting. It has made a major US acquisition this year and paid with cash. Sales are up and predicted to keep increasing. The high 2023 ROE 32%, and relatively low 2023 PE 24 (for a growth company) makes me think there will be more price growth over the next few years – I will try and top up my position this year on any price weakness.

Alphabet (GOOGL) +61%

(GOOGL – 2023 ROE 23%, 2023 PE 23) The Alphabet list of products continues to grow. I use a ton of Alphabet products every day and the company is growing fast into the cloud with cloud computing revenue jumping 46% in the March quarter. There are a few regulatory problems coming up with the US Justice department claiming that Google’s actions harmed consumers and competition. There is also the ongoing work of G7 nations trying to make international tech companies pay their rightful share of tax on revenues in each country.

Despite this, if there is one company that Slack Investor could invest in and then pay no attention to for 10 years, and still sleep well, … it would be Alphabet.

REA Group (REA) +59%

File:REA Group logo.svg - Wikipedia

The owners of RealEstate.com.au. which is the go to portal for house selling and buying (REA – 2023 ROE 38%, 2023 PE 44). The group has just completed an acquisition of Mortgage Choice and picked up a big chunk of a Mortgage software company. This expanding of the business must be good. 65% of Australia’s adult population are checking the site every month looking at property listings and home prices. However, the 2023 projected PE is very high (44). Using the Slack Investor bench marks, suggests the stock is expensive at the moment.

Integral Diagnostics (IDX) +37%

Integral Diagnostics | Medical Imaging Services | Australia | New Zealand

This medical image company (2023 ROE 16%, 2023 PE 24) provides diagnostic image services to GP’s and specialists. IDX seems to be getting a few tail winds with an ageing population and more demand for their MRI, CT and PET scans.

Macquarie Group (MQG) +36%

Commonwealth Bank Macquarie Group Finance Westpac, PNG, 1800x600px,  Commonwealth Bank, Australian Dollar, Bank, Brand, Finance Download

Macquarie is a complex business(2023 ROE 14%, 2023 PE 17) with a range of banking and financial services, and plays in global markets and asset management. The latter division looks for undervalued companies. Despite COVID-19, profits are increasing. The management seem to know what they are doing – Slack Investor remains a fan.

Betashares Global Robotics And Artificial Intelligence ETF (RBTZ) +36%

RBTZ ASX | Global Robotics & AI ETF | BetaShares

This ETF tracks the megatrend of robotics and artificial intelligence. Although the PE ratio is a bit high (2021 PE Ratio 37), this is a disruptive sector that should make gains against existing industries with the advantage of technology against rising labour costs.

Most honourable mentions to those other companies that returned over 20% for the tax year. Cochlear (COH) +34%, BetaShares Nasdaq ETF (NDQ) +33%, VanEyk MOAT ETF (MOAT) +32%, Vanguard International ETF (VGE) +29%, BetaShares HACK ETF (HACK) +31%, Vanguard Asia ETF (VAE) +28%, BetaShares QLTY ETF (QLTY) +25%. To these companies, I am grateful for your service.

Slack Investor Total SMSF performance – FY 2021 and July 2021 end of Month Update

A great year for shares, Chant West reports Super funds have delivered their strongest financial year result in 24 years, with the median growth fund (61 to 80% in growth assets) returning 18% for FY21. The FY 2021 Slack Investor preliminary total SMSF performance looks like coming in at around 22%. The 5-yr performance is a more useful benchmark to me – as it takes out the bouncing around of yearly returns. At the end of FY 2021, the Slack Portfolio has a compounding annual 5-yr return of over 21%.

Slack Investor remains IN for Australian index shares The FTSE 100 had a flat month (-0.1%) but rises in the US Index S&P 500 (+2.3%) and the ASX 200 (+1.1%).

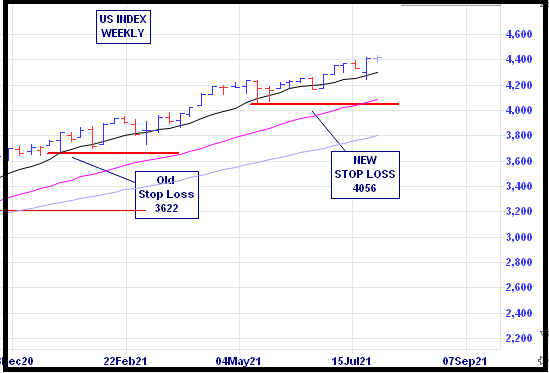
The party with the US S&P 500 just keeps on going. As the S&P 500 has moved more than 20% higher than its stop loss on the monthly chart, I have adjusted the stop loss upward to 4056 from 3622. It is difficult to decide where to put the stop loss on the monthly US Index chart. In these cases, I go to the weekly chart and look for a “sensible place” to put the stop loss coinciding with a minimum value (dip) on the chart. The current stop loss is 8% below the end of month price.

US Index (S&P 500) weekly chart showing a moving up of the stop loss this month.

The US economy entered a recession in February 2020 and has now entered a phase of expansion (since June 2020). Slack Investor is nervous though and has his stop losses live for all Index funds. I will be checking these charts on a weekly basis for breaches of the stop loss.

All Index pages and charts  have been updated to reflect the monthly changes – (ASX IndexUK IndexUS Index).

Euphoria … and April 2021 – End of Month Update

People, Football, Footballers, Group, Team Sport

“Bull markets are born on pessimism, grow on skepticism, mature on optimism and die on euphoria.”

Sir John Templeton

John Templeton (1912 – 2008) was a great investor, fund manager and philanthropist. He is best known for setting up the Templeton Growth Fund which averaged returns of over 15% per year for 38 years. Slack Investor salutes this kind of behaviour and listens when great investors say something. If Mr Templeton is right, this game should be pretty easy and we wait till the “Euphoria” sets in and the we sell … Right?

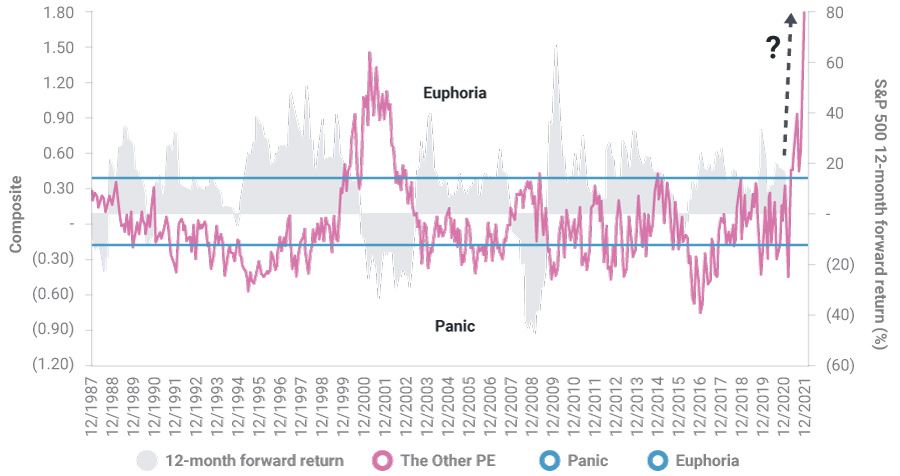
Well, according to the CitiGroup Panic and Euphoria Index , which looks at sentiment in the market back to 1950. The section from 1987 through to the start of 2021 is shown below – Euphoria is already well and truly established by December 2020. However, most markets have gone up considerably further since then!

Source: Haver Analytics, Pinnacle Data, and Citi Research – diamondportfolio.com.au – Click image for better resolution

This is a bit of a complex chart, and the grey solid columns represent the return from the US Stock market for the next 12 months (forward return) and the Magenta line is the Citibank Euphoria Index which tracks market sentiment.

Visually, it looks like whenever the Euphoria Index (LHS – Magenta) goes to a high value, there is a downturn in the next 12-month return (RHS – Grey). Citibank have defined a range (Blue Lines) where the market is operating “normally” and outline areas of Euphoria and Panic when the market is beyond that range. According to Citibank, we are in a period of Euphoria and the prospect of good returns in the next 12 months looks bleak. The Chief Economist from Citigroup, Tobias Lekovich, suggests that there is a “100% historical probability of down markets in the next 12 months at current levels.” – that proclamation was made 5 months ago.

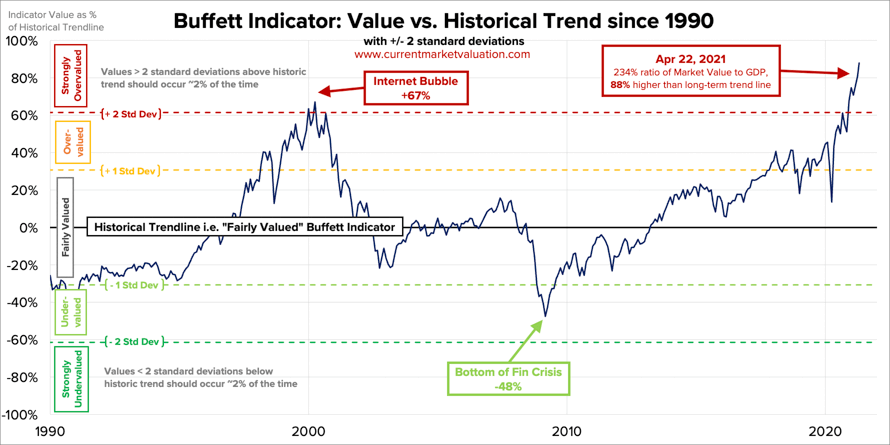
Another Slack Investor hero, Warren Buffet, talks about the ratio of total United States stock market valuation to US Gross Domestic Product (GDP). This is now known as the “Buffet Indicator” – and, although he admits to its limitations, it still is “the best single measure of where valuations stand at any given moment. At April 22, 2021 the Buffett Indicator is calculated to be 234% – the highest value since 1950. In contrast, the Australian market using this indicator is either “fair valued” or “modestly overvalued”

From Current Market Valuation – The Buffett Indicator is the ratio of total US stock market valuation to GDP – Click image for better resolution

By our calculation (the US Stock Market) that is currently 88% (or about 2.9 standard deviations) above the historical average, suggesting that the market is Strongly Overvalued

Current Market Valuation

There are a lot of current examples of “investor exuberance” in the stock markets – particularly in the US. There is no doubt that the pricing of some companies has got well out of hand. The earnings of a company are critical when I look at my investments.

Another risk is that pockets of the market at the moment appear to be speculative bubbles. You can easily tally about US$5 trillion of assets, from cryptocurrencies to Tesla, that are not underpinned by any fundamental earnings. They’re speculation. And if these bubbles were to pop, that could drag down a wider range of investments.

Hamish Douglas, Magellan Financial Group – Livewire Interview

There are a group of companies that I like that I have no intention of selling – because they have a good track record of increasing earnings and there future prospects look good – no matter what the market does in the short term. There is also about 40% my portfolio in stocks where I am not so sure of their long term prospects. It is these stocks that I will be watching closely at the end of every week and have set stop losses that will indicate to me that I should sell if the price falls below the stop loss.

Slack Investor is happy to go along for the ride and has no real faith in his prediction ability. Sure, stocks are at extreme valuations but these are very unusual times. Interest rates are very low and there has been an unprecedented amount of government spending to keep economies going along.

Still on the couch, I don’t feel euphoria … but I feel OK … I have a plan.

April 2021 – End of Month Update

Despite the “exuberance”, Slack Investor is still on the wave and remains IN for Australian index shares, the US Index S&P 500 and the FTSE 100. All Slack Investor followed markets this month had strong rises (ASX 200 +3.5%; FTSE 100 +3.8%; S&P 500 +5.3%).

In these uncertain times, especially with the high prices on the US market, I am monitoring my index funds weekly and if, at the end of the week my Index funds are below the stop loss, then I will put a post on the blog and sell at the next opportunity. All Stop Losses are Live.

All Index pages and charts  have been updated to reflect the monthly changes – (ASX IndexUK IndexUS Index).
R&B? … No, R&D!

James Brown Performing At The Apollo by New York Daily News Archive
Mr James Brown (1933 – 2006) – an R&B, funk, and soul music legend – “The hardest thing about being James Brown is I have to live. I don’t have no down time” – Image from Rolling Stone

Slack Investor might be showing his age here … but when I think of R&B (Rhythm & Blues), it’s not Drake or The Weeknd that I think of, its “The Hardest Working Man in Show Business” that comes to mind. James Brown had a bit of a trouble in his life but there is no denying his talent and influence – 4 minutes of his genius can be seen here.

The one thing that can solve most of our problems is dancing

James Brown

But I digress, when the dancing is finished, R&D (Research and Development) is another thing that gets Slack Investor attention – especially when it comes to finding a company to invest in. Lets have a look at the world top ten spenders on Research and Development. This quality list of companies is peppered with representation from the tech, pharmaceutical and (electric) car sectors. One of the ways that a company can keep growing is to develop an upstream pipeline of products through research, patenting, and testing. It may take many years before they are released so the companies must be patient and long sighted – not all products in the pipeline will be a success.

Ranking of the 20 companies with the highest spending on R & D in 2018 (in billion U.S. dollars) – From Statista.com

I don’t often read company annual reports as I lack forensic accounting skills and they are usually thick and masterpieces of obfuscation. But, I am usually very impressed when, in the overview, a decent slab of profits are going back into R&D. Slack Investor would rather invest in companies that are constantly innovating, and investing in future products. Only some of these products will yield fruit, but you would hope that these high spending R&D companies would generate bigger profits than those that don’t. Although, this is not always the case! In some cases, the world of R&D can be full of questionable spending, uncertain results.

Even though R&D spending does not guarantee profitability and ever increasing stock prices, there is a correlation- future earnings are positively associated with current R&D.

Commonwealth Serum Laboratories (CSL)

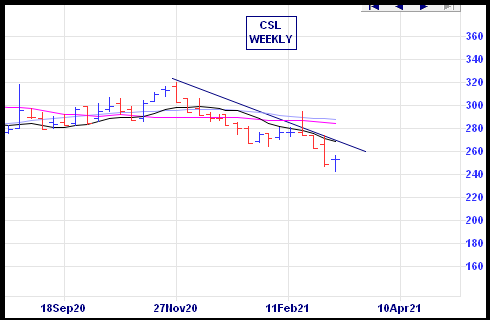
Despite a 20% price fall in the CSL share price in the past 6 months, there is no thought of Slack investor selling this great company. It is one of my “Long Run” stocks. I have often written about share prices fluctuating above and below a “fair value” for a stock . This is just a characteristic of share investing – depending on the mood of the market.

A weekly chart of the CSL share price showing a 20% fall in the last 6 mth -From incrediblecharts.com

CSL is not in the world R&D big spending league in dollar terms. But, in Australia, it is one of our best R&D spenders with almost a billion dollars (US) per year. This amount is very high as a percentage of its revenue, in an environment where a typical manufacturer will spend 1-2%, CSL spending on Research and Development is between 10 to 11 per cent of turnover. Slack Investor thinks this is a good thing and is happy that CSL is occupying a big chunk of his portfolio.

CSL have many products in the R&D pipeline and have a good track record of converting at least some of these products into successful earners. Some other analysts agree and have a target price of $310 on the stock. With current pricing at $253.26 (12 Mar 21) – this smells good!

I taught them everything they know, but not everything I know

James Brown

That’s right James … “Hit it”

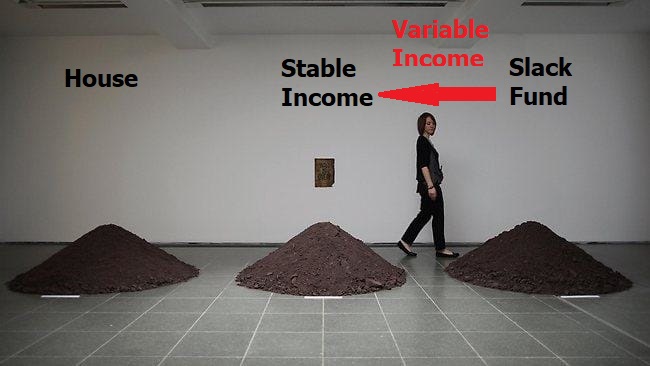
Three Pile Theory

– Adapted from  ‘Three Mounds’ by Yoko Ono is displayed at the Serpentine Gallery on June 18, 2012 in London, England – From Getty Images.

With apologies to Yoko for interfering with her art, but Slack Investor first thought of his own “Three Pile Theory” back in 1989 when I had got myself a “Proper Job” and enough stability in my life to make the big plunge into Real Estate. At that time, I owned a few grains of dirt in my House pile (the Bank owned the rest), My income was OK, and my investments (which would later morph into the Slack Fund) contained a few thousand dollars in shares.

Now, 32 years later, Slack Investor still has these three financial pillars to keep himself steady.

  • House – Home ownership gives me great security and pleasure. The bank owned most of this 30 years ago – but now I have the upper hand! (~30% of Net Worth)
  • Stable Income – This used to be my job, but in retirement I have some stable income annuity style investment (~20% of Net Worth) that would pay my bills and maintain a basic Slack Lifestyle should Armageddon befall the stock markets for a few years. This income is supplemented by income from the Slack Portfolio.
  • Slack Portfolio Investments – (~50% of Net Worth) – Now currently in my Self Managed Super fund (SMSF) which is almost exclusively invested in growth companies. These are great businesses to be invested in if you have a long term horizon – however, stock prices can be volatile in these high Return on Equity (ROE) companies. I am currently retired and do not rely on the Slack Portfolio for stable income. Because of the stability of my other two pillars, I can be quite aggressive in the allocation of my investments in the Slack Portfolio – as I know I will not have to panic sell (for income) during any downturn.

Slack Investor didn’t really invent “Pile theory” – it has been around for a while in various guises – Three Buckets is a tried and true way to manage your retirement expenses by dividing your retirement stash into buckets of cash, conservative investments and more risky, growth investments.

House

My home may not feel like a palace to you, but to me, it is a whole Kingdom.

Prerona Chatterjee

There are some who argue that you are financially better off by renting over a 10-year period rather than buying. But for Slack Investor, the tax advantages – no capital gains tax on your own home in Australia; the leverage – banks are usually willing to lend at least 80% of the house value; the forced saving – your mortgage payment is a big monthly portion of your income which you set aside for a long period; and, the stability provided by home ownership make this a clear winner for me. “The Serenity” is just a bonus.

Stable Income

To cover living expenses and to give yourself “peace of mind” it is so important to have a slab of money that is not subject to the vagaries of the sharemarket. In Australia, if you haven’t enough super to go independently, you might qualify for a full or part pension.

If going the fully self-funded route, many advisors recommend your stable income should be in two parts. You should work out your living expenses for a year and then keep between 2 and 5 years worth of expenses in stable cash deposits – Let’s start with 3 years of expenses in accessible cash. The rest of you stable income pile can be in longer term cash deposits, bonds or REITS. Because the investments pile (Slack Portfolio) is in growth shares that can be very volatile, my stable income must be something that is not highly correlated to to the sharemarket.

Term Deposits– although interest rates are woefully low now on bank term deposits, it is still possible to get ~1% p.a. from some of the minor banks that still have the Government Guarantee for the first $250 000.

Vanguard Australian Fixed Interest Index ETF (VAF)

MER (0.20%) – Annual performance over 1/5 years – (3.81%/4.41%)

Vanguard Australian Government Bond Index ETF (VGB)

MER (0.20%) – Annual performance over 1/5 years – (4.08%/4.49%)

Challenger Fixed Term Annuity – Rates are pretty low at the moment, locking away a deposit for 5 years will earn a measly 1.65%.

Real Estate or Real Estate Investment Trusts (REIT) – these are a bit higher up the risk curve but as they produce income (rent) and can be associated with longer term leases – are usually less volatile than the share market. For example, Vanguard Australian Property Securities Index ETF (VAP) – MER (0.23%) – Annual performance over 1/5 years – (-13.3%/6.23%)

Investments – The Slack Fund

Because the Slack Portfolio is mostly in growth shares, I have steeled myself that this particular pile is volatile and changes value every day. I am prepared for a few low performing (or even negative) years in a row for this pile. Even great investors that have much more knowledge than Slack Investor have the occasional bad year – during some periods, share investments just perform poorly. I am accepting of this truth.

Because this Investment pile is mostly in my Self Managed Super Fund (SMSF), I am usually obliged to withdraw 4% of its total value each year – this percentage increases with age – but this payment is currently tax free for those over 60. I can use this income in a discretionary way. My living expenses should be covered by income from the Stable Income pile – and any other income is gravy.

Pile Rebalancing

Once you are in a house that you are happy in and hopefully will be near paying off any outstanding loans as you get into retirement – other than maintenance, you can leave this pile alone.

The Stable Income cash pile might occasionally need a bit of topping up from the longer term stable Income or Investments fund. Any dividend or interest income from your investments is fair game. The investment Slack Fund usually produces 2 -3% income.

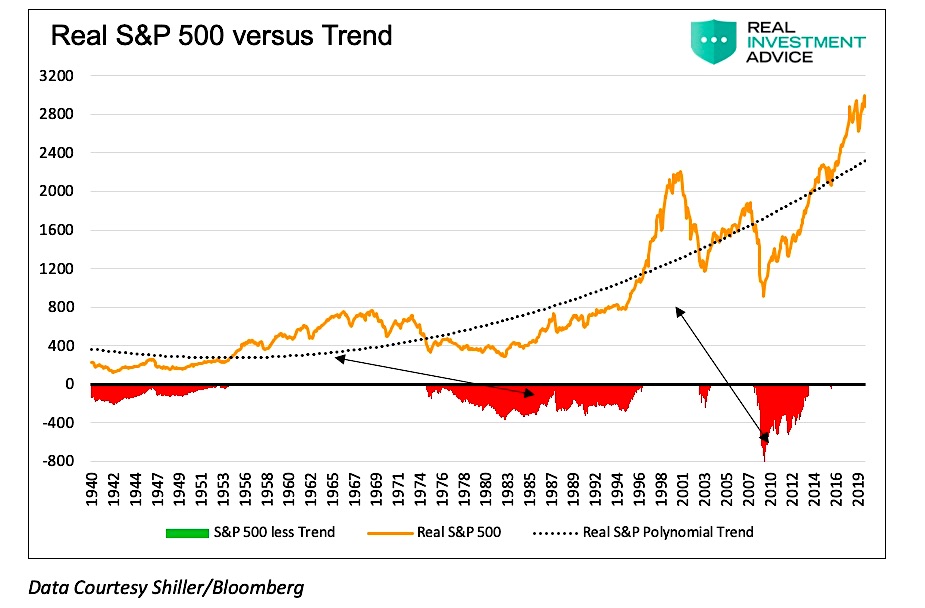
Hopefully, with 3-years worth of living expenses in the stable income pile, you can ride out a few bad years in the share market and only sell shares to top up the stable income pile when the share market has had a good run. Ideally, you would only sell share assets out of this pile when the share market is above the long term trend line. However, realistically, from the chart below (in red) there are long periods when the market is below trend. Have no fear, your basic expenses are always covered by a mixture of stable income, interest and dividends.

The long term chart of the US S&P 500 with the dotted inflation-adjusted long term trend line – from seeitmarket.com

There are other piles worthy of attention such as Health and Relationships but the finance stuff is necessary too. So get the shovel out … and start working on those piles!

2021 Lets talk about the planet – ESG Sustainable investing

Oooh … this planet is hot!

The difference in mean (average) temperature for the year 2020 and the 30-year average temperature between 1981 and2010 – Sourced from the World Meteorological Organization (WMO)

This is just last year … and the red colours show where planet Earth has been hotter than the long term average temperature. Clearly, for most of the world, 2020 was between 1°C and 5°C warmer than would be expected from the long term average. The reason this is happening is almost certainly due to increases in greenhouse gases since the industrial revolution.

… there’s a more than 95 percent probability that human activities over the past 50 years have warmed our planet.

From climate.nasa.gov based upon the Fifth Assessment Report Intergovernmental Panel on Climate Change (IPCC)

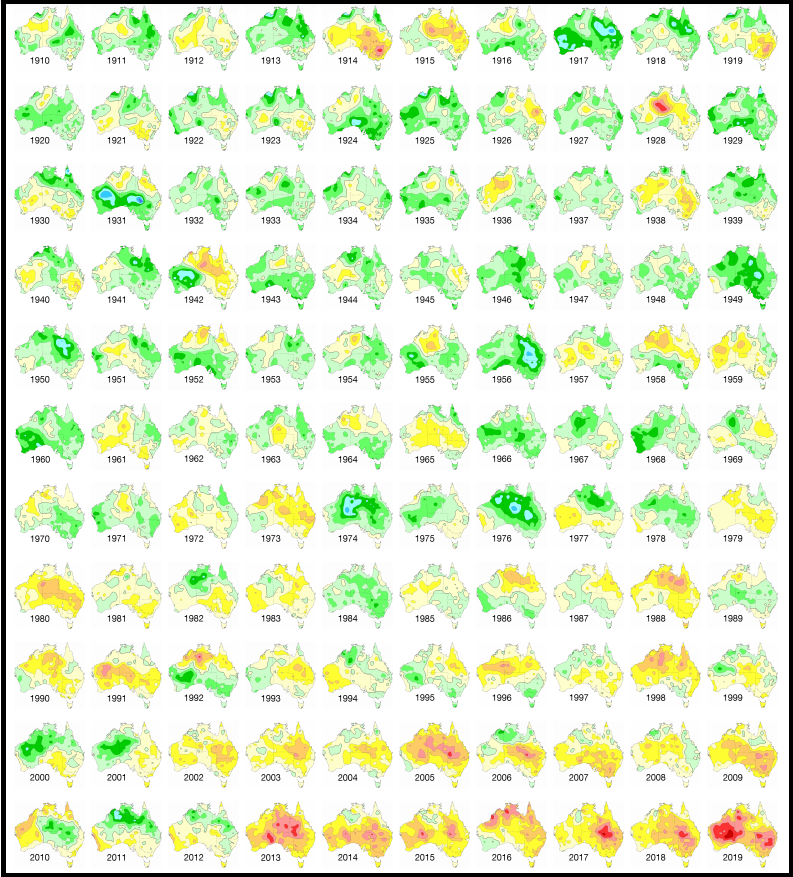
Another way to visualize the warming is to have a look at the past 110 years in Australia. The last decade was the hottest on record with temperatures almost 1 °C above average and one third of a degree warmer than the previous decade.

110 years of Australian Temperatures with warmer tempearatures represented by the yellow, orange and reds. These maps show the anomaly of mean temperature for each calendar year, compared to the average over the standard reference period of 1961–1990. From the Bureau of Meteorology. The full beauty of this chart can be found in the pdf form of the image.

This is not a political view – but is just science. The world is getting warmer and more and more people and governments think we should do something about it.

The world’s leading climate scientists have warned there is only 10 years for us to act if global warming to be kept to a maximum of 1.5°C. If temperatures go beyond this by even even half a degree, this will significantly worsen the risks of drought, floods, extreme heat and poverty for hundreds of millions of people.

Slack Investor has tried to do his little bit in reducing his CO2 emission- but admittedly, I could do more. In addition to his puny personal efforts, by marshalling the the power of his investments, this might have greater consequences. He is not alone in this thinking.

Environmental, Social and Governance (ESG) principles

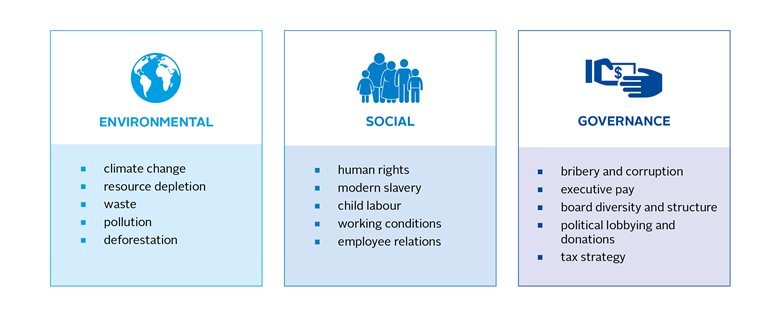
ESG has become a bit of a buzz acronym in corporate and investing circles and is linked with a set of factors associated with “responsible” or “sustainable” company behaviour. Global Warming (or Climate Change) is just one of these ESG issues – but Climate Change is the highest priority ESG issue facing investors.

Examples of ESG Issues – From Principles for Responsible Investment

To invest according to ESG principles is to undertake to exclude companies in their portfolios considered to be doing harm to the world, and often positively skew their portfolio weightings in favour of companies deemed to be doing good.

From the Sydney Morning Herald

A recent investment development has been the collection of environmental, social, and governance data. There are agencies such as Ethisphere and MCSI that rate publicly listed companies on their resilience to long-term ESG risks. But, most people just select a “Sustainable” or “Ethical” or ESG fund and let the fund manager do the company selecting.

Ethical Investing … its a murky world … but worth it!

While getting into an ethical investing fund or ETF is straightforward. Behind the door of each fund, picking which company gets into the fund sets up all kinds of dilemmas. The company selection process seems to be a bit of a “dark” art and can be done by positive screening (e.g, High ESG scores); or, negative screening with the exclusion of industries such as armaments, tobacco, gambling or thermal coal production. Screening might also be done at the company level, for instance, to exclude a mining company might have a dodgy environmental history. Each fund seems to have a different methodology. We hope that the fund managers get it mostly right. The sustainable/ESG funds that I looked at seemed to be dominated by Technology, Financial and Healthcare companies – these are the type of companies that Slack Investor invests in already. But mining companies should not be dismissed in this sustainable search as they will help enable the transition to the low carbon economy – but they too must rethink many of their practices and decarbonize production and reduce water usage.

… renewables power sources are built from non-renewable materials produced by businesses that tend to have larger carbon footprints and low ESG ratings. Mining firms produce many of the critical materials necessary to transition to a low carbon economy.

From Massif Capital – Failure to Impact (PDF):

For example, Massif Capital cite that to build a 400 kg lithium-Ion battery that might be found in most electric vehicles requires roughly 10 kg of lithium, 12 kg of cobalt, 24 kg of nickel, 36 kg of copper, 44 kg of graphite, and 160 kg of steel, aluminium, and various plastic components.

Sustainable Funds are Taking Off

It is not just the recent extreme weather related events such as the 2019 heat wave in Europe, or the recent fire events in Australia and California. There seems to be a surge in the amount of money coming into sustainable funds as investors are starting to think about climate change and sustainability and how this affects their investments.

sustainable funds estimated quarterly inflows
Quarterly fund inflows into sustainable funds. There has been a fourfold increase in assets that flowed into sustainable funds in the US last year – From Morningstar … A Tipping Point

A move towards sustainable investing can be done through your super fund. Each super fund will have some sort of sustainable option for your superannuation money. Or, you could invest directly through a managed fund or an Exchange Traded Fund (ETF).

If you don’t want to buy individual companies and research how sustainable/ethical each company is, I like the ETF approach and would look at ETF’s like Vanguard Ethically Conscious International Shares Index ETF (VESG) for International ethical exposure. It has a spankingly good low management fee of 0.18%. For local products, I couldn’t go past the SPDR S&P/ASX 200 ESG Fund ETF (E200). This ETF has only been going 5 months and has been doing well. It also has a low management fee of 0.13%

Move towards sustainable – and feel good about yourself – and we might just save this planet.

ESPORTS For Me Sport

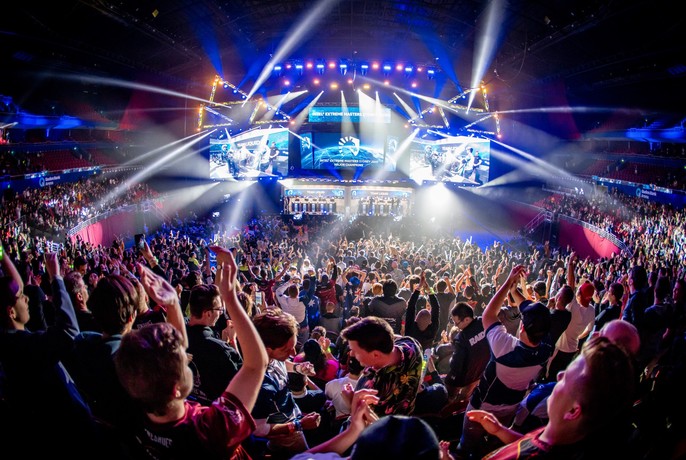
Image from Sydney Esports Open – dailyesports. The Melbourne Esports Open is now postponed to 21-22 AUGUST 2021

A month ago, if you asked Slack Investor what these people are doing, I would have scratched my head. However, in the spirit of trying to know a little bit about a few things, I have been researching the Esport phenomena. I would have guessed that Esport has something to do with multiplayer video gaming … but I have found that Esports are much much more than this – a jumble of entertainment, video gaming, sports, and media. For a brief insight into this strange world of competitive gaming, check out even a few seconds of this Youtube video of an Esports gathering in Paris.

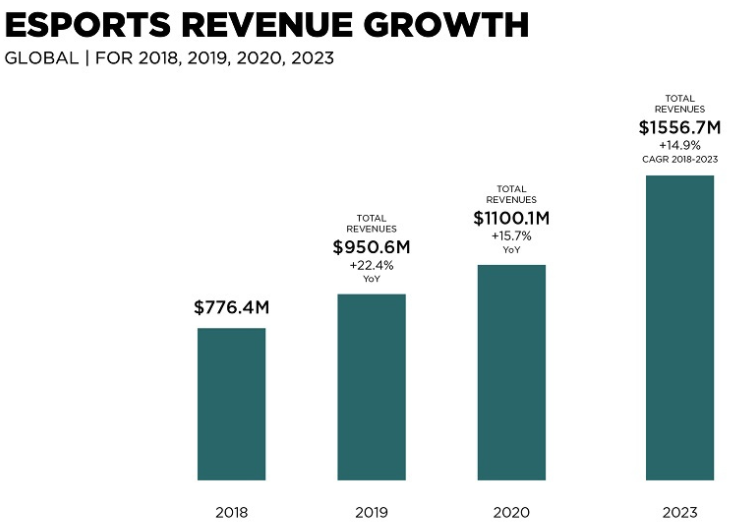
Esports have evolved from the recreational to the competitive and, putting aside arguments of what constitutes a sport, in the world where Chess is considered an Olympic Sport, Esport is the world’s fastest-growing “sport”. There are now more than 2.7 billion active gamers worldwide. Incredibly, the video game business is now larger than both the movie and music industries combined. The top Esports tournaments are transmitted live and are where fans meet and socialise with friends. They draw crowds rivaling the World Cup football and the Olympic Games.

From Newzoo – 2020 Global Esports Market Report

Once you drill down to the specifics of Fortnite or League of Legends, I am lost – but when it comes to growth prospects, Slack Investor pays attention. China is the largest market by revenues, followed by North America. It is not just PC-based games, Esports on smartphones are showing strong growth in Southeast Asia, India, and Brazil.

Although the big stadium Esports events are suffering due to COVID-19 separation rules

The upward trajectory for gaming brought on by the pandemic has accelerated what was already a growth industry, with Australian estimates suggesting demand for esports has at least tripled since the coronavirus outbreak. 

From The Guardian

How to invest in Esports

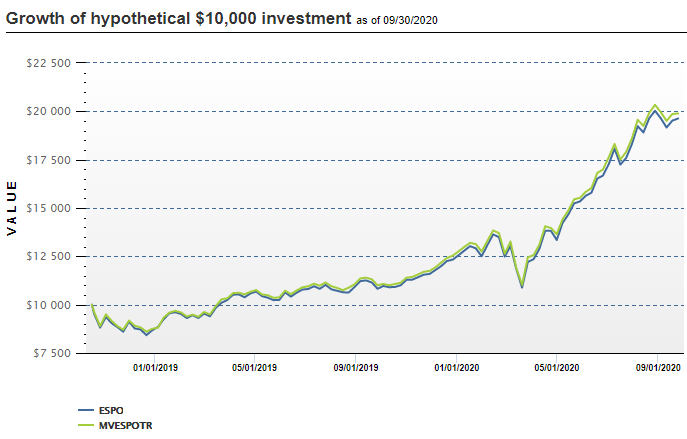
Slack Investor has been generally ignorant on the details of this new phenomena, but I can recognize growth. In October 2018, the fund manager and ETF provider VanEck started an Esports ETF in the US (also called) ESPO . They aimed to replicate the Global Video Gaming and Esports Index by investing in the whole industry. I have watched this ETF from afar and, after a shaky start, the chart below shows that they have been doing OK.

Performance of the VanEck Vectors Video Gaming and eSports ETF (ESPO) against the eSport index (MVESPOTR) since ESPO inception in October 2018.

In September 2020, VanEck have introduced an Australian-listed Video Gaming and ESports ETF (ASX:ESPO) offering exposure to the larger global Esports connected companies. The fund’s top holdings include Nintendo, AMD, Tencent and Nvidia. The management expense ratio is higher than I would like (MER 0.55%), but it is a convenient way to get involved.

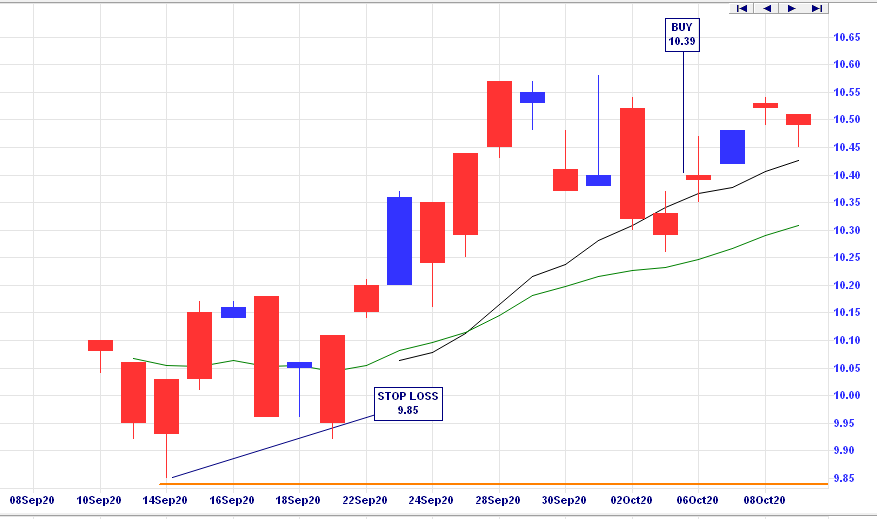
Usually Slack investor makes his decisions on weekly or monthly charts. The ESPO ETF was listed on the ASX less than a month ago (at an initial price around $10) and there is not enough information on the larger time scales. The Daily chart is presented below.

The Daily chart (Click to get a higher resolution) of the newly established Australian listed ESPO ETF established by Van Eck – From incrediblecharts.com

This is not advice, but Slack Investor bought in at $10.39 and set a stop loss at $9.85 at a previous minimum point (“Higher low“). I try to keep initial stop losses at less than 10% of purchase price at a point on the chart that “makes sense” to me. I will check this stock on a weekly basis … and, if ESPO is below the stop loss at close of business on Friday, I will try to sell it on the next Monday – unless it is rebounding strongly!

In many ways, Slack investor has an “actions per minute” at the opposite end to Esports gamers … but, when it comes to smelling growth, Game On!

Stocks for the “Long Run” and August 2020 – End of Month Update

This image has an empty alt attribute; its file name is virgin-ground.jpg

… It’s going to rain and it’s going to blow 

But it’ll be all right, it’ll be all right, it’ll be all right in the long run … 

Excerpt from the “Long Run” lyrics by Redgum (John Schuman) released in 1980.

Slack Investor looks at the shares that he owns occasionally and has a bit of a tinker. Earlier this year I had a portfolio review that saw a dumping of managed funds and high fee ETF’s. I also made an attempt to exit shares that I thought might be severely affected by gloomy economic times. However, sometimes it is good to lift the sights to the horizon and forget about the short term pricing of the market.

“Over the 210 years I have examined stock returns, the real return on a broadly diversified portfolio of stocks has averaged 6.6 percent per year.”

 Jeremy J. Siegel, Stocks for the Long Run

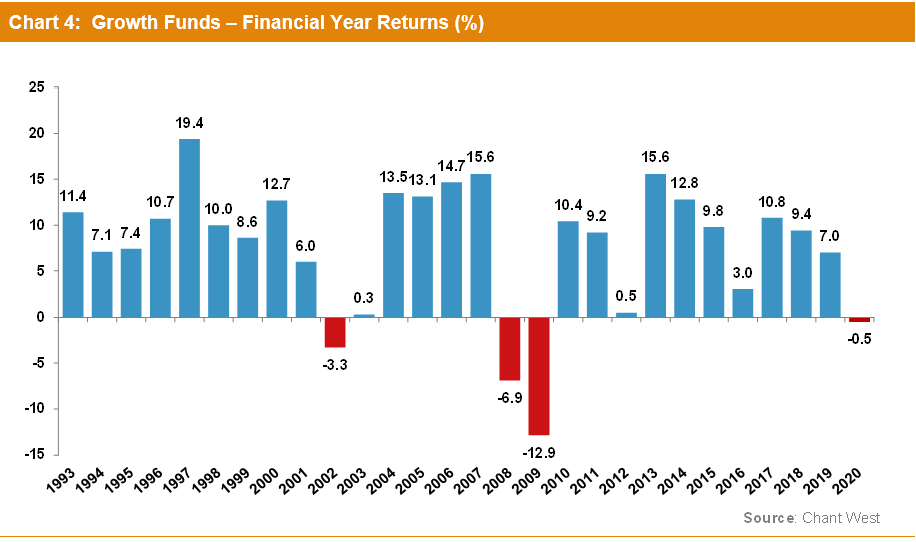
Although the last financial year was a bit bleak for the median of super growth funds (-0.5%), Slack Investor has been around long enough to know that the gloomy times are periodic, and that, “In the Long Run” shares are a very good investment – as can be seen on the 28-year performance chart below.

This image has an empty alt attribute; its file name is 2020GrothFundsChart-4-MR-Jul20.png
The Performance of the median Australian Superannuation Growth Fund over the past 28 years. A “Growth Fund” is defined to have between 60 – 80% of Growth Assets – From Chant West

During my portfolio review I realised that over half my portfolio is in several companies that I would never sell – unless circumstances changed greatly! These companies usually have great management, a plan for growth, and an established track record in increasing Earnings per Share (EPS). Prices may go up and down, but great companies ride though all this and figure out a way to keep growing.

Coles (COL)

COL (2022 ROE 36%, 2022 PE 23) – With around 30% of all supermarket sales, Coles is one of the lucky retailers classified as essential and is getting a boost from COVID-19. This boost wont last forever, and, I cant see any big growth ahead. But, I can’t see myself selling this company as I visit it twice a week to “kick the tyres” and they are doing a good job. There is also the perverse satisfaction of knowing that if I am waiting at the checkout for a time … that it must be good for the bottom line!

Altium (ALU)

ALU (2022 ROE 32%, 2022 PE 56). The PE ratio of Altium has it priced for big future growth and it would be a stretch to buy it now. But this printed circuit board designer is a company for the times and it has a well defined, and so far achievable, global growth strategy.

Although relatively expensive (Forecast PE 56), Altium has no debt, a decent cash balance and keeps growing its profit margin and market share. In 2019, Altium spend 14% of its revenue on Research and Development – This is a commitment to growth in a changing industry.

Commonwealth Serum Laboratory (CSL)

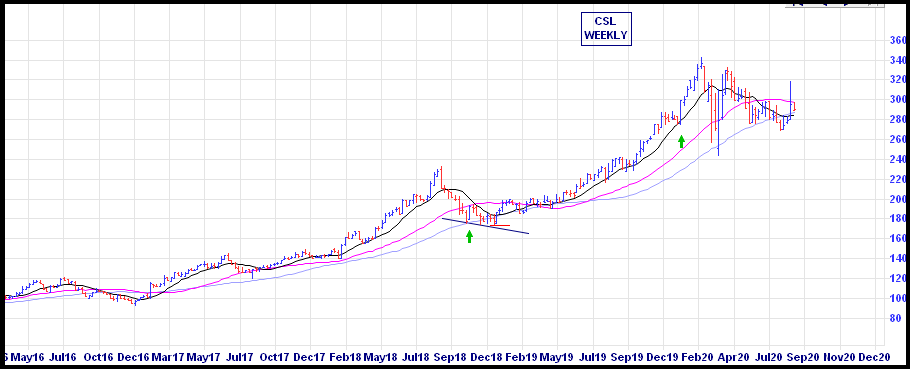
CSL (2022 ROE 29%, 2022 PE 38) – Slack investor first bought into this company 10 years ago at around $30 and I have had the good fortune to add to my holding (at much higher prices!) along the way. CSL is expensive at a forecast PE of 38, but I can remember at my initial purchase in 2010, I thought it was expensive then! With great companies, sometimes you just have to hold your nose and jump in – they are rarely cheap! If it wasn’t already such a large part of my portfolio, Slack Investor would buy more CSL if I could get it below $300. The price chart below is reassuring.

Weekly chart of CSL over 5 years – From Incredible charts.com

Alphabet – (GOOGL)

(GOOGL – 2022 ROE 18%, 2022 PE 24). Alphabet is listed on the US-based NASDAQ exchange and needs an International Broker to invest directly (Commsec will set you up for a cost of 0.31% for trades above USD $10,000). For a growth company, Alphabet is not outrageously expensive with a forecast Price to Earnings Ratio of 24.

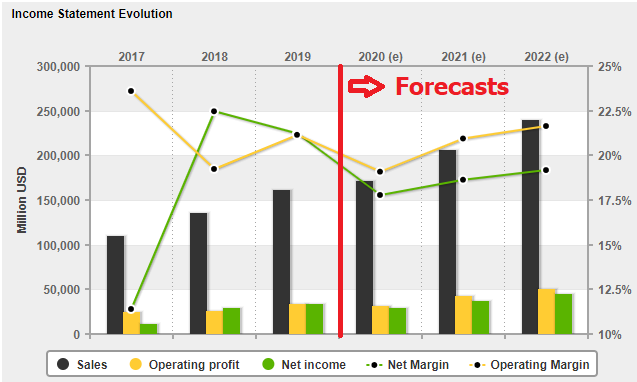
One of the first charts I look at before buying a stock is how its income has evolved – Thank you Market Screener. The GOOGL income chart below is typical of how I like to see them. A steady track record of 3 years growth of sales/income, and then a plan to grow income over the next 3 years.

Income and Forecast Income for Alphabet (GOOGL) – from marketscreener.com

A common theme amongst companies that I am reluctant to sell is their willingness to invest in new projects that might feed back into the earnings of the company. Alphabet spent a staggering US$ 16.2 Billion on research and development – 14.6 % of its revenue in 2018

BetaShares NASDAQ 100 ETF – (NDQ)

(NASDAQ Index – Current ROE 14%, Current PE 23) – Australian exposure to this index comes at a cost (MER of 0.48%) through the NDQ Betashares ETF, but Slack Investor thinks this is well worth it – my costs in owning GOOGL directly are around 0.43%. This ETF is Slack Investors favourite way to own International Tech stocks. With NDQ, you get exposure to 100 of the world’s best tech companies. The NASDAQ Index is a collection of growing household tech names e.g. Apple 13.9%, Microsoft 11.2%, Amazon 10.9%, Alphabet 7.2%, Facebook 4.5%. With a forecast PE of around 23, it still looks reasonably priced if tech world keeps growing.

August 2020 – End of Month Update

Slack Investor remains IN for Australian index shares, the US Index S&P 500 and the FTSE 100. Rises all round for Slack Investor followed overseas markets this month ( ASX 200 +2.2%; FTSE 100 +1.1%) In Crazy Brave USA, the S&P 500 had a monthly rise of an astonishing 7.0%.

At the end of August, the US S&P 500 had a 12-month trailing PE Ratio of 30.09 . The mean and median values are 15.81 and 14.83.

In the real world, the US economy entered a recession in February 2020 and Slack Investor has his stop losses live for all Index funds.

All Index pages and charts  have been updated to reflect the monthly changes – (ASX IndexUK IndexUS Index).

Financial Year 2020 Slack Results

Peter Lynch

“If you can follow only one bit of data, follow the earnings — assuming the company in question has earnings. … What the stock price does today, tomorrow, or next week is only a distraction.”

Peter Lynch, One Up On Wall Street:

The great investor Peter Lynch had plenty of “solid gold” insights that Slack Investor has tried to incorporate into his investing. I have long extolled the virtues of growing companies with high Return on Equity (ROE). But, before I invest, I look at the earnings and projected earnings of each company at an aggregate site such as the most excellent Market Screener – Registration is free!
For example, the current market darling Afterpay (APT) is an excellent business idea and has performed extremely well for those who own it (Up 163% FY2020). APT may be a very successful company – but it is not expected to have positive earnings till 2022. From the earnings table below, both Slack Investor and Peter Lynch would be reluctant to stump up $66 to earn $0.28 in 2022.
June FY
EPS
2017
2018
-$0.04
2019
-$0.18
2020
-$0.16
2021
-$0.01
2022
$0.28
Annual Earnings per Share (EPS) for ASX listed Afterpay (APT) from MarketScreener

Slack Investor tries to get things “mostly right” and fills his portfolio with companies that Peter Lynch would hopefully approve of – There are no Afterpay’s, but many other growing companies that have an established earnings record – There will probably be some temporary downgrades to earnings in the Slack Portfolio this year due to the virus. I could never match Peter Lynch’s legendary performance, where he grew his Magellan Investment Fund from 1977 until 1990, at an average 29.2% annual return – roughly twice the gains of the S&P 500 at the time.

Things were going along swimmingly for FY 2020 till mid-February and the rapid spread of COVID 19 around the world. For FY 2020, the worst performing followed index was the UK, with the FTSE 100 Total Return Index down 13.8%. Dividends helped the Australian Accumulation Index to be down 3.7% for the financial year. These Americans really believe in their stock’s ability to keep earning during this recession (maybe Slack Investor has a twinge of doubt here) … the S&P 500 Total Return Index was UP 12.0% for the same period. All of these Total Return Indexes include any accumulated dividends, wheras the chart below of the ASX 200, just shows stock prices.

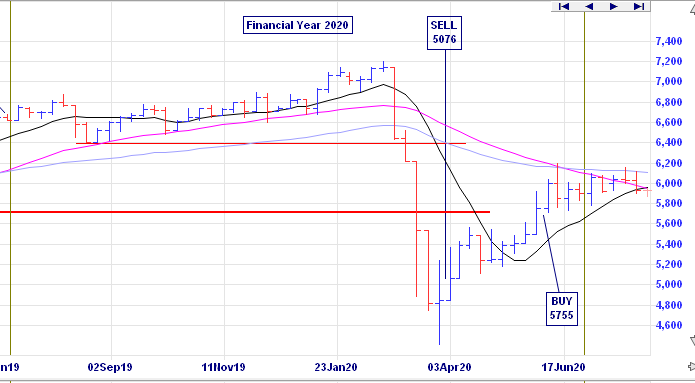
ASX 2oo Weekly chart for FY 2020 – started at 6618 and finished at 5897 (30 June 2019 – 30 June 2020) – Incredible Charts

Slack Portfolio Results FY 2020

Slack Investor has three financial pillars to keep himself steady. I will expand on these in a later post.

  • House – Home ownership gives me great security and pleasure. The bank owned most of this 30 years ago – but now I have the upper hand! (~30% of Net Worth)
  • Income – This used to be my job, but in retirement I have some stable income annuity style investment (~20% of Net Worth) that would pay my bills and maintain a basic Slack Lifestyle should Armageddon befall the stock markets for a few years. This income is supplemented by income from the Slack Portfolio.
  • Slack Portfolio Investments – (~50% of Net Worth) – Now currently in my Self Managed Super fund (SMSF) which is almost exclusively invested in growth companies. These are great businesses to be invested in if you have a long time horizon – as stock prices can be volatile in high Return on Equity (ROE) shares. I am currently retired and would not rely on the Slack Portfolio for stable income. Because of the stability of my other two pillars, I can be quite aggressive in the allocation of my investments in the Slack Portfolio – as I know I will not have to panic sell (for income) during any downturn.

All Performance results are before tax, given the circumstances, the Slack Portfolio annual FY 2020 performance of +9.4% was a pretty good result. Full yearly results with benchmarks are shown in the table below. A mediocre year for all benchmarks exposed to Australian and UK share markets (Median Balance Fund +0.3%, Vanguard Growth Fund +0.6%, ASX 200 Accumulation -2.7%). Real Estate was a good investment in the Brisbane and Melbourne markets for FY 2020 (+8.4% and +13.8%) – but the winds for these investments are blowing the wrong way now.

YEAR SLACK FUND MEDIAN BAL VGARD GROWTH ASX200Acc RES BRIS RES MELB CASH CPI
2010 6.6 9.8 12.3 13.1 10.8 26.9 4.2 3.1
2011 2.5 8.7 9.1 11.7 -2.4 0.9 4.4 3.7
2012 8.3 0.4 1.3 -6.7 1.3 -0.9 4.3 1.2
2013 26.5 14.7 18.6 22.8 7.7 8.3 3.2 2.4
2014 23.6 12.7 14.5 17.4 11.5 12.8 2.6 3.0
2015 2.4 9.6 11.8 5.7 7.7 15.6 2.5 1.5
2016 14.2 2.8 4.2 0.6 8.4 9.5 2.2 1.3
2017 19.5 10.4 8.8 14.1 6.5 17.7 1.9 1.9
2018 37.6 9.2 10.0 13.0 1.1 5.2 3.9 2.1
2019 19.7 7.2 9.8 11.2 1.7 -6.0 2.0 1.3
2020 9.4 0.3 0.6 -2.7 8.4 13.8 1.1 -0.3

The Slack Fund yearly progress vs BENCHMARKS. The Median Balanced Fund (41-60% Growth Assets)Vanguard Growth FundASX 200 Accumulation IndexCorelogic Residential Property total return in both Brisbane and Melbourne, and Cash (Australian Super Cash Fund) and Consumer Price Index (CPI)

The Five-year compound annual performance gives me a much better idea about how things are going and will smooth out any dud (or remarkable!) results.

The beauty of compounding with a succession of good performance results can be seen in the chart below showing the growth of an initial investment in June 2009 of $10000.

FY 2021 Resolutions

Image from the perceptive Gary Markstein.

The delusional President Trump provides many lessons to Slack Investor. The absence of these traits in Trump reminds me that humility and compassion are such worthwhile qualities. I will continue to work on these personal attributes this coming financial year and always be grateful for good fortune. I made plenty of mistakes this year and in hindsight sold some shares just before a decent price rise (e.g, IRI, CIP, VGE) – but Slack Investor accepts this as just the “normal path” of investing.

Slack Investor has no form in trying to predict the future … In the last 6 months I have tinkered with the Slack Portfolio and tried to get rid of any companies that would suffer severe setbacks in this COVID-19 led global recession. I have no great faith in my ability to time the exit and entry of exposure to sharemarkets, and I remain fully invested. Slack Investor is prepared to “ride this one out” with cash in the Portfolio at less than 1%.

In the wise words of Peter Lynch …

“Far more money has been lost by investors preparing for corrections or trying to anticipate corrections than has been lost in the corrections themselves.”

Peter Lynch, One Up On Wall Street: