Nuns Know Best

In Nuns … Wisdom – The New Indian Express

Slack Investor loves a good story – whether its true or not! I like the owning of stocks and I also admire anyone who can stick to their vows. All of this seems to intersect with the story of the Coppock Curve – a technical indicator that can be mapped on stock price charts that has a great track record for showing when the market has reached the “bottom” of a cycle.

When I first started to think a bit more seriously about financial things, I was going to an evening investment class in Townsville. The class was held by a personal Slack Investor Hero, Robbie Fuller, who put on these classes for no personal gain … he just wanted to educate people about the opportunities that lay waiting in the stock market. Robbie would teach us about fundamental analysis (trying to measure the intrinsic value of a stock) and technical analysis (charts and trends). There was always a particular beauty when fundamental and technical information aligned about a company.

The class was usually a lot of fun, but I remember a time around 2011 when the markets were going through a bit of a lacklustre period and we had all had a few recent losing trades – there was just not much excitement about stocks.

Robbie came bounding in one evening after 31 July 2012 with the news that the Coppock Indicator had just turned … it was a sign that “good things will happen”- He was right – It was the start of a 3-yr period where the Australian market was mostly rising. It is much easier to trade when the “tide is coming in”.

The Coppock Curve is a “smoothed” momentum indicator developed by the economist Edwin “Sedge” Coppock and published in in a 1962 issue of Barron’s. It all started when he was commissioned by the Episcopal Church to find long-term investment opportunities for the Church fund.

According to the legend, he asked a group of nuns (or bishops!) how long it took the bereaved to “recover” from their grief. The answer was 11 to 14 months. He took the radical step of thinking that something similar might happen in stock markets after a market high and subsequent downtrend. He assumed that because markets are motivated by emotion, they might be ready to “move on” after a period of 11-14 months of “grief”.

“Crowds do too much too soon”, he wrote. “They overdo. When they get an urge to speculate, their concerted demand forces prices up at a rate far greater than the growth of the company into which they are buying. Likewise, when they liquidate holdings or make short sales during a panicky decline, they ignore basic economic facts. They overdo because they are motivated by emotion rather than reason.”

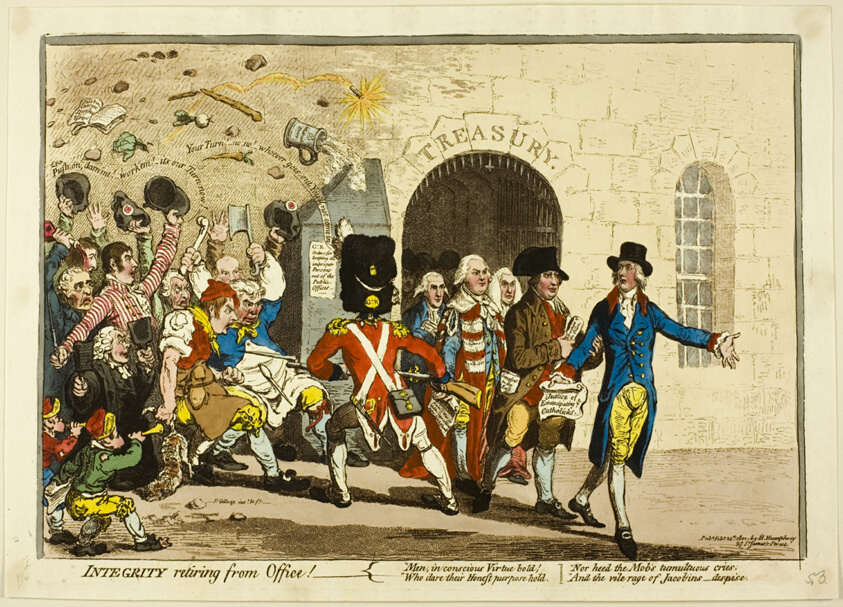
Edwin “Sedge” Coppock – from Business Insider

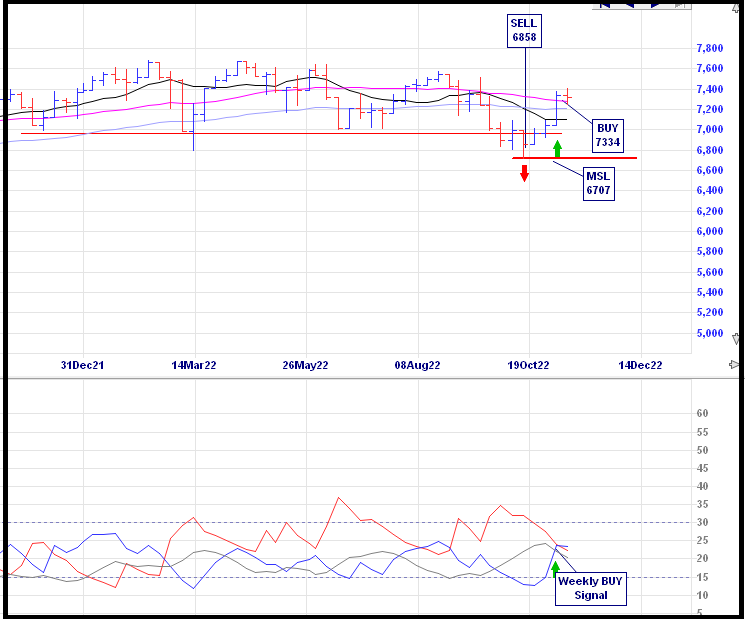
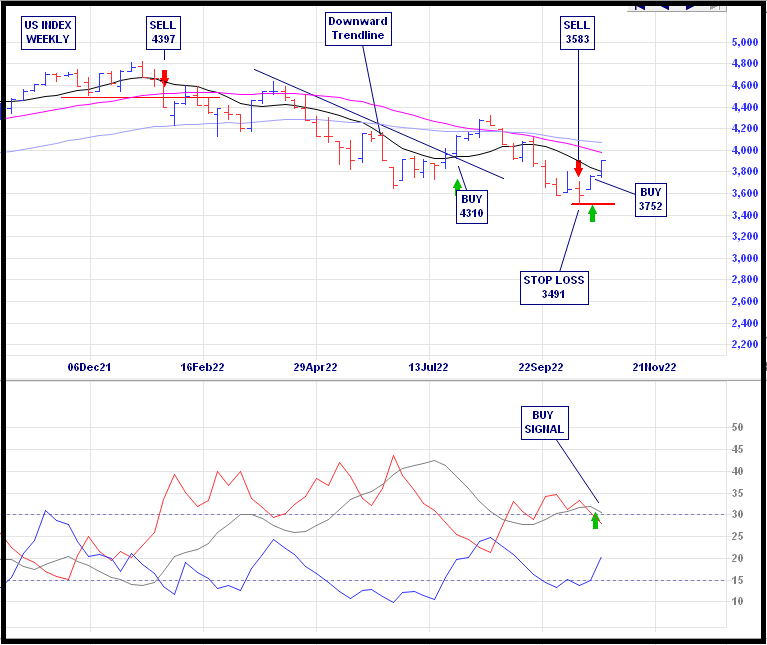
The Coppock Indicator has had an incredible track record in signalling the end of a “bear market”. The signal (Green Arrow) is triggered when the indicator (shown in the lower screen below) bottoms from under the zero line and then slopes upwards.

Monthly chart of the ASX 200 together with the Coppock Indicator below. The green arrows show the “bottom of the market” predictions using the Coppock Indicator. The red arrows show a possible time to sell – Click the chart for better resolution – Incrediblecharts.com

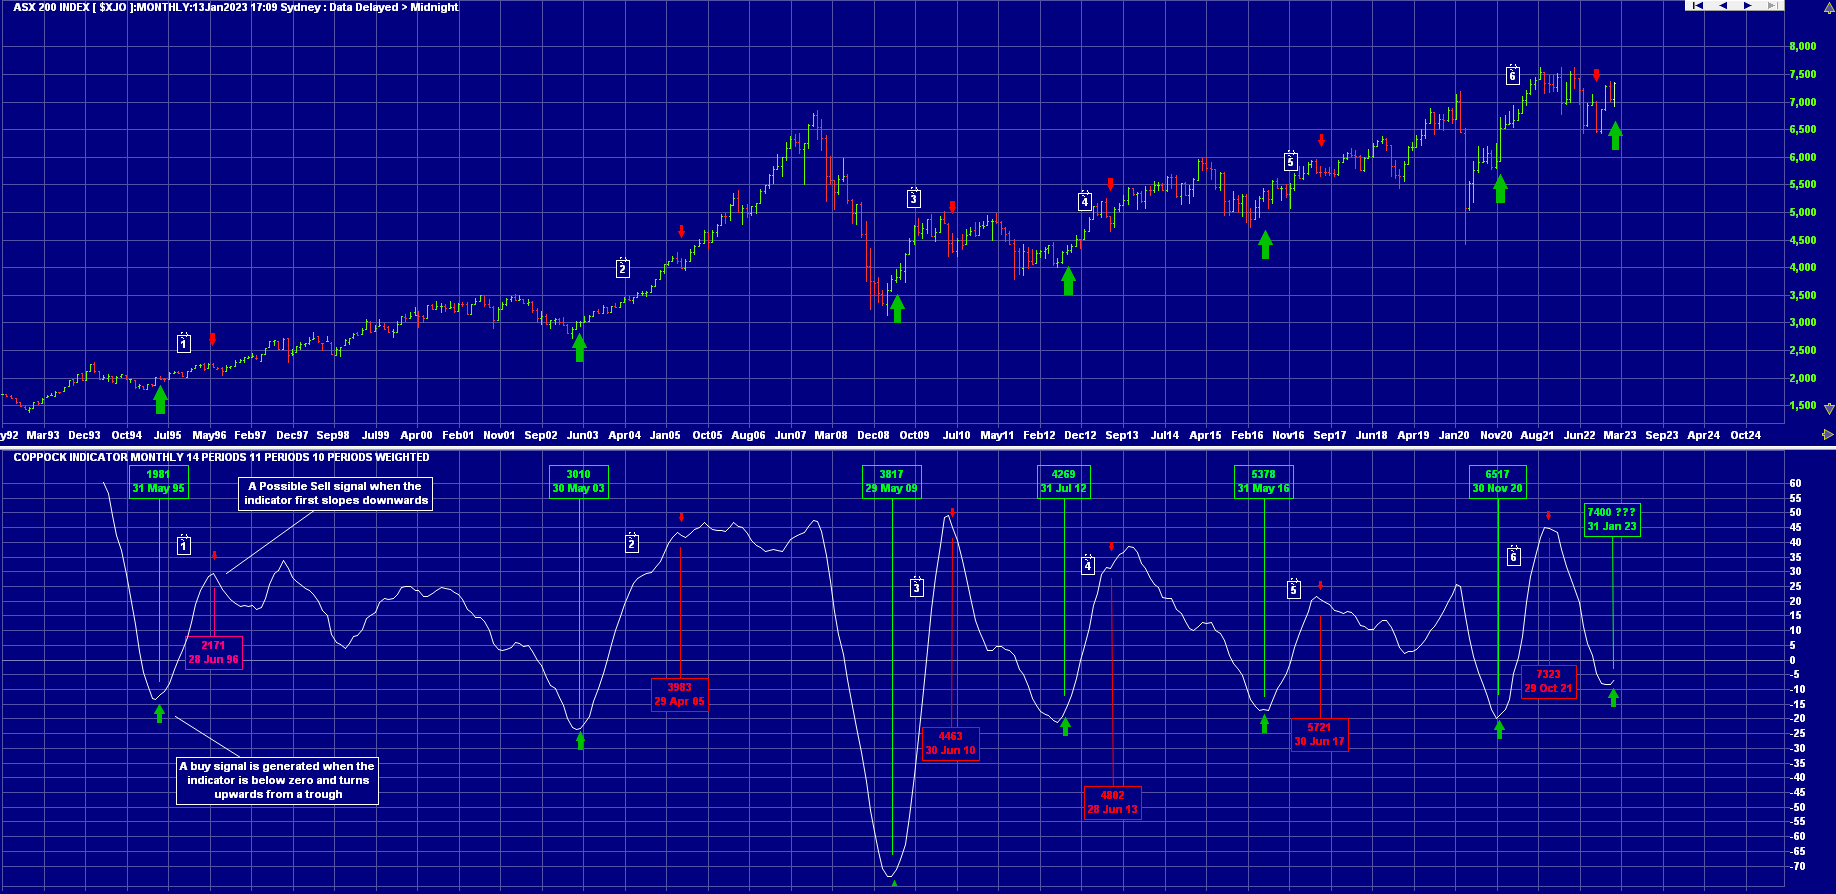
The indicator gives buy signals very rarely, only 6 times in the past 30 years for the ASX 200. But it has just given another one, signalling a buy for the ASX 200. The maths of the curve is a little complex, but it looks for the next uptrend after the market establishes a high and then goes through a 11-14-month “greiving” period.

Is Coppock’s Bollocks?

There is no perfect trading indicator. Coppock designed his indicator to try to establish a “bottom of the market” buy signal to identify long term investment opportunities. He didn’t try to use it as a selling tool. However, there is a trading strategy that uses this indicator after a BUY signal.

  • SELL when the Coppock Curve takes its first downwards trajectory OR,
  • SELL when the Coppock Curve falls below zero

I have trialled both methods and the strongest gain (p.a) results were with the first method. I have marked these sell signals on the chart above with red arrows and tabulated the gain results below.

COPPOCK CYCLEBUY DATEASX200SELL DATEASX200GAINPERIOD(yr)GAIN (p.a.)
131-May-95198128-Jan-96217110%0.6614.5%
230-May-03301029-Apr-05398332%1.9116.9%
329-May-09381730-Jun-10449318%1.0916.3%
431-Jul-12426928-Jun-13480212%0.9113.7%
531-May-16537830-Jun-1757216%1.085.9%
630-Nov-20651729-Oct-21732312%0.9113.5%
 31-Jan-237400??????

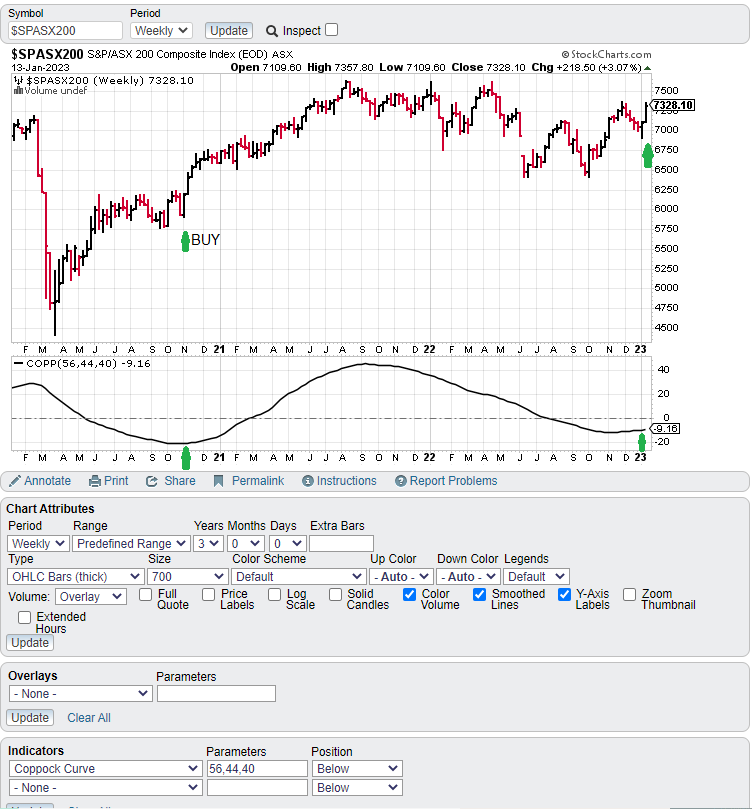
Slack Investor uses Incredible Charts to do all his charting … but their indicator screen can get complicated. To easily follow the Coppock Indicator on any stock, just use the free, but great, StockCharts and put in the same chart attributes below.

ASX 200 Chart from StockCharts – showing stock price on top and the Coppock Curve below.

Slack Investor is a great believer that market timing is difficult and that the best time to buy stocks is “all the time” – by automating your investments so that their is no decision inertia. Use dollar cost averaging.

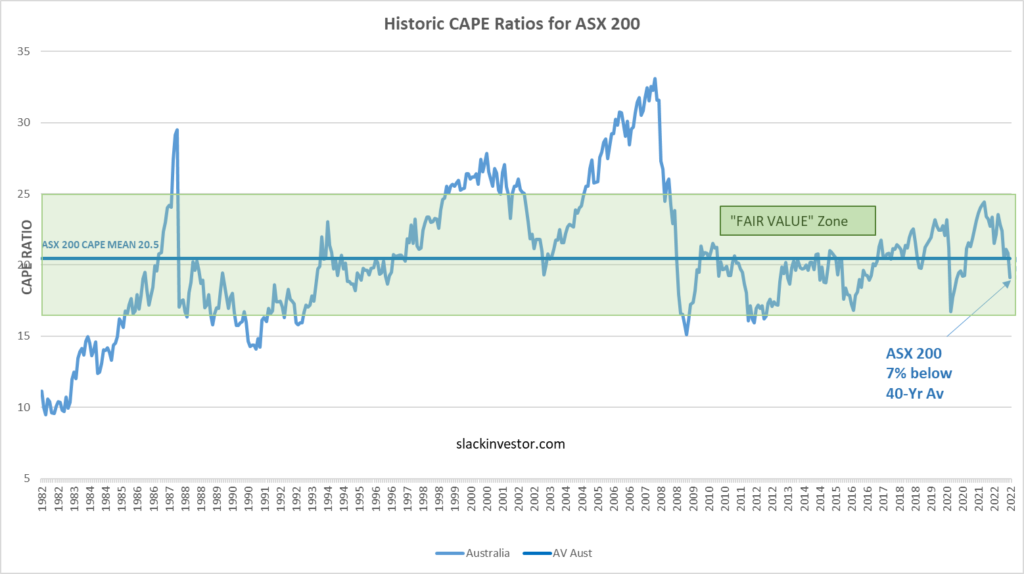
However, looking at the chart history of this indicator … and the GAIN results in the above table, this is not advice, but now looks like a good time to get into the Australian market. Although, officially, the Coppock results are based on the end of month data. In addition, using Slack Investor’s CAPE valuation method, at the end of December 2022 the ASX 200 was “fairly valued”.

Nuns are not infallible … but mostly wise.

Imperfections in the Brickwork and … December 2022 – End of Month Update

Detail from the Pen and Ink “Behind Armstrong Street Shops” – the remarkably talented Bren Luke, 2022.

Slack Investor is always on the lookout for new investments … and nothing attracts the jaundiced Slack Eye more quickly than continuous long term results.

Brickworks Ltd (BKW:ASX) have just had their AGM presentation. I was very impressed by the claim that they have maintained, or increased, normal dividends for the last 46 years!

Dividend record – Brickworks 2022 AGM presentation – Brickworks
Tracking the share price of BWK:ASX since 1968 – Brickworks 2022 AGM presentation – Brickworks

As well as being a very good maker of bricks, Brickworks operates as an investment company and own a 26.1% stake of the diversified investing house Washington H. Soul Pattinson (SOL:ASX). SOL, in turn have holdings in

  • TPG Telecom – Australian telecommunications provider
  • Brickworks Limited – Clay and concrete production for the construction industry
  • New Hope Group – Coal and oil mining and energy generation
  • Tuas Limited –  Telecommunications provider
  • Apex Healthcare Berhard – Malaysia-based pharmaceutical production
  • Pengana Capital Group Limited – Fund management
  • Aeris Resources –  Mining and exploration activities

Now Slack Investor does not want to get all preachy here, as as everyone has to draw their own line in the sand – These things are very subjective. I looked up New Hope Mining on the excellent Morningstar Sustainalytics site to get an idea on how well the company is ranked in terms of Environment Sustainability and Governance (ESG).

ESG Risk rating for New Hope Corp. Ltd. – from Sustainalytics

New Hope Group ranked 14571 out of 15559 in terms of ESG risk rating – on a worldwide basis. I personally would feel uncomfortable being a part owner of a thermal coal miner given the current state of the planet.

So despite the most excellent management and performance of BWK, while they still own an interest in the New Hope Group, I will look elsewhere for investments.

Puff Puff MOAT

On the subject of digging deep, I have been a long term holder of the VanEck Morningstar Wide Moat ETF (MOAT:ASX). Slack investor has many vices – Wine and beer just being just two of them … so again, I won’t lecture – as these things are very personal. However, some of the sins that my mother rubbed into me as being “particularly evil” are smoking and gambling. I will do my best to avoid ownership of these type of stocks in deference to my dear Mum.

I noticed back in 2021 that this MOAT ETF had Phillip Morris International as one of its top 10 holdings. According to the Yahoo Finance site – Phillip Morris is 2.5% of the MOAT holdings! Owning a part of a multinational tobacco company that is a leading part of Big Tobacco didn’t really sit well with Slack Investor.

According to the Global Burden of Disease Study, in 2015 alone, smoking caused more than one in ten deaths worldwide and killed more than 6 million people, resulting in a global loss of nearly 150 million disability-adjusted life-years

The Lancet

Slack Investor marked MOAT as an ETF to get rid of, despite liking the concept of its construction – “companies with sustainable competitive advantages”. I had a feeble attempt at shareholder activism and emailed VanEck about this … and enquired whether thy might screen the MOAT ETF with an ethical filter … to get rid of tobacco and gambling stocks – they replied with a polite “no”.

Modified (to protect the innocent!) email from VanEck to Slack Investor

I finally got around to attempt to sell MOAT this month and I thought I should just check the VanEck holdings MOAT site and look at their complete holdings list. Lo and behold … at 29/12/2022, Phillip Morris has now gone from their holdings list! So, for now, MOAT is a keeper!

If at a loose end during the holidays and need a distraction, Slack Investor highly recommends the free exhibition “Streets of Your Town” at the Ballarat Art Gallery, VIC. Bren Luke is an amazing artist, his exhibition runs till 5th Feb 2023.

December 2022 – End of Month Update

The year closes and, I’m not sure if Slack Investor was naughty (probably?)… but, there was no “Santa Rally” this month. All followed markets took a dive in December. The ASX 200 down 3.4%, the FTSE 100 down 1.6%, and the S&P 500 down 5.9%,

Due to the return of all followed share markets to more normal valuations, I have returned my stop-loss upper-limits to 15%. This means that when I work out my stop loss value, I add another 15% to it, this is my upper limit. If the stock price exceeds the upper limit, I will adjust my stop loss upwards. This method helps to lock in some gains if they occur.

Slack Investor remains IN for the FTSE 100, the ASX 200, and the US Index S&P 500.

All Index pages and charts  have been updated to reflect the monthly changes – (ASX IndexUK IndexUS Index). The quarterly updates to the Slack Portfolio have also been completed.

Checkmate! ASX

From Chessbase

Slack Investor is all about “continuous improvement” Obviously not me … but everybody else! I normally have low expectations of “clip the ticket”, almost monopoly, systems such as the Australian Stock Exchange (ASX) as there is little incentive for improvement – they are going to get there cut anyway. Last year, I did get off the couch briefly to have a bit of a rant about ASX Paper …I’m Drowning!‘ But I did end the blog on a hopeful note, that system change was just around the corner with a new “blockchain” based system to replace the Clearing House Electronic Sub-register System of the ASX (CHESS).

After reporting five delays on the CHESS replacement project, the ASX has just announced a move to drop the whole project – that it has been thinking about since 2005. In a damning review of the ASX’s handling of the project by Accenture, that has been described by business leaders as “embarrassing”. There are now undermined expectations that the ASX can ever deliver on any new market infrastructure with its current board and management.

The project, which has dragged on for seven years, will now be “reassessed”, the ASX stated in a media release this morning, with the abandoned software being “derecognised” at a gross cost of $245 million to $255 million.

Tahn Sharpe – The Inside Adviser

Although the structure of the current CHESS system is not broken, there are a lot of things that should be fixed.

The underlying software that runs CHESS was a legacy gift from the NASDAQ exchange (i.e. Cost = $0). It is starting to creak a bit though, as it was written over 22 years ago in COBOL. Slack Investor was hoping that the new system would improve on the layers of fee-charging “ticket clippers” that are in the current system – but it seems that the vested interests still have the ear of the ASX.

… the reality is that the CHESS replacement looks more like a replication of all the old systems with its layers of fees being paid to half a dozen different players.

Chanticleer – afr.com

Instead of being the first National Stock Exchange to try use the blockchain technology, perhaps the ASX could wait and see whether other exchanges can bed down this new “distributed ledger “technology – then adapt their systems. After all, using market value, our exchange represents under 2% of the world’s companies.

Countries with largest stock markets worldwide (January 2022), by share of total world equity market value – Statistica

But what would Slack Investor know? – he is only a punter. In the meantime, streamline the current CHESS system – make it better. Whatever we do … it should cost less than $250 million!

Vanguard Super … and November 2022 – End of Month Update

Slack Investor Hero, Jack Bogle, reflecting in casual ware – on how to keep costs down – New York Times

Jack Bogle created Vanguard as a “penny-pinching” financial powerhouse that was owned by the shareholders of its funds. Vanguard pioneered the low-cost index funds revolution.

The Vanguard Effect

The cost of financial products is important, and Slack Investor does his best to minimise any fees that come with financial transactions. It is not often I get to talk about two of my favourite finance things in one blog. Vanguard, the low-cost fund trendsetter and superannuation.

Vanguard have long been a fund manager and ETF provider that have been at the forefront of lower fees in the finance sector. The term “Vanguard Effect” has been coined to explain the phenomena that when Vanguard competes in an area, the expense ratios from their competitors tend to decrease.

Tracking the average Management Expense Ratio (MER) for US Index fundsVanguard

Vanguard Superannuation in Australia

This month, Vanguard launched into the Australian Superannuation space with a product that is transparent and amongst the lowest fees for an accumulation account. The beauty of their offering is the straight up bundling of all their fees into one simple number – 0.58% of your super balance. Of course, Slack Investor would like a lower management fee – but this is a good start.

0.35% (Administration) + 0.21% (Investment) + 0.02% (Transaction) = 0.58%

The Vanguard MySuper Lifecycle product fees depend on how much Super you have. For a $50,000 balance, the total annual fee would be $290, for a $500,000 balance, the total annual fee would be $2900. The transparency is good – Drag out your own Super annual statement and try to work out your own total fees.

Using the ATO’s comparison of MySuper products tool for a few of the popular industry funds for a $50K balance.

UniSuperAustralianSuperHostPlusHesta
5-yr Net Return6.44%7.07%7.58%6.53%
Annual Fee$316$452$619$510

Of course, fees are not the only consideration. Many of the Industry funds use some sort of stock picking, and may use private equity to enhance their performance. Vanguard Super is made up of a mixture of index funds. I do like the way that the Vanguard Lifecycle automatically adjusts your exposure to risk as you creep towards retirement. 90% growth assets till age 45, then tapering to below 50% when you reach 60. All this is done automatically by Vanguard.

The adjustment of exposure of the Vanguard Livecycle super between growth and defensive assets as you age – Vanguard

Despite this juicy offering, there is often a lack of engagement of Australian workers with their superannuation. Vanguard will probably have a bit of trouble gaining traction in Australia due to the size and popularity of their industry super competitors. This product is currently only for accumulation accounts at this stage. It is a decent starting point by Vanguard and l0ok forward to details of their pension option (coming soon!). I also am hopeful of a bit of the “Vanguard Effect” to put a bit of pressure on existing superannuation fees – which are still too high.

A note that Slack Investor is not sponsored by Vanguard (or anyone else!), but I own a few of their ETF’s and their original founder, Jack Bogle, is one of the Slack Heroes.

November 2022 – End of Month Update

Slack Investor is now back IN for Australian index shares, UK Index shares and UK Index shares.

Last month’s update describes why I feel glad that my 20-yr index timing experiment is coming to an end in 2024. The frustrating moving out … then quickly back in to my Index funds is getting tiresome. I am likely to become just a “buy and hold” investor for my small portfolio of Index funds.

This month, all markets found there were “Reasons to be Cheerful”. There were positive movements all round. The ASX 200 +6.1%, the FTSE 100 +3.3% and the S&P 500 +5.4%.

All Index pages and charts have been updated to reflect the monthly changes – (ASX IndexUK IndexUS Index).

The Hubris Ark

Cathie Wood CEO of Ark Invest – from Observer

hubris: (noun) –  an extreme and unreasonable feeling of pride and confidence in yourself:

Cambridge Academic Content Dictionary

Cathie Wood is the CEO of Ark Innovation and is best known for her NASDAQ based flagship fund ETF (ARKK). She has been concentrating her bets on the “disruptive technologies,” such as artificial intelligence, genomics, blockchain and cryptocurrency, and clean energy. She is a big fan of Tesla and has made the prediction

Bitcoin will crack $1 million by 2030

Cathie Wood – The Street

Slack Investor is no seer … but at the October 14, 2022 price of 16240 USD, Bitcoin has quite a way to go to reach that mark. In the words of the great BBC TV character Sir Humphrey, this looks like a “very courageous” prediction Cathie!

The ARK Innovation ETF (Nasdaq: ARKK)

Wood, is a devout Christian, and has named her company after the sacred Ark of the Covenent. Cathie Wood is a household name in the US and has a huge number of loyal fans. Her funds had 60 billion USD under management at their peak. She was named by Bloomberg as Stock Picker of the Year in 2020 . The flagship ARKK fund gained a remarkable 152% in 2020, but since then, the performance has not been so stellar – ARKK is down 65% so far this year. In interviews, she often refers to her past success, and insists, over and over again, her performance should be judged over a five-year time horizon.

The Price chart of the ARKK ETF since 2017 –

Wood is nothing but confident. She hosts a monthly finance video – delightfully called “In the Know” and is a great defender of her fund. She sees “spectacular returns” for Ark Invest over the next five years. According to a recent article by New York magazine, her initial predictions for ARK Invest were annualized returns of 15 percent, “Now we think 50 percent.”

Slack Investor would agree that a 5-yr holding period is a good minimum to judge how a fund is performing – to allow for volatility and to allow growth stocks to grow. She might be right that tech stocks are undervalued at the moment. But let’s have a look at her results as a fund manager over the last 5 years. The total return of ARKK expressed as a compound annual growth rate (CAGR) since November 2017 was a not so impressive 3.5% when compared with other “no stock picking” index funds.

InstrumentValue Nov 2017Value Nov 20225-yr CAGR
ARKK36.4443.313.5%
NASDAQ 100 TR71591388114.2%
S&P 500 TR5212840710.0%
FTSE 100 TR651075643.1%
ASX 200 TR56486811027.5%
Based upon the 5 years preceding November 2022, the compound annual growth rate (CAGR) of various Total Return (TR) index values compared with the ARKK ETF (including dividends since Nov 2017 of $2.91 USD). These TR calculations include dividends. Data from Yahoo Finance and CAGR calculations from CAGRCalulator

Cathie Wood conducted a recent session at a Morgan Stanley event in Sydney. where she maintained her bullish outlook. According to the Financial Review, the fund manager essentially argued it’s the market that’s got it wrong, not her!

Slack Investor is far more humble … he “takes his licks” when times are bad – doesn’t “crow” when times are good – and is mostly wary when a new “stock guru” emerges.

In the stock market, volatility is the price he has to pay for being involved with long-term asset growth.

November 2022 – Mid-Month Update

This image has an empty alt attribute; its file name is trend-1445464__180.jpg

My small-scale, and often very frustrating, market timing experiment continues until its projected end in 2024. On a weekly signal for the FTSE 100 from the momentum following Directional Movement system. I have bought back into the UK index. I am back now to fully invested in the ASX IndexUK IndexUS Index.

The buy signal can show itself as a downward dip in the trend strength indicator ADX (grey line) of the lower panel below. There are many ways of setting up this Directional Movement system. Slack Investor likes the “smoothing” that is enabled by a system that looks back over the previous 11 periods – but the complexities are best left for the Resources page.

FTSE 100 Weekly chart showing a BUY signal on the Directional movement Index weekly chart. The weekly price ranges are at the top and Average Directional Movement Index (ADX) patterns below – From Incredible Charts

The Index page has been updated for the  UK Index. 

Finding Value … and October 2022 – End of Month Update

Widewalls

In amongst the general carnage of the market, Slack Investor has been doing a little buying. An opportunity came up with an existing holding. Dicker Data (DDR). DDR is an Australian-based technology hardware, software and cloud distributor.

From time to time, a company will go to institutions and shareholders to raise a bit of working capital using a Share Purchase Plan (SPP). Dicker Data (DDR) needed to expand its warehouse facilities. Fair enough – but does Slack Investor want to part with more cash to invest in this company? Lets take a fresh look using the excellent Market Screener Financials Page. The Slack “basics” of a high return on equity (38.7% in 2022) and projected growth – on top of an established period of growth – are still intact – Tick

DDR – Historical (Black)and analyst projected income growth (grey) till 2024 – Market Screener

The price of DDR has been generally “beaten up” in the last 6 months as interest rates have risen and growth stocks have suffered. There are probably some more tough times ahead … but Slack Investor likes to take the “long view”. This business has a long term growth strategy and will probably persevere despite current headwinds – Tick.

DDR – Analyst projected PE ratio till 2024 – Market Screener

The current DDR Price/Earnings ratio is 22.9 – below recent values and projected to reduce further as income increases. – Tick.

Although analyst predictions can be wrong, on balance, the miserly Slack Investor was happy to part with a few dollars in this Share Purchase Plan as he could find some value in this business. There is every prospect that the DDR share price will increase in the next few years.

Finding Index value using CAPE

As with individual companies, the whole share market will oscillate betwee overvalued and undervalued. Slack Investor has written about the Cyclically Adjusted Price to Earnings ratios (CAPE) which use ten-year average inflation-adjusted earnings to take out some of some of the volatility of annual earnings. By plotting this CAPE over a period of time, we can look at how the whole sharemarket is currently valued in terms of historical data.

Using monthly CAPE data from Barclays, the 40-yr mean is calculated and plotted together with the CAPE values. A “fair value” zone is created in green where the CAPE is within one standard deviation of the mean.

Historic CAPE ratios for ASX 200 – From 1982 to September 2022
Historic CAPE ratios for FTSE 100 – From 1982 to September 2022
Historic CAPE ratios for S&P 500 – From 1982 to September 2022

From the above, The ASX 200 (7% below av.) and the FTSE 100 (13% below av.) are “On Special” at the moment as their CAPE values are below their long-term averages. Even the S&P500, after a long 2-yr period of being “Over valued”, is now getting close to being “Fair valued”.

October 2022 – End of Month Update

Slack Investor remains IN for Australian index shares though it is still on watch after breaching its stop loss at the end of September 2022.

My last post described how I had left the UK and US Index in the middle of October 2022. I am now back IN to the US Index – and, for the moment, OUT of the UK Index. Although, I am keeping a weekly watch on the FTSE 100 in case there is a signal to return to the market.

This month illustrates why I feel glad that my 20-yr index timing experiment is coming to an end in 2024. After exiting the US and UK markets only 2 weeks ago, there has been a rally in both the US Index S&P 500 and (to a lesser extent) the FTSE 100. The momentum has been sufficient for Slack Investor to be “whip-sawed” back into the US Index on a weekly buy signal – I am starting to get “really over” this timing the market experiment.

For the experiment, Slack Investor uses a trend following (or momentum) system called the Directional Movement Index. The buy signal shows itself as a downward dip in the ADX (grey line) of the lower panel below. There are many ways of setting up this system. Slack Investor likes the “smoothing” that is enabled by a system that looks back over the previous 11 periods – but the complexities are best left for the Resources page.

S&P 500 Weekly chart showing a BUY signal on the Directional movement Index weekly chart. The weekly price ranges are at the top and Average Directional Movement Index (ADX) patterns below – From Incredible Charts

This month, there are positive movements all round. The ASX 200 +6.0%, the FTSE 100 +1.6% and the S&P 500 +8.0%.

All Index pages and charts have been updated to reflect the monthly changes – (ASX IndexUK IndexUS Index).

Let’s Lay a Few Bricks … and Mid-Month Update

A 1999 extract from The Sydney Morning Herald showing a 13-yr old Chris Brycki – smartcompany.com.au

Slack Investor will admit to being less than young … but I am still capable of being a “Fan boy” when I see something impressive happening in the financial world.

After a series of schoolboy stock picking successes – winning the ASX’s Share Game a remarkable 3 times and, at university, he entered the JP Morgan Trading Competition, which he also won several times. The talented Chris “the Brick” Brycki, launched into a career with stockbrokers and financial houses. After a while, he started to question the long term performance of fund managers.

“… The problem is that over time, even by being right, the value added is not big enough to counteract the 1% fee that a lot of these fund managers charge.”

Chris Brycki – Stockspot – Livewire

Chris founded Stockspot in 2013 as an alternative way to invest. Their Robo Advice model offers a low-cost automated alternative to traditional fund managers and advisors. After a simple online survey to determine your investing stage and risk tolerance, an investment portfolio type is recommended to you.

Stockspot Building Blocks

Chris, founder and CEO of Stockspot, in 2020 – From smartcompany.com.au

Chris (and Stockspot) have come up with the breathtakingly simple, yet genius (Both Slack Investor and Donald Trump have a loose definition of genius), strategy. After researching thousands of ETF’s and, based on exposure, performance and low fee costs – Stockspot has selected just 5 of them as the building blocks for a range of different portfolios. The portfolios are based on risk tolerance, financial situation and the investor’s appetite for volatility. The five component ETF’s are in Australian Shares (VAS), Global Shares (IOO), Emerging Global Markets(IEM), Australian Fixed Income (IAF), and Physical Gold (GOLD).

ETFSymbol (ASX)1-yr PerformanceGrowth since InceptionManagement Fee
Vanguard Australian Shares IndexVAS-7.92%8.25%p.a (13+ years)0.10%p.a.
iShares Global 100 IOO-4.43%7.37%p.a. (15+yearsr)0.40%p.a.
iShares MSCI Emerging MarketsIEM-20.59%7.18%p.a.(19+ years)0.69%p.a.
iShares Core Composite BondIAF-11.42%2.73%p.a.(10+ years)0.15%p.a.
ETFS Physical GoldGOLD+7.34%7.75%p.a.(19+ years)0.40%p.a.
The five ETF’s that Stockspot use to build their portfolios (1-yr Performance is to 13Oct 2022) – most of these ETF’s have a $500 minimum if you are investing directly.

It is best to disregard the above 1-yr performance – It has just been a bad year for most assets. The ETF management fees are low (depending on ETF complexity), there is good long term performance (Growth since Inception) and they have selected Physical Gold for inclusion.

Slack Investor does not naturally lean into Gold as it is a speculative, non-income producing asset. However, I might have to change my mind here. The reason Stockspot include Gold in all their portfolios is based upon historical data and the way gold tends to outperform in times of crisis. The results in this last year performance of +7.34% for Gold, speak for itself – as other asset classes flounder.

Mixing it all up

Slack Investor has written about Stockspot before in terms of Robo Advice and their valuable Superannuation reports. By using these 5 ETF’s in various combinations, Stockspot is able to give their customers a combination of returns and risk at a relatively low cost. There are even sustainable versions of each of the below portfolios available. As an example, the moderately conservative Sapphire portfolio is constructed with the following portions.

VAS: 27.2%
IAF: 35.2%
IEM: 14.4%
IOO: 7.9%
GOLD: 14.8%

A chart showing relative risk and return (grey line) of a portfolio varying between 100% Australian Bonds and 100% Australian Shares. The Stockspot portfolios have historically yielded lower returns than 100% Australian Shares) – but only slightly in their most aggressive Topaz portfolio. Overall, through their diversification, the portfolios represent much lower risk.

After fees, over a 5-yr period, Stockspot has outperformed 99% of similar funds over 5 years.

AMETHYST
Conservative
SAPPHIRE
Moderately conservative
TURQUOISE
Balanced
EMERALD
Growth
TOPAZ
High growth
3.1% p.a4.8% p.a5.3% p.a6.1% p.a6.8% p.a
5-yr annual performance (After Fees) – to 30 September 2022 – From Stockspot

There are fees involved for Stockspot to manage your money. For a balance of $200000, they amount to 0.66%. At first blush, these fees (on top of the ETF fees) sound a bit steep to Slack Investor. However, for all types of investors, with a time horizon of at least 3-5 years, for a stress-free place to put your money, this might be exactly what they are looking for. Stockspot do a tailor-made portfolio construction, all the re-balancing of assets and, they take care of all brokerage costs – Not Bad! They even have zero management fees for children accounts up to $10,000 (for under 18s) and the ability to dollar cost average with regular top-ups.

Stockspot does not earn fees from or have a commercial relationship with the ETFs we recommend. We don’t pay professionals for recommending our service to their clients.

Stockspot

Slack Investor can think of lots of situations where people would like a decision-free, low-fee, diverse investment that is designed to grow in the long term. Well done Chris Brycki (and Stockspot), for advancing the investing cause with particular attention to keeping the fees down … you are a Slack Investor Hero.

October 2022 – Mid-Month Update

This image has an empty alt attribute; its file name is trend-1445464__180.jpg

Despite the above discussion, my small-scale market timing experiment continues until its projected end in 2024. My frustration with this experiment continues – as it often goes against one of Slack Investors firm beliefs. If you can avoid it – Do not sell an asset when it is undervalued. Using historical CAPE values, at the end of September 2022, the UK Index (FTSE 100) was 13% below its long term mean, the US Index (S&P 500) was 9% above its long term mean, and the Australian Index (S&P 500) was 7% below its long term mean.

At the end of September 2022, Slack Investor was on SELL ALERT for Australian index shares (ASX 200), the US Index (S&P 500) and the UK Index (FTSE 100). Each of them had broken through their monthly stop loss.

 I have a “soft sell” approach when I gauge that the market is not too overvalued. I generally will not sell against the overall trend but monitor my index funds on a weekly basis once the monthly stop loss has been triggered.

Well … I can see no obvious up-trend at the end of the week for the US and UK markets and will exit at the end of week price of 3583 for the S&P 500 and 6858 for the FTSE 100. I am still just hanging in with the ASX 200 as they had a strong finish to the week.

The Index pages and charts  have been updated for the  UK Index and US Index. 

Keep On Course … and September 2022 – End of Month Update

Randall Reeves encounters a storm in the Indian Ocean in 2017 – Is this what the current stock market turmoil feels like?

Slack Investor loves finding out about remarkable achievements. He came across the inspiring story of Randall Reeves who set himself the task of doing a solo “figure of 8” circumnavigation around the Americas and the Antarctic. This 64 400 km trip encompassed both polar regions and was achieved solo, in the 14m boat “Moli”, in 384 days.

… he (Randall) hit a severe storm in the Indian Ocean. Waves were breaking 200’ (61m) to 300’ (91m) in each direction, and his boat got knocked down so intensely his mast was fully submerged, breaking a window in the pilot house and flooding his electronics.

Extract from The Figure 8 Voyage – Randall Reeves
Randall Reeves during his adventure, after his circuit of the Antarctic and back to Cape Horn for the second time!.

I mention Randall Reeves achievements as he set himself a difficult challenge, that no one had achieved before, and succeeded on his second attempt. All we investors have to do, is pick a course to financial independence – and just keep going. Our boat might suffer a few perils along the way …. but we trust that it is a sound vessel – and it will get us home.

Bear Markets

The 9 MSCI “All Country” World Index Bear markets in the 42 years since 1980 and January 2022 With an overlay in grey of the actual MSCI AC Index. – Vanguard

Downturns aren’t rare events: Typical investors, in all markets, will endure many of them during their lifetime.

Vanguard, 2022

Slack Investor can speak with some experience here, as I have been an investor through all of the above bear markets … and they are never any fun! But, I have learned that … they all pass – and the stock market recovers, and always reaches new highs. The sometimes frustration of just “holding on” to your shares in a falling market must be weighed against the stresses of trying to time the market.

Keep on Course

Slack Investor has had mixed success in his timing the market experiment. The experiment is limited to index funds (Less than 3% of my Portfolio) and will run for another 2 years to make it a 20-year trial.

At the end of September 2022, my Index Timing strategy has outperformed the Australian Index (+1.4% p.a.) and the UK Index(+1.9% p.a.), but underperformed the US Index (-0.3% p.a.). My current feeling is that when considering that “time out of the market” means a loss of dividends, it is not worth the stress and effort and I will probably abandon the experiment in 2024 – after a 20-yr trial. The bulk (97%) of my Investments portfolio is run with the strategy of trying to buy good companies that are growing, tinkering a little, but generally just holding on!

The world MCSI AC Index is dominated by US companies (61.3%). The current 2022 World MCSI ACWI bear market is not shown in the above chart. Also, there is some argument whether the 2020 “Covid Crash” qualifies under the generally accepted definition of a Bear Market – a decline of 20%, or over, that lasts at least 2 months.

We humans naturally feel the need to do something when we see our investments fall in value. Slack Investor does not know if the worst is over, probably not! Slack Investor does know that, if you can avoid it, it is generally not a good idea to get rid of your risk-exposed assets during times of downturns – you are selling your assets cheaply in these times.

Vanguard have (below) kindly extracted the Bull markets (shaded in green) from the Bear markets (shaded in brown) for the MSCI All Country World Index since 1980 prior to January 2022. The Bull’s prevail and these pesky Bear markets will eventually pass – This chart is reassuring.

The Bull (shaded in green) and the Bear markets (shaded in brown) for the MSCI AC World Index since 1980. The gains/losses are expressed in percentage terms. – Vanguard

The World Index (MSCI AC), the S&P 500, the Dow Jones Industrial Average, and the Nasdaq are now in a bear market, and the S&P 500 has closed at a new 2022 low. 

We might not be on a solo circumnavigation through dangerous waters … but the lesson here is to prevail. Tighten the belt if you have to, you have a plan! Endure the situation and try to distract yourself from the stock market with life’s enjoyable things.

The stock markets will do what they always have done, oscillate between over-priced to under-priced. The long-term gains provided by holding shares are well established. If you are still working, your regular saving and investing will be buying lots of shares through dollar-cost-averaging.

If you are retired, in these tough times, you have your stable income pile to help with your living expenses. There will be better times.

September 2022 – End of Month Update

This image has an empty alt attribute; its file name is trend-1445464__180.jpg

Despite the above discussion, my small scale market timing experiment continues. Slack Investor is on SELL ALERT for Australian index shares (ASX 200), the US Index (S&P 500) and the UK Index (FTSE 100).

 I have a “soft sell” approach when I gauge that the market is not too overvalued. I will not sell against the overall trend but monitor my index funds on a weekly basis once the monthly stop loss has been triggered.

All my followed Index funds have fallen below their stop loss values. Big monthly falls for the ASX 200 (-7.3%), S&P 500 (-9.4%), and the FTSE 100 (-4.1)%. Time for some distraction from the market carnage. There will be better times.

All Index pages and charts  have been updated to reflect the monthly changes – ASX IndexUK IndexUS Index. The quarterly updates to the Slack Portfolio have also been recalculated.

Retirement Income

The Art Institute of Chicago

I am hoping that your retirement does not upset as many people as in this James Gillray (1756-1815) painting of “Integrity Retiring From Office”. You can hopefully avoid this by leading a good life and providing yourself with income for this wonderful stage of your life.

There are lots of ways to do this – Slack Investor likes to separate his non-house assets into a Stable Pile and an Investment Pile in his Self Managed Super Fund (SMSF). Most of the commentary on this website has been about the Investment pile as this is the most exciting – and produces the most gains – and lately, the most losses. My Investment pile is volatile as there is greater risk (and opportunity for growth) in this part of the portfolio.

The Stable Pile is mostly to supply me with guaranteed income during the market downturns. Slack Investor’s Stable pile consists of Cash, Term Deposits, An Annuity, Fixed Interest, Real Estate and Bond ETF’s, and some dividend-producing consumer-staple shares.

If the previous financial year has been a good year for investments, my next years annual income requirements can be withdrawn from the investments pile. If you get a bad year for investments, then, I dip into the stable income pile. I try to keep my ratio of Investment Pile to Stable Pile at about 70%:30% and I roughly rebalance at about this time of year (July/August/September).

Using this method, you are always selling from your investments pile when the market is high and buying when the market is low

Slack Investor – A Further look at three pile theory

This method suits Slack Investor, but there are other ways to provide yourself with income in retirement.

Dividends

The well known Australian investor Peter Thornhill, is a great proponent of using dividends to provide retirement income. His MySay articles are well worth a read. Peter maintains that dividends supply an inflation-protected, income that doesn’t vary as much as stock prices do. He supports this strategy by keeping sufficient cash in his superannuation account to fund the next 3 years minimum pension withdrawals (For the Australian superannuation system) – this helps avoid forced selling. The rest of his fund is in Industrials and Listed Investment Companies (e.g. Argo (ARG), Whitefield (WHF)). He has tested his strategy through market cycles and his strategy has been vindicated through the Covid-19 downturn with even some LIC’s using maintained profits to keep dividends going.

Whitefield Ltd is a Listed Investment Company (LIC) that has generally maintained its dividend Per Share (DPS – blue columns) for the past 50 years – even during periods of downturns where the Earnings Per Share (EPS – Red line) of its contributing companies were declining. From Peter Thornhill

Lifetime Annuity Payments

There are many different types of annuity. Annuities have not been very popular in Australia due to their pricing, relative complexity and inflexibility. Challenger has a few of these products available in Australia with rates at September 2022 for a lifetime inflation-protected annuity of $5104 for a 65-yr-old male for every $100000 invested. There are other options for payments that can be either deferred or market linked. Although you can access these annuities directly through their website, the current model that Challenger prefers is access through a financial advisor.

Retirement Income Stream products

Way back in the Australian 2016/17 government budget, Treasury proposed a series of reforms that included removing barriers to innovation in retirement income stream products. This tinkering was brought about by the realisation that the Australian Super model was mostly fit for purpose in the “accumulation” stage – but was lacking in retirement income stream products that address Longevity Risk – the risk of outliving your savings.

Hopefully, with the benefit of compulsory superannuation, most people would have a pile of superannuation money when they retire – and a desire to turn that pile into income (after paying off any debts). Everybody wants to maintain their standard of living in retirement and would prefer something to invest in that would give them the peace of mind of having a guaranteed income stream for life.

At last some new products are staring to emerge from the super funds. Slack Investor was excited to come across the MyPension income stream from Equipsuper. It is a “set-and-forget” investment strategy that nicely mixes a bit of risk assets (to keep your pension fund growing) with more conservative elements (to maintain a more steady income). This fund uses a similar method to the Slack Investor strategy of using “piles” or “buckets”.

To use the Equip MyPension, you would have to roll your existing super into their fund on retirement. Your super is separated into three distinct investment ‘buckets’. The automatic rebalancing of this product would suit those who want to be a bit more “hands off”.

Equip MyPension option for maintaining a retirement income stream.
  • Cash – For regular income payments, usually comprised of three years income  – about 20% of investment.
  • Conservative – Investments in low risk categories including cash and bonds  – about 40% of investment.
  • Growth – Investments to grow your savings, subject to short term fluctuations – about 40% of investment.

The clever thing is how these buckets work together over time. When investment markets are good, any earnings in the conservative and growth buckets go into the cash bucket, locking in your gains (Automatically). If markets experience a downturn, we’ll leave any buckets that lose value untouched at the end of year, to allow them to recoup losses in future years.

EquipSuper MyPension

Slack investor has just two piles for his retirement – the Stable Income pile (Cash and Conservative) option and an Investments pile- and I do my own annual rebalancing. My investment pile is a bit more aggressive than the EquipSuper offering – more volatile, but Slack Investor likes to meddle and, is developing a “strong stomach”.

Vanguard 2022 Annual Long term Investing chart  and … August 2022 – End of Month Update

Extract from the 2022 Vanguard Index chart (Just the 2008-2022 portion) – the dollar values on the right are the results of investing $10000 in index funds in each asset class for 30 years (since July 1992). – Check out the full glory of the Vanguard 2022.PDF chart – Click for better resolution.

The lessons of long term investing

Every year Vanguard publish their performance data on each asset class. Slack Investor looks forward to this – as it demonstrates the powerful compounding that happens when the appreciating asset classes of Shares and Property are held for a long time (30 years). Although this Vanguard collection of data shows the volatility of asset values in the short term – it also also emphasizes the joys of holding and accumulating shares or property for long periods of time. These asset classes have steadily increased in value over the last 30 years. $10000 invested in Australian Shares in 1992 would have compounded to $131 413 in 2022, US Shares would have compounded to $182,376. Staying in Cash would have yielded $35 758.

Slack Investor says download and study this chart … and work towards getting some appreciating assets … accumulate, then hang on!

Financial year total returns (%) for the major asset classes

In the Vanguard 2022 table below, for each asset class the total annual returns are given and the best performing class for each year is shaded in blue … and the worst in pink. What stands out to Slack Investor is that is rare for and asset class to lead in annual returns (blue) for two years in a row – and there are years where the leading asset class (blue) becomes the worst performer (pink) in the next year. This drives home the often repeated sentence in the finance world.

Past performance is not a guarantee of future resultsbut 30 years of data talks loudly to Slack Investor.

Total returns for each asset class for the 30 years since 1992 – Check out the full glory of the Vanguard 2022.PDF – Click for better resolution.

This table highlights the benefits of diversification across asset classes for the long term investor. Each asset class might be the best performing (Blue shading), or the worst performing (Pink shading) for the year – and might dominate (or languish) for up to two years in a row. However, often a worst performing asset will show up as the best performing asset in the very next year – or vice versa.

Slack Investor is accepting of the negative returns for FY 2022 for most of the asset classes – and is concentrating on the 30-yr average long-term annual returns for holding shares and property of over 9% p.a.

When averaged over 30 years, the asset class and annual returns are : For AUST. SHARES 9.8%; INT’L SHARES 9.1%; U.S. SHARES 11.7%; LISTED PROPERTY 9.3%; and INT’L LISTED PROPERTY 10.7%; This compares with the average cash return of 4.4% p.a.

Slack Investor knows where he wants to be.

August 2022 – End of Month Update

Slack Investor remains IN for Australian index shares, the US Index S&P 500 and the FTSE 100.

Inflation fears seemed to have spooked the overseas markets (S&P 500 -4.2 %, and the FTSE 100 -1.9%). The Australian stock market ended up pretty flat this month (ASX 200 +0 6%).

All Index pages and charts have been updated to reflect the monthly changes – (ASX IndexUK IndexUS Index).