The Times They Are A-Changin’

Bob Dylan   Archival Promo Photo

And you better start swimmin’

Or you’ll sink like a stone

For the times they are a-changin’

The Times They Are A-Changin’ – Bob Dylan

That old troubadour Bob Dylan released this back in 1964 …on vinyl … I might add! Bob’s lyrics were written almost 60 years ago about the cultural and political divide that existed way back in the early 1960’s. His message to “start swimmin’ or you’ll sink like a stone” continues to have relevance – even to investors.

Music has been an important part of Slack Investor’s life and starting with my first “record” vinyl purchase in high school, I then went through the cassette phase. Cassettes were always a bit dodgy, but they did have their moments – who can forget the sublime “mix tape” given to you by a friend. The gradual degradation of cassette musical quality as they lost their magnetism and, the ultimate tragedy when your precious “mix tape” starts unravelling in the car. All this made me glad when CD’s were introduced in 1982. Aaahh … the beautiful world of the CD – Digital quality and a format that I thought would live forever. Only in hindsight do we see that “Peak CD” was in 1999 and this was also the peak of recorded music revenue for artists. I could look at the below chart for hours.
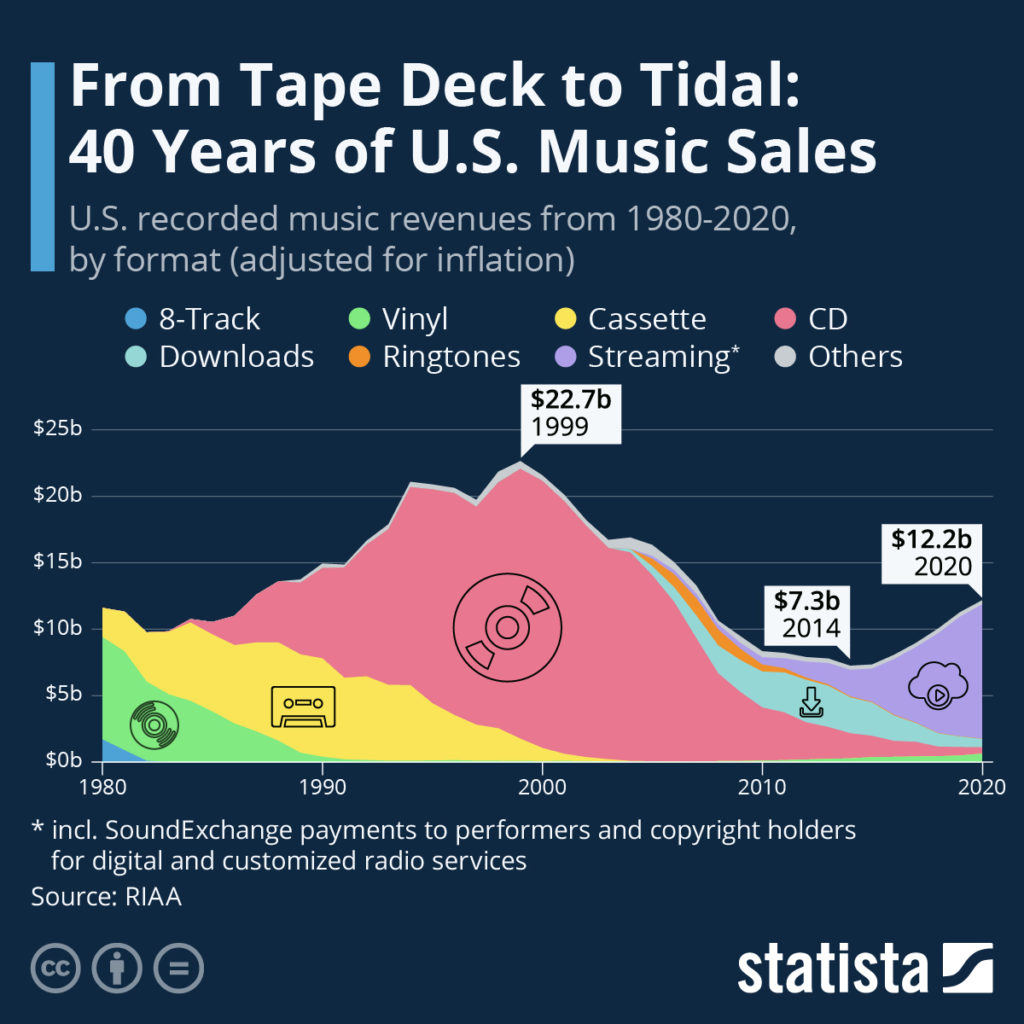
The changing shape of revenues from recorded music delivery 1980 – 2020. – This incredible graphic is from Statista

Despite the recent uptick in vinyl sales, it seems obvious that the days of owning music are numbered. It is also sad to note that revenues from recorded music in 2014 sank to a third of those in 1999. Revenues are on the increase but royalties from streaming remain pitifully low and artists can be paid as little as 13% of the streaming income generated. The recording artists must resort to touring and merchandising to provide the bulk of their income. The highest grossing act of 2017 was U2. According to Billboard – their streaming income was only just over 1% of their total revenue of 54.4 million USD.

Spotify generally pays between $US.003 and $US.005 per stream, meaning you’ll need about 250 streams to make a dollar.

Business Insider Australia

In an unbelievable turn of events for all “Boomers”, streaming is now the way to access recorded music and now accounts for 83 percent of music industry revenues in the U.S. Physical CD’s and even music downloads are in major decline.
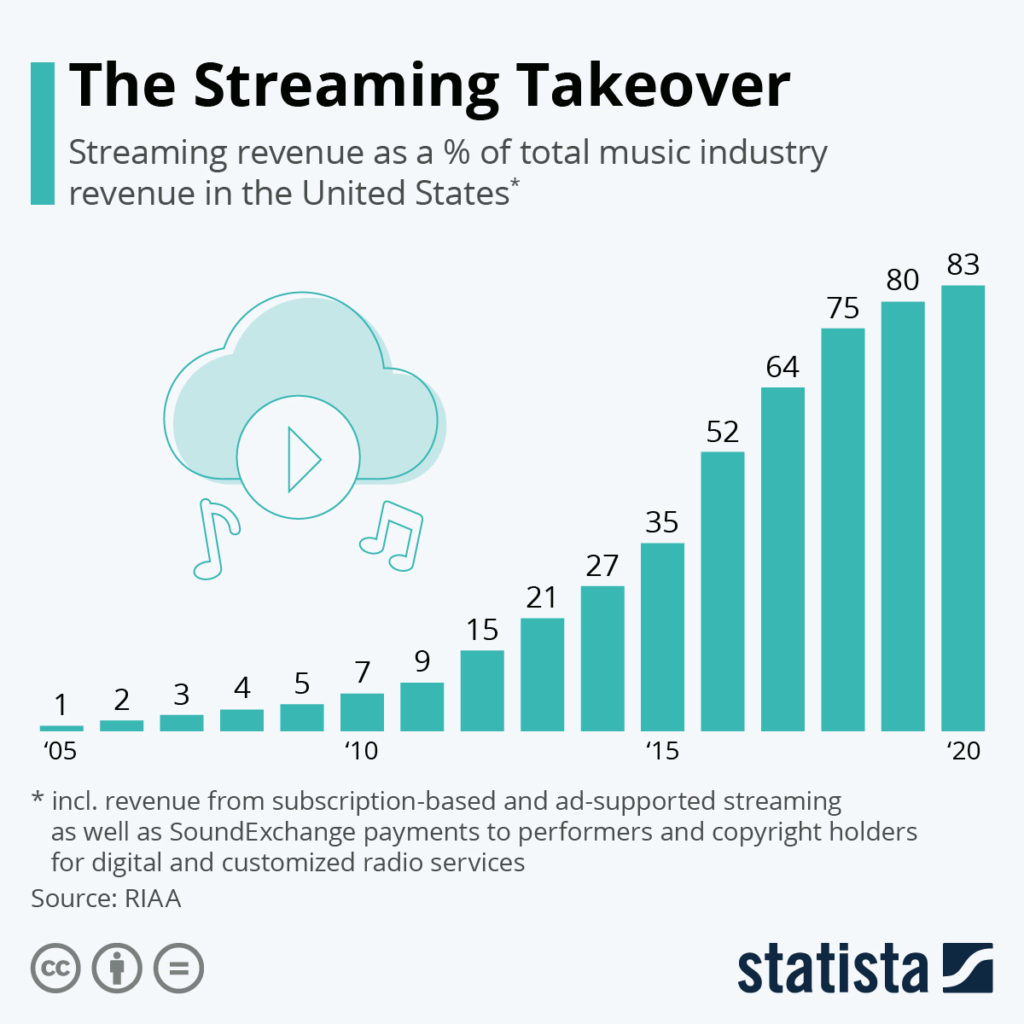
Streaming revenue percentage from 2005 till 2020 – Another great chart from Statista.

Music Delivery Change … and Investing

All of that music stuff was just to provide an example about how unexpected change can happen in just a few decades. Slack Investor had built up an impressive CD collection over the past 30 years and, he thought he was set up for life. This collection is now in a box as I now tend to now use digital versions for my musical pleasures. To the great dismay of my children, I am still hanging on to ownership of my music – they tell me this is typical “boomer” behaviour and are urging me to get on board the streaming train.

We always overestimate the change that will occur in the next two years and underestimate the change that will occur in the next ten. Don’t let yourself be lulled into inaction.

Bill Gates

Bill has pointed to a bit of a weakness in the vision of investors … and Slack Investor obviously cherishes his moments of inaction – but will act if he has to. He has already made a few tweaks in his portfolio

I have been thinking of relatively safe investments lately … and this is tricky in these weird times as, besides precious metals, it is difficult to name a sector that would be unaffected by an inevitable downturn in the markets. Will bricks and mortar retail be the same? Will CBD office real estate be the same? Will banks be the same with the new competition from Neobanks?

With the exception of consumer staples, safety may not be found in traditional industries. Technology is such a large part of our lives now – and this is where growth will happen. I keep returning to the utility of an Index like the NASDAQ 100. It has the beautiful self correcting mechanism where dud technologies get shuffled out of the bottom of the index and the companies that are still making money tend to stay in.
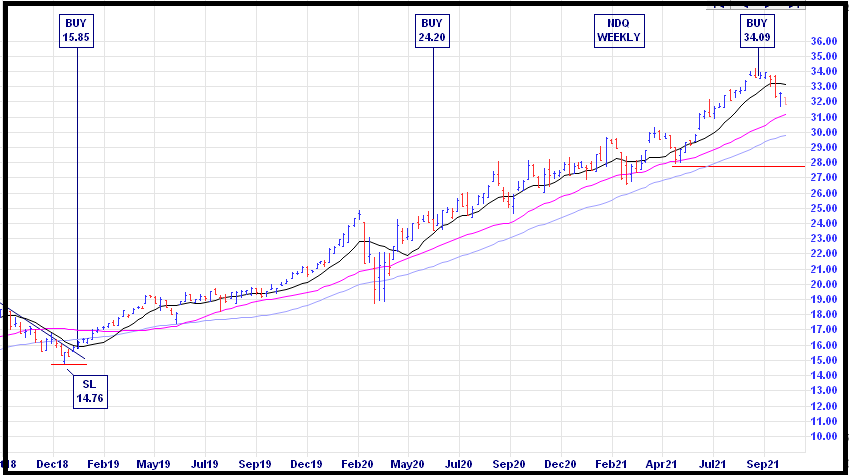
Weekly chart of the Betashares NASDAQ 100 ETF (NDQ) showing 2 1/2 years of solid growth – From IncredibleCharts.com

I have been a buyer of this ETF along the way and a recent dip in price (perhaps due to the recent Facebook revelations) point to an increasing mood for more regulation in some of the tech stocks. Barrons have the current PE at 34.5 which does not make it cheap but the PE based upon the forward 12-mth earnings forecast is a bit more reasonable for the growth sector at 28.0. In this changing world, the one thing that you can bank on is that the technology industry will be an important part of it. Not advice … but I think I will buy some more.

Don’t stand in the doorway

Don’t block up the hall

For he that gets hurt

Will be he who has stalled

The Times They Are A-Changin’ – Bob Dylan

The Slack Buying Process … and August 2021 – End of Month Update

The moneychanger and his wife, by Marinus van Reymerswaele, 1538, Public Domain, via Wikimedia Commons

As much as Slack Investor hates retail shopping – he loves to have the opportunity to buy into companies. Like any new relationship, when you buy a stock, you are not really sure about how its going to work out – but its exciting!

I have never been good at predicting when the stock market will have a correction … and the current high valuations (PE Ratios well above the long term average) do make me nervous. However, Slack Investor would much rather be in the game than out of it and I have been looking for a few companies that would hopefully not suffer too greatly if a correction occurred in the stock market.

This is not advice … just an insight to the Slack Investor bumbling buying process. My rate of converting bought shares into winners of 55% is not that impressive – but my overall performance results are good.

I get heaps of buying ideas from investment sites such as Motley Fool, Livewire, ShareCafe. But I will always, always, check things out for myself before parting with any Slack Dollars. This involves a rigorous screening of the fundamental financial metrics PLUS a look at how the stock chart is going on Incredible Charts. This technical analysis consists of a quick scan to see if the chart is in a continual growth trend … or has just had a “breakout”, or broken out of a downtrend.

Let’s put on the buying boots. As well as the companies below, Slack Investor has also recently added to some small positions in PPK.ASX and TNE.ASX.

Slack Investor Buys Alphabet (GOOGL.NASDAQ)

Half of my buying cash went into an existing holding – Alphabet (GOOGL), This money making juggernaut is part of the new economy and I could buy this company all day. The first step is to go to the phenomenal MarketScreener.com. Registration is free on this site and they allow you to look at analyst data for up to 5 stocks a day.

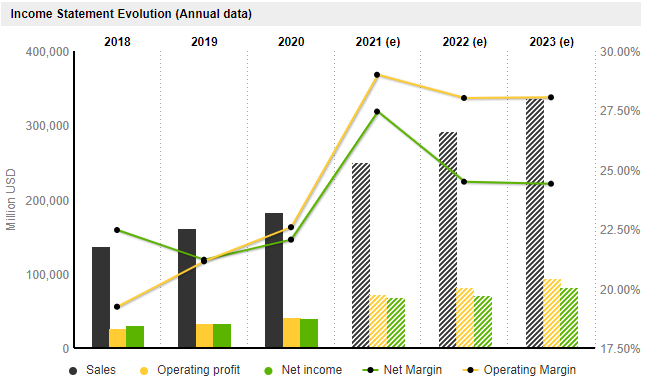
Search for your stock and then finding the Financials Tab for that company. Firstly, I look at the chart Income/Sales and Earnings per Share. An increasing trend is good and, if the estimated earnings (2021 – 2023) are also increasing, I’m acutely interested. I do a quick check on debt levels. Alphabet is a cash king – has more cash than debt – solid tick.

Income statement for Alphabet (GOOGL on the US NASDAQ exchange) – from MarketScreener

I continue with MarketScreener to extract the Return on Equity (ROE), both past and forecast. I hope that it is above 15% – Big Tick. The final bit of vital information is the Price Earnings (PE) Ratio and it is here that I gauge whether the stock price is too high for Slack Investor. For a good growth stock, I try not to buy into companies that have a projected PE of more than 40-(50 at a pinch). The analyst estimates for GOOGL is a forecast PE of 23.0 in 2023 – Tick

YEAR2018201920202021(e)2022(e)2023(e)
ROE18.619.319.027.225.825.2
PE Ratio23.927.229.928.026.623.0
Table of fundamental financial metrics for Alphabet. The documented Return on Equity (ROE) and Price Earnings (PE) Ratio are shown for 2018-2020. Analyst estimates are shown for later years – MarketScreener.com

Slack Investor Buys NASDAQ 100 ETF (NDQ.ASX)

Not everyone has access to direct access to US shares – if you only have an ASX broker, then to get exposure to Alphabet, a good substitute is to buy the BetaShares NASDAQ ETF (NDQ) – Alphabet represents 8.1% of this ETF – and you get profit machines like Apple, Amazon, Microsoft and Facebook thrown in. I topped up my holding here as well.

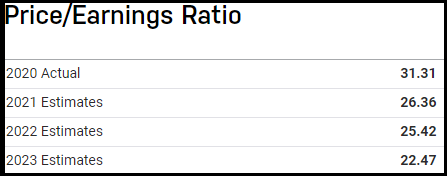
The ROE for the NASDAQ Index is 17.7 and increasing (30 June 21) – Above 15, Tick. The projected 2023 estimate for the Price/Earnings Ratio for the NASDAQ Index is 22.47 – Below 40, Tick – Very reasonable for growth sector companies.

NASDAQ 100 Index 2020 PE Ratios and Forward Estimates of PE for 2021, 2022. 2023 – From nasdaq.com

Slack Investor Buys Coles Group (COL.ASX)

YEAR201920202021(e)2022(e)2023(e)2024(e)
ROE29.832.837.034.933.334.3
PE Ratio12.422.922.423.422.821.4
Table of Fundamental metrics for Coles Group . The documented Return on Equity (ROE) and Price Earnings (PE) Ratio are shown for 2019-2020. Analyst estimates are shown for later years MarketScreener.com

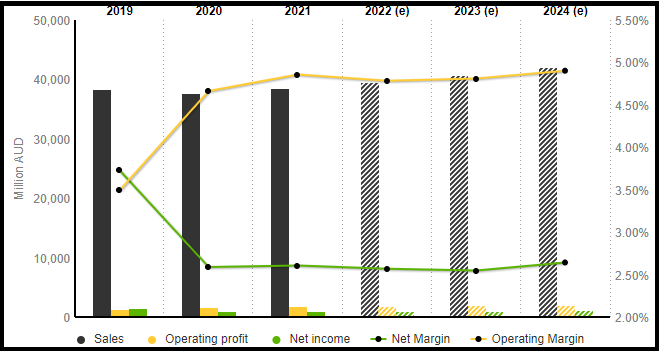
The Return on Equity (ROE) for this retail business is pretty impressive and, the PE Ratio would be pretty good for a growth company – but the Income Chart below reveals that Coles is not really a “growth” company – so the expectation is that the PE Ratios should be much lower, in the early 20’s or below would be the Slack Limits for slow growth companies.

Income statement for Coles Group (COL.ASX) showing a very gradual increase in projected income – Compare this with the Alphabet chart above – from MarketScreener

The income chart shows some pretty shallow growth and the slow earnings per share (EPS) growth makes the Coles Group something that Slack Investor would not usually be interested in. But, I go to Coles Supermarket at least twice a week and I actually like going there as a company part owner. Coles is in the “stable income” section of the Slack Portfolio rather than “Growth”. Even if the worst of times was thrust upon us and there was a recession in the next few years, a business like Coles will keep on performing. I would much rather put up with the price fluctuation of shares and have my money in a business like this at a projected yield of 3.5 – 4% p.a. than have Slack Dollars tied up in cash for 2 years in a Big 4 bank term deposit at 0.3%.

August 2021 – End of Month Update

Slack Investor remains IN for Australian index shares, the US Index S&P 500 and the FTSE 100.

There were significant rises in all followed markets (S&P 500 +2.9%, and the FTSE 100 +1.2%). The Australian stock market is also in record territory (ASX 200 +1. 9%). This is all happening during extensive COVID-19 related lockdowns in the populous South Eastern part of Australia.

Slack Investor is normally relaxed about most things, but I am moving to the edge of my couch and starting to get ready for action. Looking at the monthly charts for all the indexes, in these boom times, the index prices have been getting too far ahead of my stop losses for comfort. I have tightened up my rules for adjusting stop losses upwards.

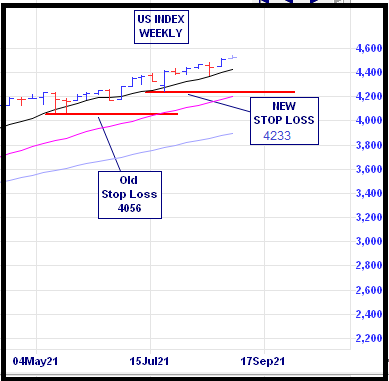
All Stop Losses are live and are being moved upwards every month if the index price exceeds the stop loss by 10% or more. All Indexes have got this treatment this month – It is sometimes difficult to work out where to put the stop losses on the monthly chart. I usually go to the weekly charts and find a minimum on the weekly price range that is within 10% of the current price (see below). If the stock price is below the stop loss at the end of the week – I will usually sell at the next opportunity.

The weekly US S&P 500 Index chart showing an upward adjustment of the stop loss from 4056 to 4233 – Thanks Incredible Charts

All Index pages and charts have been updated to reflect the monthly changes – (ASX IndexUK IndexUS Index).

July 2021 – 5 Years of Slack Investor

Extract from Rembrandt van Rijn “Self-Portrait, 1659” – From the Museo Collection. Enjoy the full image at the National Gallery of Art, Washington

“Rembrandt … says things for which there are no words in any language.”

Vincent Van Gogh

Slack Investor doesn’t put himself in the class of Rembrandt but he admires the honesty of this self portrait at age 53. It is time well spent to look a little further into his amazing catalogue.

Rembrandt, despite incredible talent and artistic output, was known to have lived beyond his means and, he sadly died in 1669 at age 63 as a poor man. He was known to have done over 40 self portraits in his life. Perhaps after 5 years of Slack Investor, it is also a time for self reflection.

Slack Investor doesn’t possess any great financial skills. My financial talents pale in significance with the great investors. I didn’t go to a private school but my government school was one of the better ones and I scraped into a science degree at university. My Physics and Maths marks didn’t put me on the honour board – but I passed. One thing I am grateful for is that my parents instilled a desire to make the most of any opportunities that life presents. Skills that I do have are a willingness to learn and the “stubborness” to complete a task.

Although Slack Investor has been very fortunate in his life with opportunities to travel and work in many interesting countries in his twenties. My own financial story is not really one to emulate. I had a delayed journey to financial independence by returning to Australia at 29 broke, no superannuation, and owing money. My limited skill set was lucky to include the ability to learn from others and to be single minded in pursuit of a goal – that was, to be financially secure.

My journey was greatly helped by going to an investing class by Robbie Fuller, He had selflessly contributed his investing knowledge to a U3A class in Townsville for over 20 years and also ran an evening class for investors. I learned a lot from Robbie. He showed me how to look at a companies sales, debt levels, future earnings and potential growth and to try and assess its real value (fundamental investing). He also opened up the world of charting to me. Looking at a price chart of a company – trends, breakouts and stop losses (technical investing) – and I am grateful. A basic knowledge of the fundamental and technical aspects of investing is so important – and not many people have this knowledge.

However, not everyone can have a convenient investment class in their town. I originally started this blog as a means to show those interested in investing that, by gaining a few skills, you can become a better investor and manage your own financial affairs at a minimum cost – knowledge is power.

Never depend on a single income. Make Investments to create a second source.

Warren Buffet

Slack Investor hopes to keep going. I am sure that Rembrandt had a good life -an enormous creative talent, a love for his wife Saskia, other relationships after his wife’s sad death, a son and a daughter. However, Rembrandt earned much, and he lost much. He was forced to sell his house and most of his art collection for a pittance to avoid bankruptcy in the late 1650’s. A bit of financial self reflection is often required if you want to achieve financial independence – Take control.

Slack Investor’s Favourite Charts

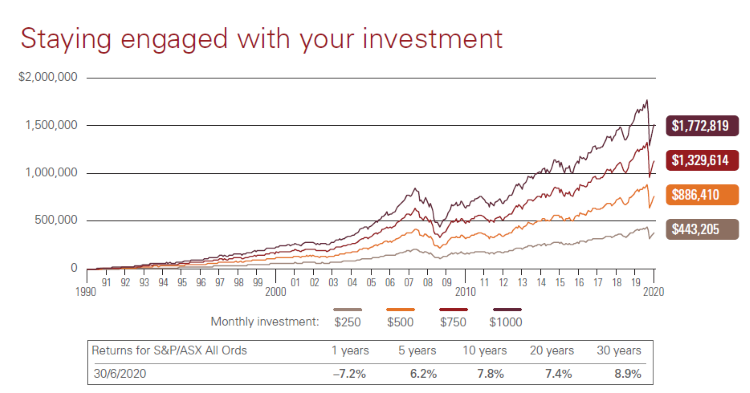
There are lots of great charts on the web. I look forward the release of the Vanguard Index chart every year – and this will be the subject of another post when they release the 2021 chart. However, the chart below drives home the benefits of consistent investing over time – and I like that.

Returns on an Australian Index fund 1990 – 2020 – Vanguard Australia – click for better resolution.

This chart shows the beautiful connection of constant investing and time. Over 30 years since 1990, the chart shows the 2008 GFC crash and last year’s Covid-19 crash. Despite these major downturns. given time, their is always a recovery. An investor who starts with nothing but invests in a US index fund by contributing $250 per month would have compounded $443 205 by the end of 2020. If the investor had increased the monthly contribution to $1000, then the rewards would be $1 772 819.

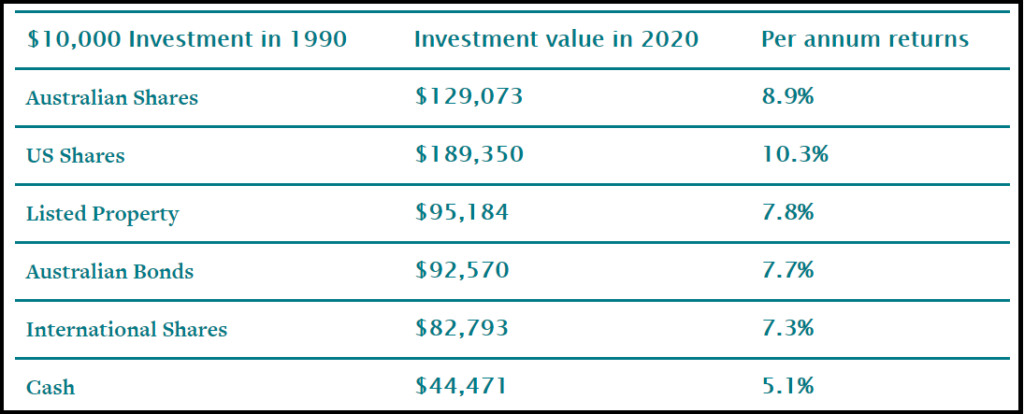
Another way of showing the benefits of time and compounding investing is to look at the average returns on a single investment of $10 000 in various asset classes over 30 years.

Returns on $10 000 after 30 years of Investing in various asset classes 1990-2020 – Vanguard Chart found at Canstar.com.au

3 Most Popular Slack Investor Posts

Ride your own bike

Retirement sweet spot

Chance would be a fine thing

A Further look at three pile theory … and May 2021 – End of Month Update

Slack Investor presented his version of a bucket strategy – The “Three Pile Theory”. It is the three pillars of a House, Stable Income, and Investments that have supported me through most of my working life and now the three piles are still supporting me in early retirement.

These piles have been continually interacting with each other as I was trying to build them all up. At the start, the Prince of all piles was a good income and, as I have very poor entrepreneurial skills, the key for me to get a good income was to have a good education. I was lucky enough to have parents that encouraged me to go as far as my wit would take me.

Without education you’re not going anywhere in this world

Malcolm X

When originally talking about three pile theory, I glossed over the retirement phase and how the investment and stable income piles can keep you going … hopefully, for a long time. By retirement, if possible your house will be paid off – and this will be left as a dormant house pile which keeps giving back in lots of ways … but only as a last resort will you use it to fund your lifestyle in retirement!

Lets do the sums on just two piles – Your Retirement Fund

Consider a retirement fund with just two piles – Stable Income and Investments. In order to generate 4% of income per year, you need have most of your retirement fund in investments rather than stable income. According to his two pile theory, Rob Berger from Forbes Magazine recommends that you should have between 50% and 75% of the retirement fund in the investments pile 0f equities (stocks). Decide on a ratio of stable income to investments that you can sleep well with – a higher amount investments will mean potentially more growth … but definitely more volatility.

A bit of mathematics here … my original ratio of house:stable income:investments was 30%:20%:50%f Net Worth. When taking my house out of the calculations, my ratio of Stable Income: Investments is about 30%:70% – this is just the numbers that I am comfortable with.

My original plan was to use dividends and interest from the two piles of my retirement fund to give me income. That means taking out money from both piles every year – even when stock markets have fallen. Rob Bergen points out that this is exactly the wrong approach. Taking dividends out reduces the investments pile – it has the same effect on your investments pile as if you sold some of your stocks. In a down-trending stock market, for your long-term investments pile, you want to use those dividends to reinvest in a stock market that is undervalued.

(Using the traditional bucket strategy), assets are taken from (Investments) when market prices have fallen, which is exactly when dividends should be reinvested.

Rob Berger – outlining the folly of taking money out of your Investments account when the market is falling.

How to make your piles last in retirement phase – Rebalancing the Retirement Fund

This heading has Slack Investor lapsing into what my mother called “Plumber’s Humour”. Using the Rob Berger simple strategy, you maintain your piles. Even though you have the competing interests of wanting to withdraw annual amounts for a great lifestyle, and yet, keeping enough in your retirement fund to generate future income for many many years. There are lots of articles on buckets to fund your retirement but, it can get complicated – I really like the clarity of Rob Berger’s approach. He explains in detail how the traditional bucket strategy is flawed.

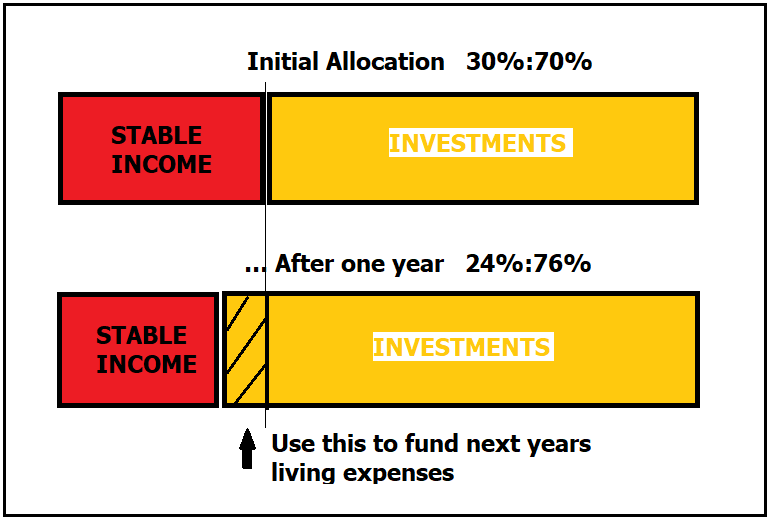
By the time you retire, you will have a good idea of your expenses, While you are healthy and fit, add a good chunk of income to fund some travel. At the start of the financial year, this amount gets withdrawn to your cash account to fund yearly living expenses. The remainder is your retirement fund comprising of Stable Income pile (Annuities/Bonds/Term Deposits/Fixed Interest) and Investments pile. Slack Investor is happy with 70% of his Retirement Fund in Investments (Equities/Stocks).

Set up a ratio of Stable income: Investments in Your Retirement Fund that you are happy with and take your annual expenses out of the pile that is over allocated at the end of the year. In the above case, Investments.

In a good year for investments (outlined above) your next years annual income requirements can be withdrawn from the investments pile. If you get a bad year for investments, then dip into the stable income pile. Take out enough from each pile so that after your yearly expenses withdrawal, the initial allocations are roughly intact – I should do some algebra here to make this easier … but you can do it for your homework!

Using this method, you are always selling from your investments pile when the market is high and buying when the market is low – masterful investing, Warren Buffet would approve!

May 2021 – End of Month Update

Slack Investor remains IN for Australian index shares, the US Index S&P 500 and the FTSE 100.

There were modest rises in all followed overseas markets (S&P 500 +0.6%, and the FTSE 100 +0.8%). The Australian stock market is powering on (ASX 200 +1. 9%) despite Slack Investor and the state of Victoria being in a (hopefully only one week!) COVID inspired lock down. All Index pages and charts have been updated to reflect the monthly changes – (ASX IndexUK IndexUS Index).

Always Watching

Photograph: Elle Hunt/The Observer

Slack Investor is not known for his fast work … and have often taken the couch when action was probably needed. There are some stocks that I will hold for the long run, and their weekly charts are not of big concern to me. However, about half of my portfolio is on a weekly watch – I review the charts on a weekend and cast the Slack Investor jaundiced gaze over each stock that I own (Thanks Incredible Charts!)

“You can observe a lot by watching”

Yogi Berra – American Baseball Legend and Master of Tautology

I do have some routines though …

Daily

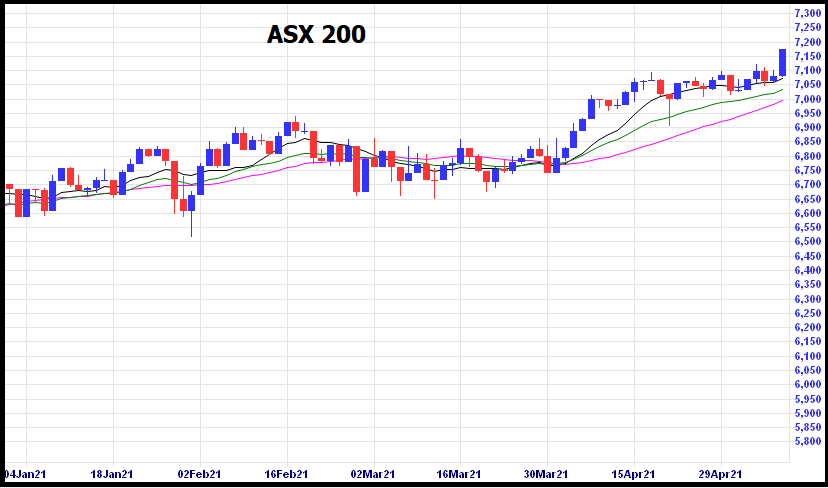
This is the least satisfying timescale and, if I could successfully train myself to ignore this daily oscillation of my investments – I would. The reason to avoid daily swings of the share price is that I have absolutely no idea about whether the price of a stock or index will go up or down on the next day – the share price is determined by others! In the chart below, in the first 7 days shown, the daily index went down, down, up, down, down, up, up, etc – monitoring daily prices can be frustrating!

ASX 200 Daily “Candlestick Chart” showing 6 months of index values since January 1 ,2021. The Red candles show a day when the value went down, and the Blue candles indicate a day when the index price went up.

I have to admit that I follow my investments every few days through a portfolio in Yahoo Finance and will download prices to my accounting software – the free Microsoft Money Sunset International Edition available at the most excellent Ameridan’s Blog. I download share prices into Microsoft Money with MS Money Quotes with a 10 USD lifetime licence. In the USA, Personal Capital is  recommended. 

I am happy to say that, when on holiday, or busy, I have no need to monitor on the daily timescale. Regardless, no decisions are made on this daily basis.

Weekly

Weekly is where the “rubber hits the road” for Slack Investor – and I look forward to my weekly sessions with my portfolio. I set aside an hour on the weekend to make sure my portfolio prices are updated and the charts are reviewed. The weekly time scale smooths out a bit of the volatility and I then open up Incredible Charts to scroll through my portfolio.

Incredible charts offer a free month sign up and then $9.95 per month for access to worldwide updated delayed charts daily from 6pm Australian time. This package is not in “real time” and does not suit a day trader. But for an investor on my slower time scale, it is very good value. These charts open up the whole world of technical analysis as it allows you to monitor trends in your stocks and mark in trend lines and stop losses.

I have always used the weekly charts to make decisions on buying a company – looking for a momentum shift in the trading using the Directional Movement System. I also like to trade a “breakout”, or a “wedgie”

Monthly

This is the timescale when I am most happiest and would like to make decisions just every month. After a life of work where decisions were a constant grind – It is a gift not to make decisions!

It is still my aim to make selling decisions monthly – but things seem a little precarious lately and, for now, I am on a weekly decisions cycle for selling. The sell happens when a stock price finishes below my stop loss at the end of the week/month (see Technical Sell below).

Yearly

This is the “Look at yourself in the mirror” period where Slack Investor does the evaluation of his portfolio performance against benchmarks at the end of each financial year. Although the financial year ends at June 30, it usually takes until the middle of August for me to get my final results and benchmarks together. I present my results at the annual Financial Year Results post.

Special Occasions Selling

Slack Investor is in one of those right now and he has to free up some cash to by selling some shares. I like to do things a bit methodically and here is my process for a sell.

Technical Sell

This is my first port of call. Technical Analysis uses charts and trends and I have been watching the charts for the past 4 weeks for a technical sell signal in my portfolio. For me, this happens when the stock price falls below the pre-determined stop loss that I have set. I will then try to sell at the start of the next week/month. My rules are not rigid here, if the stock starts to rebound after I have made my sell decision, I might stick with it for a little while longer.

Another technical signal is when a stock loses its momentum – but this is a more subjective signal than when a stock simply moves below a line.

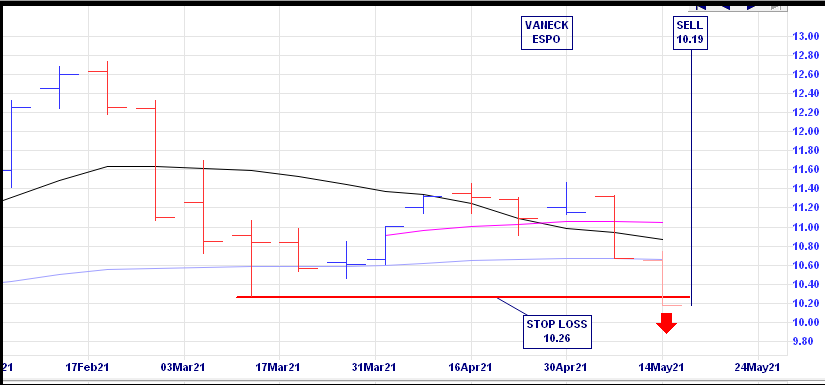
Slack Investor bought into ESPO in October 2020 at $10.39 and sold this week at a small loss $10.19. The stock didn’t grow like I thought it would – but that’s fine. I like the concept of this ETF but I am happy to be out for now and look forward to be getting back in when a strong upward trend establishes itself.

I was also able to exit on a technical sell for the Betashares ASIA ETF and I am not sure what is going on here as I thought the tailwinds for this sector were good. Small profit this time and will get back in if the trend changes.

Weekly chart for the VanEck ESPO ETF showing a breach of the stop loss – Incredible Charts.

Fundamental Sell

Fundamental Analysis revolves around trying to determine the real value of a stock by looking at its financial data (e.g, Price/Earnings ratio, Return on Equity, Debt, etc) over time and, in reference to its competitors. This is a much more complicated process.

If Slack Investor can’t find a technical sell, I look for a fundamental sign. I will list all of my sellable stocks (Shares that I don’t hold for “the long run“). The first step is to get some financial data on each company from the very good Market Screener then put them in a table and hope that something stands out as a sell. A sell signal might be a trend of falling earnings, increasing debt, or decreasing Return on Equity (ROE). I also get nervous about a stock if its predicted (+ 2 years) Price Earnings (PE) ratio goes over 50. Fortunately, I didn’t have to resort to any fundamental analysis this this time … and this approach probably needs a post in itself.

In the meantime, like my pumpkin friend … always watching …

Two Very Important Numbers

There are many numbers to note in finance world – Fees, Investment returns, etc. However, there are two extremely important numbers when it comes to financial independence. Both are percentages and the first one is the 4% “rule of thumb” and the second is your savings rate.

The 4% Rule

All followers of finance blogs would have heard of this often quoted “rule” Slack Investor acknowledges that this magic number is arguable and depends on individual circumstances but, it is an excellent way to estimate how much you will need to retire. The 4% rule is a way to “roughly” link assets with income. For example, as an estimate, if you would like to generate a $40 000 yearly income, you would need to have investments assets of $1 000 000 to earn this income using the 4% rule (4% of $1 000 000 = $40 000).

Another way of looking at this 4% rule is that you need to save 25 x your annual spending for your retirement fund so it can generate an income to cover your spending. So, if you spend $30 000 a year, you need a portfolio of $750 000 (25 x $30 000). To get an idea about what your expenses are it is important that you track them over a year using a spreadsheet or finance software. If necessary, this investment income can always be supplemented by a government pension or a part-time job.

Bill Bengen originally came up with this “4% safe withdrawal rate” in 1994. He developed it by backtesting a conservative US portfolio with data dating back to 1920 and tried to get a safe withdrawal rate that would generate an income for at least 30 years. He is the first to admit that the 4% number was always treated too simplistically and has since updated the rate to be closer to 4.5%.

Slack Investor is a bit old fashioned in liking to hold on to most of the capital that is earning the money and has a flexible approach to how much to extract from investments each year. In a good year for the stock markets, I am happy to dig deep into the investments pile – using dividends, distributions and even some capital gains as income. When the market performs poorly, it is more complicated and I have to dip into my stable income pile. Most of the Slack fund is in Australian Investments and in 2021, the Australian Index has a 12-month forward dividend yield of 3.5% . Hopefully, the shares will also increase in value over time. Over the past 10 years, Australian shares had a total return of almost 7% – with growth shares you can aim higher, but prepare for volatility. In the good years, I will also take out a bit of capital gain for extra spending. All of this is in addition to the stable income component of my investments.

Your Savings Rate

“Wealth consists not in having great possessions but in having few wants.”

Epicetus

Using the 4% rule we estimate how much will give us a sustainable retirement. But there is another number to add to our arsenal.

Just as in Lord of the Rings there is ” one ring to rule them all…”, there is also one “percentage” to rule them all in the Financial Independence world – and that is the Savings Rate percentage.

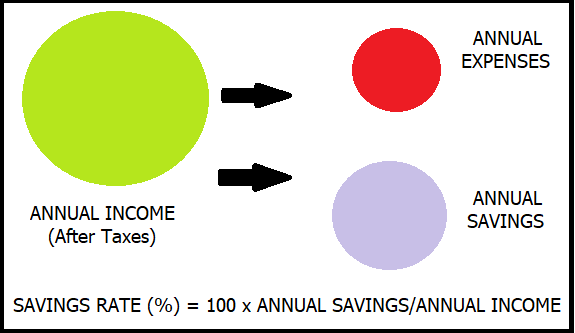
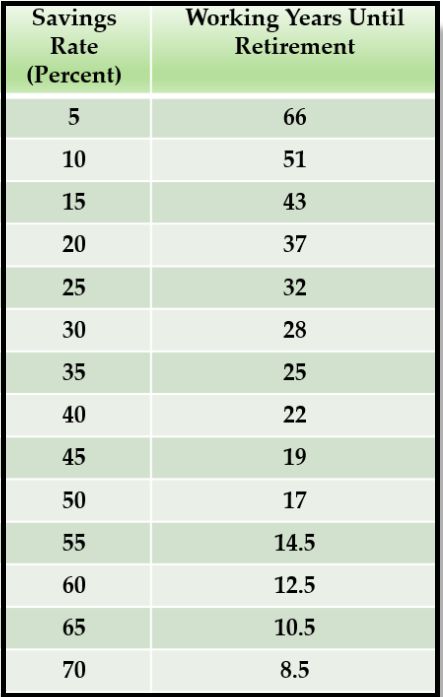
The annual expenses is critical here as this is the figure you are trying to generate out of investment income. Lets have a look at the effect that savings rate has on the number of years that you have to work until you can sustainably generate your expenses from your investments. The table below is from the great financial blogger Mr Money Mustache. There are a few assumptions used to generate this table

Here’s how many years you will have to work for a range of possible savings rates, starting from a net worth of zero:

At a saving rate of 10% you will have to work for over 50 years – we have to do better than that! There are some pretty heroic savings rates amongst financial bloggers e.g Aussie Firebug 61%; Dividends Down Under 61%; I have admiration for these savings rates and note that these bloggers are in a hurry to get to financial independence – and retire early. At 60% savings you can retire after 12.5 years of working and saving – but that sounds pretty hard.

Slack Investor was on a much slower train and lucky that he quite enjoyed his job – and didn’t mind spending 30 years saving for his retirement. I have always been a good saver but, when looking at my past savings rates, it was usually around the 30-40% level and, some years had dropped down to 20%. Raising a family and holidays are a delightful interference with savings and you just have to find a balance. In Australia, we have compulsory superannuation which currently adds a welcome 9.5 % to your savings rate.

A beautifully presented calculator at Networthify shows how the savings rate works and gives a yearly breakdown. It also shows some interesting OECD statistics for average National savings rates (e.g. The US 6%, and India 32%). The aim is to eventually save enough money to invest in a way that you average (at least) 5% return on your investments after infation. If you withdraw from this retirement pool at the rate of 4% and have enough to cover 100% of your expenses – you become financially independent – the retirement pool keeps on giving!

Automate your savings

One of the best financial habits that I formed was to take the thinking out of saving and set up automatic recurring transfers from my work money to my savings or investment accounts – Pay Yourself First. I also took full advantage of “concessional contributions” to my super account which were taxed at 15% rather than my then marginal rate of 37%.

So, automate your savings. Investment returns are important and we hope that we can exceed the 5% after inflation returns that the above table and 4% rule are based on. However, the number you have most control over is your savings rate – and that is most important.

Colin Nicholson – A Great Australian Investor … and February 2021 – End of Month Update

I have a few people that have greatly influenced my investing life – One such figure is Colin Nicholson. I have never met him, but he has taught me a vast amount through his long running website “Building Wealth Through Shares” (bwts.com.au).

This great Australian investor Colin Nicholson, has been investing for over 50 years and documenting his adventures with shares since 2001 on his site. Colin has only stopped actively contributing at the end of 2019. Fortunately, this website is still running and his knowledge and experience keeps on giving. As well as education material on technical and fundamental analysis, he often discusses the psychology necessary to be a successful investor.

We tend to have an impulse to snatch profits quickly and to let losses run, hoping things will come good if we hold on. This natural impulse is the exact opposite to what a successful investor must do.

Colin Nicholson

Colin started bwts.com.au when financial blogs were in their infancy and Australian contributors were rare. Colin is a private investor, an author, and educator. He has been contributing to his site for over 20 years and answered hundreds of questions from other investors. His site is an incredibly detailed knowledge base covering all aspects of owning a share portfolio. His Investing – Twelve Key Lessons is essential reading to anyone thinking of entering this fascinating world. His results over a 20-yr period are very impressive. Colin has retired from active contributions to his website but has hinted that he would maintain his website for the education of future investors.

There are countless bits of wisdom as Colin relentlessly tackles investment according to a defined, well-tested, and logical plan. No matter what the investing subject, search his site, and Colin Nicholson will offer some useful and reasoned discussion.

The source of most frustration in investors is that they are expecting the impossible. They want to sell at the top. I repeat that it simply cannot be done except by sheer luck.

Colin Nicholson – Take Profits or Wait for the Stop-Loss?

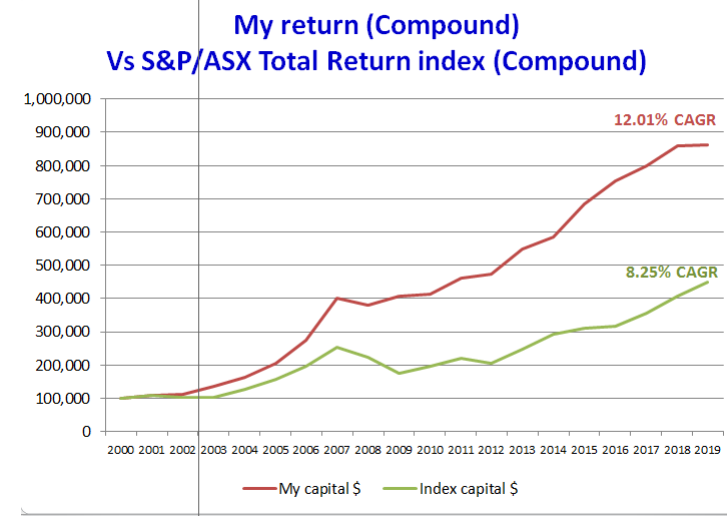
My first introduction to his site was through his meticulous documentation on how he calculated his end of financial year performance returns. Year after year he would list his portfolio and investment returns.

This image has an empty alt attribute; its file name is ColNichReturn.png
Colin Nicholson’s documented returns over 20 years comparing his returns(red) and the ASX 200 accumulation index (green). A 12.01% Compound Annual Growth Rate (CAGR) is very impressive over a 20-yr period and has enabled Colin to have a hopefully financially carefree retirement.

… I do not wish to advise people or to manage their money. Rather, my focus is on my own investments and passing on what I have learned to others.

Colin Nicholson

In addition to his website and public speaking, Colin has also authored Building Wealth in the Stock Market and Think Like the Great Investors. Like another of Slack Investor heroes, Warren Buffet, Colin has a plan for “retirement mode” and intends to become more passive with his investments and half of his portfolio is now in LICs and index funds.

I am not retired – I am a full-time investor

Colin Nicholson

Colin Nicholson, Slack Investor salutes you for your enormous contribution to my investment life and for helping countless others with your education materials and your disciplined and methodical approach to investing in shares. Dive deep and long into bwts.com.au and you will be a better investor.

February 2021 – End of Month Update

Slack Investor remains IN for Australian index shares, the US Index S&P 500 and the FTSE 100.

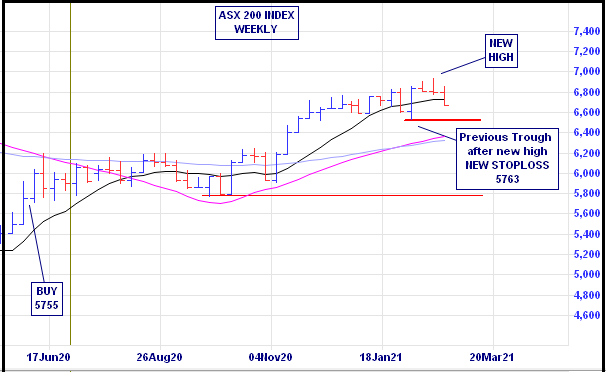
When having a look at the end of month charts, I noticed that all index trackers were well above their stop losses (>16%). My Mum (and Kath and Kim) would say that she could “feel it in her waters” when she had a premonition about something. My index rules allow the end of month stock price to be up to 20% above the stop loss. However, in a tip of the hat to Mr Nicholson, who is far more disciplined than Slack Investor in the investing arts, some action this month. As “new highs” have been established, I decided that now wouldn’t be a bad time to adjust the stop loss levels upwards.

I place my stops below the low of the last trough in the uptrend and move it up to just under the next trough every time a new high is made for the trend.

Colin Nicholson
Weekly Chart of the ASX 200 Index – incrediblecharts.com

For February 2021, there were falls in the growth oriented Slack Portfolio due to rising long-term bond yields. But stock prices have always fluctuated above or below a “fair price” – for one reason or another. Slack Investor is still on the couch.

Tech stocks are susceptible to rising yields because their value rests most heavily on future earnings, which get discounted more negatively when bond yields go up.

From The Bull

Despite the end of month sell off, there were modest rises in all followed index funds (ASX 200 +1. 0%, S&P 500 +2.6%, and the FTSE 100 +1.2%). All Index pages and charts  have been updated to reflect the monthly changes – (ASX IndexUK IndexUS Index).

2021 Lets talk about the planet – ESG Sustainable investing

Oooh … this planet is hot!

The difference in mean (average) temperature for the year 2020 and the 30-year average temperature between 1981 and2010 – Sourced from the World Meteorological Organization (WMO)

This is just last year … and the red colours show where planet Earth has been hotter than the long term average temperature. Clearly, for most of the world, 2020 was between 1°C and 5°C warmer than would be expected from the long term average. The reason this is happening is almost certainly due to increases in greenhouse gases since the industrial revolution.

… there’s a more than 95 percent probability that human activities over the past 50 years have warmed our planet.

From climate.nasa.gov based upon the Fifth Assessment Report Intergovernmental Panel on Climate Change (IPCC)

Another way to visualize the warming is to have a look at the past 110 years in Australia. The last decade was the hottest on record with temperatures almost 1 °C above average and one third of a degree warmer than the previous decade.

110 years of Australian Temperatures with warmer tempearatures represented by the yellow, orange and reds. These maps show the anomaly of mean temperature for each calendar year, compared to the average over the standard reference period of 1961–1990. From the Bureau of Meteorology. The full beauty of this chart can be found in the pdf form of the image.

This is not a political view – but is just science. The world is getting warmer and more and more people and governments think we should do something about it.

The world’s leading climate scientists have warned there is only 10 years for us to act if global warming to be kept to a maximum of 1.5°C. If temperatures go beyond this by even even half a degree, this will significantly worsen the risks of drought, floods, extreme heat and poverty for hundreds of millions of people.

Slack Investor has tried to do his little bit in reducing his CO2 emission- but admittedly, I could do more. In addition to his puny personal efforts, by marshalling the the power of his investments, this might have greater consequences. He is not alone in this thinking.

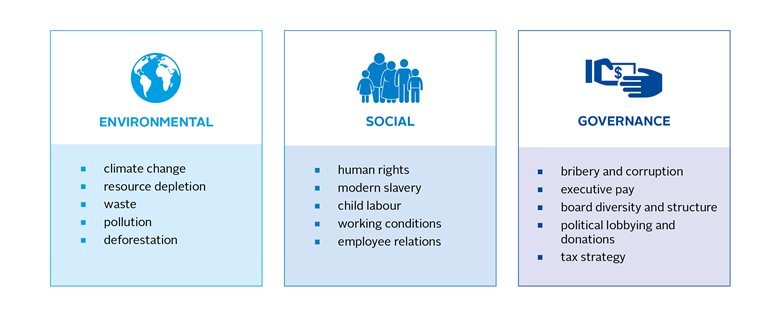
Environmental, Social and Governance (ESG) principles

ESG has become a bit of a buzz acronym in corporate and investing circles and is linked with a set of factors associated with “responsible” or “sustainable” company behaviour. Global Warming (or Climate Change) is just one of these ESG issues – but Climate Change is the highest priority ESG issue facing investors.

Examples of ESG Issues – From Principles for Responsible Investment

To invest according to ESG principles is to undertake to exclude companies in their portfolios considered to be doing harm to the world, and often positively skew their portfolio weightings in favour of companies deemed to be doing good.

From the Sydney Morning Herald

A recent investment development has been the collection of environmental, social, and governance data. There are agencies such as Ethisphere and MCSI that rate publicly listed companies on their resilience to long-term ESG risks. But, most people just select a “Sustainable” or “Ethical” or ESG fund and let the fund manager do the company selecting.

Ethical Investing … its a murky world … but worth it!

While getting into an ethical investing fund or ETF is straightforward. Behind the door of each fund, picking which company gets into the fund sets up all kinds of dilemmas. The company selection process seems to be a bit of a “dark” art and can be done by positive screening (e.g, High ESG scores); or, negative screening with the exclusion of industries such as armaments, tobacco, gambling or thermal coal production. Screening might also be done at the company level, for instance, to exclude a mining company might have a dodgy environmental history. Each fund seems to have a different methodology. We hope that the fund managers get it mostly right. The sustainable/ESG funds that I looked at seemed to be dominated by Technology, Financial and Healthcare companies – these are the type of companies that Slack Investor invests in already. But mining companies should not be dismissed in this sustainable search as they will help enable the transition to the low carbon economy – but they too must rethink many of their practices and decarbonize production and reduce water usage.

… renewables power sources are built from non-renewable materials produced by businesses that tend to have larger carbon footprints and low ESG ratings. Mining firms produce many of the critical materials necessary to transition to a low carbon economy.

From Massif Capital – Failure to Impact (PDF):

For example, Massif Capital cite that to build a 400 kg lithium-Ion battery that might be found in most electric vehicles requires roughly 10 kg of lithium, 12 kg of cobalt, 24 kg of nickel, 36 kg of copper, 44 kg of graphite, and 160 kg of steel, aluminium, and various plastic components.

Sustainable Funds are Taking Off

It is not just the recent extreme weather related events such as the 2019 heat wave in Europe, or the recent fire events in Australia and California. There seems to be a surge in the amount of money coming into sustainable funds as investors are starting to think about climate change and sustainability and how this affects their investments.

sustainable funds estimated quarterly inflows
Quarterly fund inflows into sustainable funds. There has been a fourfold increase in assets that flowed into sustainable funds in the US last year – From Morningstar … A Tipping Point

A move towards sustainable investing can be done through your super fund. Each super fund will have some sort of sustainable option for your superannuation money. Or, you could invest directly through a managed fund or an Exchange Traded Fund (ETF).

If you don’t want to buy individual companies and research how sustainable/ethical each company is, I like the ETF approach and would look at ETF’s like Vanguard Ethically Conscious International Shares Index ETF (VESG) for International ethical exposure. It has a spankingly good low management fee of 0.18%. For local products, I couldn’t go past the SPDR S&P/ASX 200 ESG Fund ETF (E200). This ETF has only been going 5 months and has been doing well. It also has a low management fee of 0.13%

Move towards sustainable – and feel good about yourself – and we might just save this planet.

My House … and June 2020 End of Month Update

… Welcome to my house, Baby take control now, We can’t even slow down, We don’t like to go out, Welcome to my house …

Flo Rida “My House”

Slack Investor’s taste may not be quite as “gangsta” as Flo Rida – check out his full video to get a flavour of what I mean – But, both Flo Rida and I share a genuine passion for the joys of household ownership.

In my last post, I had a bit of a rant about the exorbitant transaction costs of buying a house. Despite the costs, I hope that I didn’t mislead about the absolute joy that Slack Investor feels about house ownership. A Slack Investor pillar for financial independence is to own your own place before you retire – as the cost of housing keeps rising for retired renters. The typical homeowner aged over 65 spends just 5% of their income on housing, this compares to nearly 30% for renters.

Flo Rida and I are enamoured with owning our surroundings:

  • The Serenity – Ownership gives stability and control – You can do what you like in your own house and are immune from sudden evictions.
  • Access to aged pension and taxation benefits – the home is treated differently than other assets. However, Slack Investor thinks that these concessions are too generous and will probably be capped in the future – Currently in Australia, $6 billion in pension payments go to people with homes worth more than $1 million.
  • Flexibility – No need to ask the landlord to make changes – If you go on an extended adventure, then why not rent your house out for the dates that you are away – to help pay for the holiday – Or, House swap to an exotic location!

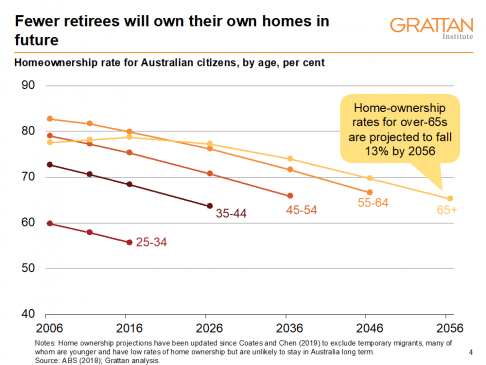
Slack Investor understands that owning a home may seem an impossible dream to some – and, sadly, ownership rates are decreasing . But do not give up hope – Many real estate pundits are expecting prices to fall from their current eye-watering levels. This fall should be accelerated by COVID-19 factors.

Home Ownership rates are on the decline for all age groups. – Grattan Institute

A home does not have to be large and, it could be out of a capital city. There seems to be a trend already for millennials (and older folk 60-69) to be moving from cities to the regions according to the Regional Australia Institute. They suggest that equitable access to housing is one of the pull factors for this move to the regions. Slack Investor has spent most of his working career outside of big cities and can highly recommend the simplicity of life away from the capitals.

More than 400,000 Australians moved from capital cities to regional destinations between 2011 and 2016

Regional Australia Institute report – February 2019

June 2020 – End of Month Update

This image has an empty alt attribute; its file name is trend-1445464__180.jpg

Slack Investor admits to being only an amateur economist and finds the current situation in the US confusing – Stock market up, economy down! These are wild times … but I am back to all IN for my Index funds!

US Data keepers, the National Bureau of Economic Research (NBER) have now determined that the US economy entered a recession in February 2020 “with different characteristics and dynamics than prior recessions”. The Federal Reserve bank of Cleveland strangely have their forecast of a recession in the next year at 19.2% (below Slack Investors threshold of 20%). However, reality always beats forecasts and Slack Investor has his stop losses live again for all Index funds.

Monthly rises in all followed markets ASX200 +2.5%, FTSE100 +1.5% and S&P500 +1.8%.

COVID-19 problems go up … stock markets go up? I know stock markets are usually forward thinking and obviously see an end to COVID problems soon. Slack Investor is not so sure … but the charts have him invested in all markets. My portfolio is trimmed to industries that should be OK( I Hope?)

All Index pages and charts  have been updated to reflect the monthly changes – ASX IndexUK IndexUS Index. The quarterly updates to the Slack Portfolio have also been recalculated.

Call My Broker

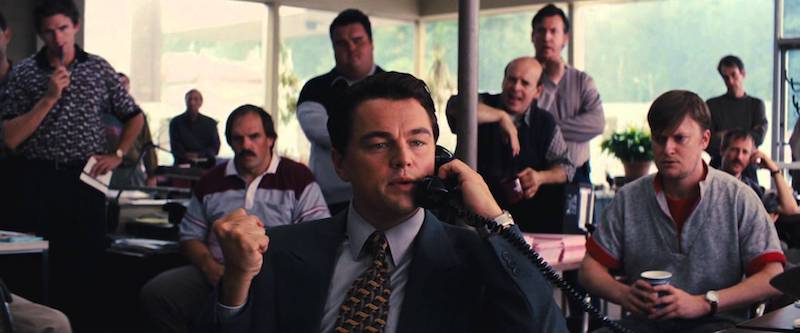
It is my sincere hope that, when you call your broker, Jordan Belfort (played by Leonardo DiCaprio) from the highly entertaining Wolf of Wall Street, is not at the end of the line – Image may be subject to copyright.

Most people own shares indirectly through their superannuation or, perhaps through investment platforms such as Raiz – this is a good place to start. Slack Investor would like to make the case for moving onto the next investment step and getting a broker for yourself. These days, a broker is usually an online platform that organizes buy and sell orders for shares and other financial bits.

It brings me shame … but Slack Investor doesn’t just have just one broker … I have three! This might seem a tad excessive – most people only need one and I thought I might share my experience with all of them to help you choose the right one for yourself. If you are serious about investing, you need a broker- Even Dilbert has a broker!

With acknowledgment to Scott Adams – whose everyman Dilbert brings joy to the tedium of the office.

Getting a broker involves as much effort as getting a bank account – an associated trading account is usually required to store your cash when setting up. Most of this can be done online but there are a few identity checks to go through. I have set out below my experiences with my brokers – this is not a complete comparison and a good overview of recent offerings can be found at Best Online Brokers Australia for 2020. This field is rapidly changing with a move towards “zero brokerage” by some new players e.g. etoro. It is always a good idea to research the total costs for each of the new offers as there are often hidden fees such as “withdrawal fee”, “holding fee”, “inactivity fee “, etc. My experiences below might give you an idea on what to look for in your broker.

Commsec

commsec logo

Commsec was my first broker and it is the “gorilla” – It is Australia’s largest retail share trading platform and backed by the Commonwealth Bank. I use Commsec for my super fund trades.

Good things: A great trading platform with easy access to recent sales, buy/sell spread and research. One of the best thing about Commsec is that you can make a trade with zero money in your trading account and have 2 days before trade settlement to transfer your funds to your trading account. I have often sold a share and on the same day bought another share with the funds required covered by the previous sale – this gives great flexibility. Other than brokerage, there are no other fees for ASX shares.

Things that annoy me: The brokerage, this is on a sliding scale and range from $10 for a $1000 trade (1.0%) through to $19.95 for a $10000 trade (0.20%). Because most of Slack Investor’s trades are over $10000, I was pleasantly surprised to find that for the last financial year, my total Commsec costs were only 0.13% of trade value.

SelfWealth

Thumbnail icon for SelfWealth

SelfWealth is a much smaller trading house and has won Money Magazine’s “Cheapest Online Broker” award for the last three years. I use this for my own name accounts and was drawn in by their headline fixed price trades of $9.50 – no other fees.

Good things: A very cheap trading rate – my costs for 6 trades in the last 12 months amounted to 0.08% of trade value.

Things that annoy me: The SelfWealth trading platform is not as good as Commsec’s and transfers to and from the trading account are terribly slow. This is annoying as they don’t allow trades till there is money in the trading account. So, before I act on a trade I must first move money into the SelfWealth trading account – this may be days after I first see a trading opportunity!

Saxo Markets

Saxo Markets is a broker that I have only recently signed up with as my SMSF manager (esuperfund) required me to go through Saxo if I wanted to own overseas shares. Total costs will depend on how much you trade … but after the smooth Australian experience, the cheap trading fee is complicated by Currency Exchange fees, Inactivity fees and Holding fees. For the past year, my costs add up to 0.42% of trades.

Good things: The ability to buy other international stocks. Many other brokers also offer this.

Things that annoy me: The fees of course … and the confusing trading platform. I wouldn’t use these jokers if I had a choice. Particularly when there are cheaper ways to access the US market.- Stake has a similar currency conversion fee to Saxo without the multitude of other costs.

Stock broking expenses compared to Real Estate

Slack Investor stock broker transaction fees range between 0.08% and 0.42% of trade value – and I’m leaning towards Commsec as my favourite broker on a costs vs features basis. If I was just starting out, maybe SelfWealth, or one of the zero brokerage platforms – but watch out for other fees!

I might have had a little whinge about broker fees … but let’s just have a reality check with another common investment commodity where there are costs involved – Real Estate.

I have recently bought and sold a house and the transfer costs are relatively staggering.

When selling a house (Agent Fees, Conveyancing Fees, Advertising, Govt fees,etc), my transaction costs were 2.7%. When buying a house in Victoria, excluding loan costs, (Stamp duty, Land Titles, Conveyancing) the costs worked out to 5.8% of the purchase price.

Transaction costs are just part of investing, but it is no wonder that Slack Investor is attracted to the lower fees, simplicity and transparency of share trading over property trading. However, the volatility of shares I find testing at times.