ETF Themes … and Dreams

From ETF Database

It has become quite fashonable, worldwide, for new ETF’s to be launched onto the market with a “theme”. Robotics, Alternative Energy, Cryptocurrency, Battery Tech, or Artificial Intelligence are just some examples of themes where an ETF provider will bundle a number of companies together with a catchy ticker.

This trend seems to be also happening in Australia. Investsmart has been following the performance of a few of the new Australian thematic ETFs e.g. HACK (Cybersecurity), ERTH (Climate Change Innovators), ACDC (Battery Technologies and Lithium), ESPO (Gaming and eSports), CRYP (Cryptocurrency), CLDD (Cloud Computing) and DRUG (Healthcare). Their results, since the ETF inception dates, are a mixed bag. ACDC, DRUG and HACK outperformed the ASX200, while ERTH, ESPO, CRYP and CLDD have underperformed.

The two main problems with themed ETF’s is that they are generally expensive – have high management costs relative to other broad index ETF’s and, they concentrate risk in just one part of the market – the theme might suddenly fall out of favour e.g. ARKK.

The themed ETF’s generally have management fees of over 0.50% p.a., wheras broad Index funds have fees closer to 0.10%p.a. – Financial Times

In a comprehensive study (over 25 years) of US ETF’s, The Ohio State News concludes that these new themed ETF’s are based mostly on “hype” and they tend to lose value in comparison to the general market very soon after they are launched.

… specialized ETFs lost about 6% of value per year, with underperformance persisting at least five years after launch.

The Ohio State News

Thematic ETFs are often launched near the top of the market when interest in that theme is at a high. As a result, the stocks in the thematic ETF can start overpriced, resulting in underperformance.

Investsmart
from Stockspot

In the U.S. of the 277 ETFs that shut down in 2020, one-quarter of them didn’t make it to their third birthday

Stockspot – Why we avoid new thematic ETFs

Slack Investor Themed ETF Record – Not Good

Slack Investor has also not been immune to the “hype” and has bought a number of themed ETF’s, as well as a few broad-based index-type ETF’s. The latter, of which, I am generally happy with their long-term performance. My thinking was to get onboard, in a relatively easy way, to some exotic investment themes.

In the past 5 years I have bought VanEck Morningstar Wide Moat ETF (MOAT), Vanguard FTSE Emerging Markets Shrs ETF (VGE), BetaShares Global Cybersecurity ETF (HACK), BetaShares Glb Rbtc & Artfcl Intlgc ETF (RBTZ), BetaShares Asia Technology Tigers ETF (ASIA), VanEck Video Gaming & eSprts ETF (ESPO), BetaShares Global Quality Leaders ETF (QLTY), Global X Battery Tech & Lithium ETF (ACDC), and Vanguard FTSE Emerging Markets Shrs ETF (VGE).

With hindsight, I can see the trap that I have fallen into. For example, E-Sports. I had read about E-Sports in the press and didn’t know much about them – except that they were popular, and they were the new “thing” – and growing fast. I didn’t know any individual companies in the field, as most of them were based in the US. When VanEck Bundled together a few of the E-Sport companies into a themed ETF, VanEck Video Gaming & eSprts ETF (ESPO) I was excited and bought into it. The trouble was, I was late to the party. As the chart above shows, by the time I entered the market, there was already a lot of hype, and the entry price paid was probably over-inflated.

The BUY-SELL price history of the themed ETF’s that Slack Investor has added to his portfolio. The first dot for each ETF is the BUY price and the second dot is either the SELL price, or the CURRENT price. If the lines keep going to the end of the chart (01/01/2023), then I am still holding the ETF.

When I plot out the price history of the themed ETF’s that I have bought over the past few years, the theme was not a dream. With the exception of the MOAT ETF, the flat or downward lines indicate a less than lustrous performance. Ideally, all my BUYS would slope upwards from left to right over time.

This chart is a good look in the “house of mirrors” for Slack Investor, I will continue to buy themed ETF’s in a small way to expose my investments to interesting sectors. However, I will modify my purchases of these themed ETF’s in the future – Or at least, wait a few years after launch for the excitement to settle down … and then invest.

Not all is lost, there are some bright lights amongst the themed ETF’s. The Morningstar Australian ETF’s top ten performers over 5 years ar a mixture of both themed ETF’s, and broad-based ETF’s. Over a realistic 5-yr time frame, where there is enough time for “our flowers to grow”, the top 10 annualized average 5-yearly growth is shown in bold. Over 10% p.a. is impressive – but you have to be lucky – or a great ETF picker.

NameYield %Fees (MER%)1-yr p.a.3 -yr p.a.5-yr p.a.10-yr p.a.
BetaShares Global Sstnbty Ldrs ETF (ETHI)2.610.59%-15.41%11.35%15.13%
BetaShares NASDAQ 100 ETF (NDQ)3.370.48%-28.41%9.25%14.71%
BetaShares Global Cybersecurity ETF (HACK)8.720.67%-22.06%10.68%14.32%
Global X Physical Palladium (ETPMPD)0.49%-2.05%-1.16%14.17%14.43%
BetaShares Australian Res Sect ETF (QRE)14.540.34%22.98%13.80%13.72%7.71%
VanEck Morningstar Wide Moat ETF (MOAT)0.49%-7.38%8.17%13.37%
SPDR® S&P/ASX 200 Resources ETF (OZR)15.640.34%22.90%12.96%13.23%7.49%
iShares Global Healthcare ETF (AU) (IXJ)1.10.40%1.90%9.79%13.11%16.93%
iShares S&P 500 ETF (IVV)1.420.04%-9.03%10.09%13.03%17.94%
Global X Morningstar Global Tech ETF (TECH)4.990.45%-29.06%5.29%12.76%

Imperfections in the Brickwork and … December 2022 – End of Month Update

Detail from the Pen and Ink “Behind Armstrong Street Shops” – the remarkably talented Bren Luke, 2022.

Slack Investor is always on the lookout for new investments … and nothing attracts the jaundiced Slack Eye more quickly than continuous long term results.

Brickworks Ltd (BKW:ASX) have just had their AGM presentation. I was very impressed by the claim that they have maintained, or increased, normal dividends for the last 46 years!

Dividend record – Brickworks 2022 AGM presentation – Brickworks
Tracking the share price of BWK:ASX since 1968 – Brickworks 2022 AGM presentation – Brickworks

As well as being a very good maker of bricks, Brickworks operates as an investment company and own a 26.1% stake of the diversified investing house Washington H. Soul Pattinson (SOL:ASX). SOL, in turn have holdings in

  • TPG Telecom – Australian telecommunications provider
  • Brickworks Limited – Clay and concrete production for the construction industry
  • New Hope Group – Coal and oil mining and energy generation
  • Tuas Limited –  Telecommunications provider
  • Apex Healthcare Berhard – Malaysia-based pharmaceutical production
  • Pengana Capital Group Limited – Fund management
  • Aeris Resources –  Mining and exploration activities

Now Slack Investor does not want to get all preachy here, as as everyone has to draw their own line in the sand – These things are very subjective. I looked up New Hope Mining on the excellent Morningstar Sustainalytics site to get an idea on how well the company is ranked in terms of Environment Sustainability and Governance (ESG).

ESG Risk rating for New Hope Corp. Ltd. – from Sustainalytics

New Hope Group ranked 14571 out of 15559 in terms of ESG risk rating – on a worldwide basis. I personally would feel uncomfortable being a part owner of a thermal coal miner given the current state of the planet.

So despite the most excellent management and performance of BWK, while they still own an interest in the New Hope Group, I will look elsewhere for investments.

Puff Puff MOAT

On the subject of digging deep, I have been a long term holder of the VanEck Morningstar Wide Moat ETF (MOAT:ASX). Slack investor has many vices – Wine and beer just being just two of them … so again, I won’t lecture – as these things are very personal. However, some of the sins that my mother rubbed into me as being “particularly evil” are smoking and gambling. I will do my best to avoid ownership of these type of stocks in deference to my dear Mum.

I noticed back in 2021 that this MOAT ETF had Phillip Morris International as one of its top 10 holdings. According to the Yahoo Finance site – Phillip Morris is 2.5% of the MOAT holdings! Owning a part of a multinational tobacco company that is a leading part of Big Tobacco didn’t really sit well with Slack Investor.

According to the Global Burden of Disease Study, in 2015 alone, smoking caused more than one in ten deaths worldwide and killed more than 6 million people, resulting in a global loss of nearly 150 million disability-adjusted life-years

The Lancet

Slack Investor marked MOAT as an ETF to get rid of, despite liking the concept of its construction – “companies with sustainable competitive advantages”. I had a feeble attempt at shareholder activism and emailed VanEck about this … and enquired whether thy might screen the MOAT ETF with an ethical filter … to get rid of tobacco and gambling stocks – they replied with a polite “no”.

Modified (to protect the innocent!) email from VanEck to Slack Investor

I finally got around to attempt to sell MOAT this month and I thought I should just check the VanEck holdings MOAT site and look at their complete holdings list. Lo and behold … at 29/12/2022, Phillip Morris has now gone from their holdings list! So, for now, MOAT is a keeper!

If at a loose end during the holidays and need a distraction, Slack Investor highly recommends the free exhibition “Streets of Your Town” at the Ballarat Art Gallery, VIC. Bren Luke is an amazing artist, his exhibition runs till 5th Feb 2023.

December 2022 – End of Month Update

The year closes and, I’m not sure if Slack Investor was naughty (probably?)… but, there was no “Santa Rally” this month. All followed markets took a dive in December. The ASX 200 down 3.4%, the FTSE 100 down 1.6%, and the S&P 500 down 5.9%,

Due to the return of all followed share markets to more normal valuations, I have returned my stop-loss upper-limits to 15%. This means that when I work out my stop loss value, I add another 15% to it, this is my upper limit. If the stock price exceeds the upper limit, I will adjust my stop loss upwards. This method helps to lock in some gains if they occur.

Slack Investor remains IN for the FTSE 100, the ASX 200, and the US Index S&P 500.

All Index pages and charts  have been updated to reflect the monthly changes – (ASX IndexUK IndexUS Index). The quarterly updates to the Slack Portfolio have also been completed.

The Hubris Ark

Cathie Wood CEO of Ark Invest – from Observer

hubris: (noun) –  an extreme and unreasonable feeling of pride and confidence in yourself:

Cambridge Academic Content Dictionary

Cathie Wood is the CEO of Ark Innovation and is best known for her NASDAQ based flagship fund ETF (ARKK). She has been concentrating her bets on the “disruptive technologies,” such as artificial intelligence, genomics, blockchain and cryptocurrency, and clean energy. She is a big fan of Tesla and has made the prediction

Bitcoin will crack $1 million by 2030

Cathie Wood – The Street

Slack Investor is no seer … but at the October 14, 2022 price of 16240 USD, Bitcoin has quite a way to go to reach that mark. In the words of the great BBC TV character Sir Humphrey, this looks like a “very courageous” prediction Cathie!

The ARK Innovation ETF (Nasdaq: ARKK)

Wood, is a devout Christian, and has named her company after the sacred Ark of the Covenent. Cathie Wood is a household name in the US and has a huge number of loyal fans. Her funds had 60 billion USD under management at their peak. She was named by Bloomberg as Stock Picker of the Year in 2020 . The flagship ARKK fund gained a remarkable 152% in 2020, but since then, the performance has not been so stellar – ARKK is down 65% so far this year. In interviews, she often refers to her past success, and insists, over and over again, her performance should be judged over a five-year time horizon.

The Price chart of the ARKK ETF since 2017 –

Wood is nothing but confident. She hosts a monthly finance video – delightfully called “In the Know” and is a great defender of her fund. She sees “spectacular returns” for Ark Invest over the next five years. According to a recent article by New York magazine, her initial predictions for ARK Invest were annualized returns of 15 percent, “Now we think 50 percent.”

Slack Investor would agree that a 5-yr holding period is a good minimum to judge how a fund is performing – to allow for volatility and to allow growth stocks to grow. She might be right that tech stocks are undervalued at the moment. But let’s have a look at her results as a fund manager over the last 5 years. The total return of ARKK expressed as a compound annual growth rate (CAGR) since November 2017 was a not so impressive 3.5% when compared with other “no stock picking” index funds.

InstrumentValue Nov 2017Value Nov 20225-yr CAGR
ARKK36.4443.313.5%
NASDAQ 100 TR71591388114.2%
S&P 500 TR5212840710.0%
FTSE 100 TR651075643.1%
ASX 200 TR56486811027.5%
Based upon the 5 years preceding November 2022, the compound annual growth rate (CAGR) of various Total Return (TR) index values compared with the ARKK ETF (including dividends since Nov 2017 of $2.91 USD). These TR calculations include dividends. Data from Yahoo Finance and CAGR calculations from CAGRCalulator

Cathie Wood conducted a recent session at a Morgan Stanley event in Sydney. where she maintained her bullish outlook. According to the Financial Review, the fund manager essentially argued it’s the market that’s got it wrong, not her!

Slack Investor is far more humble … he “takes his licks” when times are bad – doesn’t “crow” when times are good – and is mostly wary when a new “stock guru” emerges.

In the stock market, volatility is the price he has to pay for being involved with long-term asset growth.

November 2022 – Mid-Month Update

This image has an empty alt attribute; its file name is trend-1445464__180.jpg

My small-scale, and often very frustrating, market timing experiment continues until its projected end in 2024. On a weekly signal for the FTSE 100 from the momentum following Directional Movement system. I have bought back into the UK index. I am back now to fully invested in the ASX IndexUK IndexUS Index.

The buy signal can show itself as a downward dip in the trend strength indicator ADX (grey line) of the lower panel below. There are many ways of setting up this Directional Movement system. Slack Investor likes the “smoothing” that is enabled by a system that looks back over the previous 11 periods – but the complexities are best left for the Resources page.

FTSE 100 Weekly chart showing a BUY signal on the Directional movement Index weekly chart. The weekly price ranges are at the top and Average Directional Movement Index (ADX) patterns below – From Incredible Charts

The Index page has been updated for the  UK Index. 

Finding Value … and October 2022 – End of Month Update

Widewalls

In amongst the general carnage of the market, Slack Investor has been doing a little buying. An opportunity came up with an existing holding. Dicker Data (DDR). DDR is an Australian-based technology hardware, software and cloud distributor.

From time to time, a company will go to institutions and shareholders to raise a bit of working capital using a Share Purchase Plan (SPP). Dicker Data (DDR) needed to expand its warehouse facilities. Fair enough – but does Slack Investor want to part with more cash to invest in this company? Lets take a fresh look using the excellent Market Screener Financials Page. The Slack “basics” of a high return on equity (38.7% in 2022) and projected growth – on top of an established period of growth – are still intact – Tick

DDR – Historical (Black)and analyst projected income growth (grey) till 2024 – Market Screener

The price of DDR has been generally “beaten up” in the last 6 months as interest rates have risen and growth stocks have suffered. There are probably some more tough times ahead … but Slack Investor likes to take the “long view”. This business has a long term growth strategy and will probably persevere despite current headwinds – Tick.

DDR – Analyst projected PE ratio till 2024 – Market Screener

The current DDR Price/Earnings ratio is 22.9 – below recent values and projected to reduce further as income increases. – Tick.

Although analyst predictions can be wrong, on balance, the miserly Slack Investor was happy to part with a few dollars in this Share Purchase Plan as he could find some value in this business. There is every prospect that the DDR share price will increase in the next few years.

Finding Index value using CAPE

As with individual companies, the whole share market will oscillate between overvalued and undervalued. Slack Investor has written about the Cyclically Adjusted Price to Earnings ratios (CAPE) which use ten-year average inflation-adjusted earnings to take out some of some of the volatility of annual earnings. By plotting this CAPE over a period of time, we can look at how the whole sharemarket is currently valued in terms of historical data.

Using monthly CAPE data from Barclays, the 40-yr mean is calculated and plotted together with the CAPE values. A “fair value” zone is created in green where the CAPE is within one standard deviation of the mean.

Historic CAPE ratios for ASX 200 – From 1982 to September 2022
Historic CAPE ratios for FTSE 100 – From 1982 to September 2022
Historic CAPE ratios for S&P 500 – From 1982 to September 2022

From the above, The ASX 200 (7% below av.) and the FTSE 100 (13% below av.) are “On Special” at the moment as their CAPE values are below their long-term averages. Even the S&P500, after a long 2-yr period of being “Over valued”, is now getting close to being “Fair valued”.

October 2022 – End of Month Update

Slack Investor remains IN for Australian index shares though it is still on watch after breaching its stop loss at the end of September 2022.

My last post described how I had left the UK and US Index in the middle of October 2022. I am now back IN to the US Index – and, for the moment, OUT of the UK Index. Although, I am keeping a weekly watch on the FTSE 100 in case there is a signal to return to the market.

This month illustrates why I feel glad that my 20-yr index timing experiment is coming to an end in 2024. After exiting the US and UK markets only 2 weeks ago, there has been a rally in both the US Index S&P 500 and (to a lesser extent) the FTSE 100. The momentum has been sufficient for Slack Investor to be “whip-sawed” back into the US Index on a weekly buy signal – I am starting to get “really over” this timing the market experiment.

For the experiment, Slack Investor uses a trend following (or momentum) system called the Directional Movement Index. The buy signal shows itself as a downward dip in the ADX (grey line) of the lower panel below. There are many ways of setting up this system. Slack Investor likes the “smoothing” that is enabled by a system that looks back over the previous 11 periods – but the complexities are best left for the Resources page.

S&P 500 Weekly chart showing a BUY signal on the Directional movement Index weekly chart. The weekly price ranges are at the top and Average Directional Movement Index (ADX) patterns below – From Incredible Charts

This month, there are positive movements all round. The ASX 200 +6.0%, the FTSE 100 +1.6% and the S&P 500 +8.0%.

All Index pages and charts have been updated to reflect the monthly changes – (ASX IndexUK IndexUS Index).

FY2022 Nuggets and Stinkers and … July 2022 – End of Month Update

 So the last shall be first, and the first last: for many be called, but few chosen 

Matthew 20:16 – King James Version of the Christian Bible

Slack Investor is not a very religious person – but he is a numbers man and 84% of the global population identifies with a religious group – so I have to go with the flow here. This sort of majority demands respect. The Christian disciple Matthew was reporting on one of Jesus’s teachings. Biblical scholars think that Jesus was trying to point out that Heaven’s value system is far different from earth’s value system.

The “Last first and First last” might also be applied to how some of the Slack Portfolio stocks have been going over consecutive years. There seems to by a cycle of last years Nuggets … might end on the Stinker pile the year after – and vice-versa. Growth stocks have many virtues … but they are not immune to the cycles of price – bouts of overvaluation followed by a period of undervaluation.

The percentage yearly returns quoted in this post include costs (brokerage) but, the returns are before tax. This raw figure can then be compared with other investment returns. I use Market Screener to analyze the financial data from each company and extract the predicted 2024/2o25 Return on Equity (ROE), Dividend Yield and Price/Earnings (PE) Ratio on the companies below. This excellent site allows free access (up to a daily limit) to their analysts data once you register with an email address.

Slack Investor Stinkers – FY 2022

Financial year 2022 was the Pepé Le Pew of all of Stinktown for Slack Investor.I hold mostly growth shares in the technology and healthcare sectors. These sectors have been heavily punished across the world so far in 2022.

This is the first time I have had a negative result for my investments over a financial year since 2009. Slack Investor is a great believer in long term investing returns – usually evaluated over a 5-year period – so this year’s result, while painful, does not change my overall strategy.

Three of my “stinkers” this year were actually “nuggets” from last year. For FY 2020, Codan +161%, REA +59% and IDX +37%. Such is the cyclic nature of some growth stocks.

Codan (CDA) -58% (Still held)

Codan - Niramar

(CDA – 2025: PE 14, Yield 3.8%, ROE 25%) Codan is a technology company that specializes in communications and metal detecting. This company was one of my big nuggets last year (+161%) – so I should not have been really surprised that there could have a bit of a pullback. The decline hurt, but the fundamentals of the company remain sound. Holding on.

Xero (XRO) -41% (Sold)

Xero

(XRO2025: PE 81, Yield 0.3%, ROE 15%) Xero is an innovative cloud -based accounting provider for small business. Every business owner that Slack Investor talks to say that Xero is a boon to their business. This sort of “word of mouth” got me over-excited this year and I just held my nose and jumped in – against all my rules of avoiding the excessively high forward PE ratios of over 50! It is these high PE companies that are usually punished first in a downturn – and that’s exactly what happened. I still look at it and think its a decent growing business – but I can feel the recent bite!

Integral Diagnostics (IDX) – 39% (Still held)

Integral Diagnostics | Medical Imaging Services | Australia | New Zealand

(IDX – 2024: PE 16, Yield 4.5%, ROE 12%) This medical image company provides diagnostic image services to GP’s and specialists. IDX was another of my nuggets from last year (+37%) that has just shed all of last years gains. The Return on Equity of this company is starting to get a bit low (<15%) – But the PE and yield seem OK. Will keep this company on watch for the moment.

BetaShares Asia Technology Tigers ETF -33% (Still held)

(ASIA – 2022: PE 14, Yield 0.7%,) Growth in Asia … What could go wrong! Plenty it seems.

These “technology tigers” that make up this ETF have been part of a global selloff of tech-related shares this year. 

A lot of the Chinese companies (such as Alibaba) have been marked down because the Chinese government imposed its will on a few industries. Also the US government has hinted at action on Chinese companies that have listed on American market. However, the ASIA ETF has large holdings in such monsters as Taiwan Semiconductors, Samsung and Tencent Holdings – so I will accept the current pain and stick with this as a long-term holding

REA Group (REA) -33% (Still held)

File:REA Group logo.svg - Wikipedia

(REA – 2024: PE 29, Yield 1.8%, ROE 32%) The owners of RealEstate.com.au. which is the go to portal for house selling and buying. 65% of Australia’s adult population are checking the site every month looking at property listings and home prices. Another long-term holding.

I have only listed the stinkers that lost over 30% this year … sadly, there were many more rogues that lost over 15% for the Slack Fund. They include PPK Group (PPK) -28%; Altium (ALU) -25%; Nick Scali (NCK)-20%; Pushpay Holdings (PPH)-16%; and A2 Milk (A2M)-15%.

Slack Investor Nuggets – FY 2021

Nuggets were few and far between this year. A great benefit of investing in companies that have a high Return on Equity (ROE), and with a track record of increasing earnings, is that they sometimes behave as “golden nuggets”.

Technology One(TNE) +17%

(TNE – 2025: PE 34, Yield 1.7%, ROE 36%) This Software as a Service (SaaS) and consulting company continues to be profitable. This year is the 13th year in a row of record half-yearly profits. A high 2025 PE of 34 (Expensive) is a little scary but, if the high Returns on Equity (36%) remain, on balance, this is OK.

Macquarie Group (MQG) +10%

Commonwealth Bank Macquarie Group Finance Westpac, PNG, 1800x600px,  Commonwealth Bank, Australian Dollar, Bank, Brand, Finance Download

(MQG – 2025: PE 25, Yield 4.0%, ROE 13%) Macquarie is a complex business with a range of banking and financial services, and plays in global markets and asset management. Once again, the management seem to know what they are doing – Slack Investor remains a fan.

Honourable mention to the only other company that ended in the black – Coles (COL) a decent +8% in these troubled times.

Slack Investor Total SMSF performance – FY 2022 and July 2022 end of Month Update

In a year that Chant West describes as “a rough year for markets”. Following FY2021, which was one of the strongest years for Super funds (+18% for FY21), things have now lurched south with the median growth fund (61 to 80% in growth assets) returning -3.3% for FY22.

The FY 2022 Slack Investor preliminary total SMSF performance looks like coming in at around -14%. However, the 5-yr performance is a more useful benchmark to me – as it takes out the bouncing around of yearly returns. At the end of FY 2022, the Slack Portfolio has a compounding 5-yr annual return of over 13%.

Despite a breach of the stop loss for the ASX 200 last month, Slack Investor remains tentatively IN for Australian index shares on a dramatic rise of 5.7% this month. The FTSE 100 also had a good month (+3.5%)and I remain IN. The US Index S&P 500 eclipsed them all with a remarkable 9.1% gain – and I am now a BUY back IN.

Last month the ASX 200 price went below its stop loss. Slack Investor tries not to exit a stock against the momentum of the market, so I have been off the couch and closely watching the ASX 200. It has remained above the rising trend line and emerged above the monthly stop loss. I am tentatively still IN.

ASX 200 Weekly chart – From Incredible Charts

After a sell, it is important to have a notion when to get back IN to an Index or a stock. When trend trading, my main tool for finding a buy signal is a trend following (or momentum) system called the Directional Movement Index. There are many ways of setting up this system. Slack Investor likes the “smoothing” that is enabled by a system that looks back over the previous 11 periods – but the complexities are best left for the Resources page.

S&P 500 Weekly chart showing a BUY signal on the Directional movement Index weekly chart. The weekly price ranges are at the top and Average Directional Movement Index (ADX) patterns below – From Incredible Charts

In addition to the BUY signal from the Directional Movement Index for the S&P 500, the charts show a triggering of the “Wedgie” pattern where the stock price breaks through a long term down-trend. This reinforces the BUY.

All Index pages and charts  have been updated to reflect the monthly changes – (ASX IndexUK IndexUS Index).

Diversification … It’s a good thing … up to a point

This collection of herbs and spices makes me hungry – From Systematic Risk Systematic Value

Slack Investor tries to diversify his investment risk by keep a 70% growth oriented investments portfolio with a 30% stable income portion. So far this financial year, my Investments portfolio performance has been a bit lacklustre – so I have gone to the “hall of mirrors” and had a long, hard look at myself. I decided to do a sector analysis of my investments portfolio. The biggest revelation is the large proportion of Investments in the Information Technology (INFT) and Healthcare (HLTH) sectors.

A breakup of the Slack investments portfolio by sector. Dominated by Information Technology (INFT) and Healthcare (HLTH) – but a scattering of Financials (FINL), Broad Index-type funds (INDX), Consumer Discretionary (COND), Communication Services (COMS/TELS), and Consumer Staples (CONS)

Both of my main sectors have had a rough time these last few months – as can be seen by the monthly sector performance chart below. Materials (Resources) and Energy have done well – But these are sectors that I do not own.

Monthly Sectors heatmap for S&P 500 Sectors – Click on Image for better resolution – From Livewire

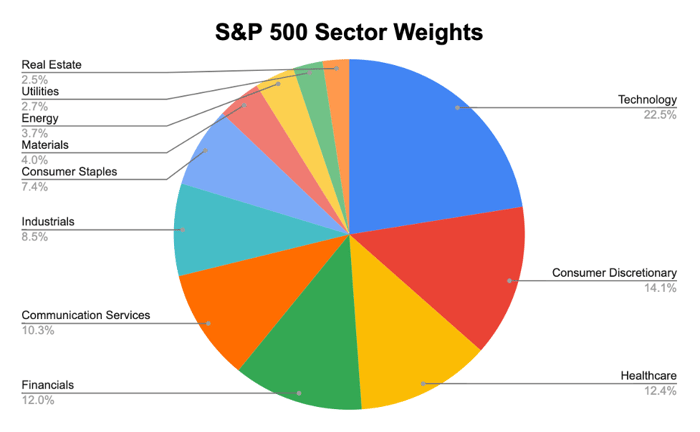
Slack Investor is not too old to learn new tricks … or, at least, evolve a little. so I was interested to see how my sector analysis compared with the US S&P 500 (below). I chose the S&P 500 f0r comparison as it not dominated by Financials and Resources like the ASX 200. My weightings are very different to the S&P 500.

Dow Jones 30,000: Here's Why It's Still Underperforming the S&P 500 and the  Nasdaq | The Motley Fool
S&P 500 Sector analysis – From The Motley Fool

Annual performance for each sector in the S&P 500

I came across a great graphic showing how each sector of the S&P 500 performs annually

10 yr excerpt from the annual S&P 500 Sector Performance ranking – Click on the Chart to get the full interactive experience – From Novel Investor

Some explanation of this beautifully coloured quilt is in order. The vertical columns represent each of the last 10 years performance of each sector of the S&P 500 in ranked order. The right hand column is for 2021. The 2021 sector leader was Energy (ENRS) after a long period in the doldrums. Next is Real Estate (REAL), Financials (FINL), Information Technology (INFT), S&P 500 (S&P), Materials (MATR), Health (HLTH), Consumer Discretionary (COND), Communication Services (TELS), Industrials (INDU), Consumer Staples (CONS) and Utilities (UTIL). The full glory of this graphic is found on the Novel Investor website with a bit of interactivity.

Some things that I have gleaned from this graphic

  • Every dog has its day – Depending on the year, each sector can have it’s day in the sunshine.
  • If you want neither the best of returns or the worst sector returns – buy the S&P 500 Index.
  • Often … if a sector tops the rankings in one year, it usually performs much worse in the next year.
  • The Information Technology (INFT) sector, to which Slack Investor is heavily exposed, is in the top four rankings for performance for 7 of the last 10 years. This year is not one of them.

Should I change my sector allocation?

There are good arguments for passive investing and, if I did not enjoy investing in individual companies, and my 5-yr results were not OK), then that is what I would do. To completely diversify my investment portfolio to match the S&P 500 would mean that I would be investing solely in an S&P 500 Index fund. This has been an excellent idea for the past 50 years.

Berkshire Hathaway has tracked S&P 500 data back to 1965. According to the company’s data, the compounded annual gain in the S&P 500 between 1965 and 2020 was 10.2%

From businessinsider.com

However, Slack Investor still thinks that the S&P 500 is over valued. Regardless of the current cycle, to invest in the whole index would be lumbering my portfolio with some cyclical and low growth companies.

I will continue to skew my investments portfolio with growing businesses – regardless of which sector they are in. I will not always get the company selection right – and will suffer the occasional whack. That’s fine, as long as I get it “mostly right”.

At the moment, many of the high P/E, growing businesses that Slack Investor owns are being sold down as analysts adjust down future earnings because of anticipated inflation. But the companies I own were usually selected for their ability to set their own prices and increase their earnings … these are the qualities of businesses that will prevail – regardless of short-term fluctuations.

CSL Goes to the Well – Share Purchase Plan 2022

From muslimaid.org

I did a north to south crossing of Africa 36 years ago, mostly in a 4-wheel drive truck and, if we stopped in a village, my routine would be to grab the water containers and find a well. This was always a pleasant task as it involved a line-up, sign language and usually a few giggles at the strange visitor’s expense. Overwhelmingly, the well would be attended by women and there was usually an air of joy and strong comradery in the queue.

CSL have just gone to the “well” – with a Share Purchase Plan (SPP).  They have purchased a Swiss company, Vifor Pharma (VIFN:SWX), which specialises in iron deficiency and renal disease. The acquisition cost US$11.7 billion and they have already covered most of this with an institutional placement and some new debt. CSL is trying to raise another $750 million from the “well” of shareholders pockets – and they seem likely to get it – let’s hope they will be welcomed back when they need water next time.

It seems to be the way of things that institutions (Brokers and Super Funds) get the first slice … and when this is done, there is a limited offer to retail investors – just to stop them whinging. Most of the time I participate in any share purchase plans as a convenient way to accumulate shares without the cost of brokerage. The CSL offer is set at $273 (or a 2% discount to the share price if CSL shares fall below this mark). Bids for the stock must be lodged by the 7th February, 2022.

“The combination with Vifor Pharma is expected to be financially compelling for our shareholders while expanding and diversifying our revenue base. It is expected to be immediately earnings accretive in the first full year of CSL ownership …”

Paul Perreault, Chief Executive Officer and Managing Director of CSL

Nice words Mr Perreault … but I have never ever read a share purchase plan that didn’t offer these comforting sentiments – CEO’s usually love to inform us of their astute decisions. “earnings accretive” just means that after all costs and synergies, the earnings per CSL share (EPS) should go up … and, when earnings go up, the share price should go up.

The projections for acquisitions and mergers are always complicated – the only real proof … will be down the track.

(There is) 30 years of evidence demonstrating that most acquisitions don’t create value for the acquiring company’s shareholders

Harvard Business Review

CSL do have a good track record of acquiring new assets and turning them into future growth engines. However, The CSL offer to acquire Vifor Pharma was generous at 40% above the Vifor list price. But this is where it gets even more complicated, the size of the premium is historically not a good predictor of how the deal will turn out. The most pertinent question is “Has CSL paid more than the acquisition was worth to to CSL.” Slack Investor has no answers yet … We will see how this deal settles.

On 14/01/2022, the CSL share price was $276.00 – A premium of $3.00 to the $273 offer price – or about 1% – so the SPP offer price is no real bargain. Despite Slack Investor’s endless devotion for the company, it seems that the market is currently out of love with CSL.

In the background, despite ongoing problems with plasma collection due to COVID-19, CSL has increased its profit for the past two financial years by 20% – but its share price does not really reflect that. After a rapid increase in 2019, the share price has gone nowhere in the last two years. Macquarie analysts have a 12-month price target on CSL of $338.

CSL Share price over the last 3 years – From marketscreener.com

Unlike Big Kev, I’m not super excited … The investor presentation, as always, looks compelling – full of talk about global reach, synergies and “developing a significant renal franchise”. But what really impressed me was the confirmation of CSL FY22 NPAT guidance of US$2,150 million – US$2,250 million. This is not advice, even though Slack Investor already has a big holding in this company, he will be participating in a slice of the CSL 2022 SPP.

Scaling Back

One of the annoying things about share purchase plans is the “scaling back”. If the SPP represents a good deal … they are usually oversubscribed. The 2021 Commonwealth Bank (CBA) SPP was such a good deal for retirees that they stumped up $18 billion more than the amount of shares on offer. Their share bids were scaled back by 79.4%. If you applied for $20 000 of CBA, you would have to send off this amount – and you would have been rewarded with $4120 of shares – and then have to wait for your refund.

The CSL 2022 SPP is not as immediately financially rewarding as the CBA offer and will probably not be scaled back as much. CSL has assured share owners that after the SPP, they will at least retaining their percentage shareholding in the company,

Slack Investor has done some rough calculations. As this new placement and SPP represents approximately 5.1% of current CSL ordinary shares on issue -This means that I should be able to buy at least 5.1% of my current holdings in the SPP without the inconvenience of scaling back.

If I owned $120 000 of CSL shares, I would be guaranteed to get at least $6120 (120K x 0.051) in the new SPP without scaling back. I round this up to the nearest allowable dollar value parcel, which is $10000 – and that’s how much I will apply for. Most people would apply for more (up to $30K) – but my portfolio is heavy with CSL, and this scaling back process just annoys me! CSL will of course refund any scaled back monies as soon as practicable after 14/02/2022 – without interest.

Innovation

pizza scissors
Pizza scissors – The new “Must Have” – These highly rated Kitchen Maestro Pizza Scissors were available at Amazon for $12 USD, but sadly, for pre-Christmas shoppers – currently out of stock.

Fish swim, birds fly, humans think, create and innovate. Thinking is not something that people do because we like it, we do it because it is our way of surviving.

José Luis Álvarez – From KnowledgeWorks

An amazing trait that we humans have is the ability to innovate. Slack Investor admires the innovators and the intellectual capital that they bring to businesses. Ideas and research are a vital part of a growth company. Research and Development (R&D) may lead to more efficient production processes or better products that give a company future growth. I have long been a big fan of companies with a high spend on R&D and I am happy to invest in these stocks.

According to the data from EFPIA, in the percentages below, the big spenders are in just a few sectors. The survey looked at 2,500 companies around the world. Technology companies usually have a big R&D budget, but the pharmaceutical and biotechnology industry lead by spending 15% of revenue on R&D. NASDAQ figures for specific companies, show R&D expenditure for Google (Alphabet) was 15% of its revenue in 2020, CSL about 11%, and Microsoft 13%. Apple was a relatively low 7% – but they have a very small range of products.

Proportion of Revenue spent on R&D by each Industry sector – EFPIA

Just because a company has a high R&D spend does not always guarantee success. As well of the discovery of ideas that might be useful in the business, a company must be really good at the Incubation, and Acceleration of these ideas. It is important to look for an established record in the way a business brings new products to fruition.

However, there is a broad link between innovation and value. The Boston Consulting Group(BCG) compile a yearly list and map the performance of the 50 most innovative companies. In 2021, they found that the more innovative businesses had an average Total Shareholder Return (TSR) premium of 3.3% over the MSCI World Index.

Most Innovative Companies 2021
Outperformance of the most Innovative companies – From the VisualCapitalist

“If I have 1,000 ideas and only one turns out to be good, I am satisfied.”

Alfred Nobel
Top 10 Most Innovative companies – published in the Visual Capitalist from BCG data.

The full list of top 50 innovators is worth a look and is a reminder that these are the companies that a lot of people interact with every day.

I have been a continual investor in the Betashares NASDAQ ETF (ASX: NDQ) that gives me access many of these great innovative companies. Every time that Slack Investor looks at the businesses that make up the NASDAQ 100, I think that this technology area must be where growth is still happening – and I want to be invested here.

According to GuruFocus the 12-mth forward PE of the NASDAQ 100 is 27 (A bit expensive) but the Return on Equity is at 18% – and growing (This is good).

Slack Investor also owns a slice of the Asian Technology giants with BetaShares Asia Technology Tigers ETF (ASX: ASIA). The heavy hand of Chinese government interference in some tech stocks has led to a pullback in price this year. But I have maintained my holding because Chinese companies like the search engine Baidu, the e-commerce giant Alibaba, and the technology beast Tencent will not be held back for long.

A good compromise, if you want a more whole world approach, is the ETFS Morningstar Global Technology ETF (ASX: TECH). This ETF has holdings distributed across the United States (89.6%), Australia (5.8%), Japan (2.4%), and Germany (2.2%) and has a “moat” filter that will only select companies that have built a competitive advantage around their businesses. All of this for a Management fee of less than 0.5%.

Innovative company shares do not always go up. An example of this is is the new Cathie Wood disruptive innovation stocks ETF – (ARKK). Early investors are very happy, recent investors not. However, with a 3-5 year time frame, exposure to the whole NASDAQ index – the top 100 of the (mostly) great NASDAQ companies must be a good thing.

This is not advice, but if I cant buy pizza scissors for Christmas – I might as well top up with some more NDQ or ASIA, or expand into TECH.

The Slack Buying Process … and August 2021 – End of Month Update

The moneychanger and his wife, by Marinus van Reymerswaele, 1538, Public Domain, via Wikimedia Commons

As much as Slack Investor hates retail shopping – he loves to have the opportunity to buy into companies. Like any new relationship, when you buy a stock, you are not really sure about how its going to work out – but its exciting!

I have never been good at predicting when the stock market will have a correction … and the current high valuations (PE Ratios well above the long term average) do make me nervous. However, Slack Investor would much rather be in the game than out of it and I have been looking for a few companies that would hopefully not suffer too greatly if a correction occurred in the stock market.

This is not advice … just an insight to the Slack Investor bumbling buying process. My rate of converting bought shares into winners of 55% is not that impressive – but my overall performance results are good.

I get heaps of buying ideas from investment sites such as Motley Fool, Livewire, ShareCafe. But I will always, always, check things out for myself before parting with any Slack Dollars. This involves a rigorous screening of the fundamental financial metrics PLUS a look at how the stock chart is going on Incredible Charts. This technical analysis consists of a quick scan to see if the chart is in a continual growth trend … or has just had a “breakout”, or broken out of a downtrend.

Let’s put on the buying boots. As well as the companies below, Slack Investor has also recently added to some small positions in PPK.ASX and TNE.ASX.

Slack Investor Buys Alphabet (GOOGL.NASDAQ)

Half of my buying cash went into an existing holding – Alphabet (GOOGL), This money making juggernaut is part of the new economy and I could buy this company all day. The first step is to go to the phenomenal MarketScreener.com. Registration is free on this site and they allow you to look at analyst data for up to 5 stocks a day.

Search for your stock and then finding the Financials Tab for that company. Firstly, I look at the chart Income/Sales and Earnings per Share. An increasing trend is good and, if the estimated earnings (2021 – 2023) are also increasing, I’m acutely interested. I do a quick check on debt levels. Alphabet is a cash king – has more cash than debt – solid tick.

Income statement for Alphabet (GOOGL on the US NASDAQ exchange) – from MarketScreener

I continue with MarketScreener to extract the Return on Equity (ROE), both past and forecast. I hope that it is above 15% – Big Tick. The final bit of vital information is the Price Earnings (PE) Ratio and it is here that I gauge whether the stock price is too high for Slack Investor. For a good growth stock, I try not to buy into companies that have a projected PE of more than 40-(50 at a pinch). The analyst estimates for GOOGL is a forecast PE of 23.0 in 2023 – Tick

YEAR2018201920202021(e)2022(e)2023(e)
ROE18.619.319.027.225.825.2
PE Ratio23.927.229.928.026.623.0
Table of fundamental financial metrics for Alphabet. The documented Return on Equity (ROE) and Price Earnings (PE) Ratio are shown for 2018-2020. Analyst estimates are shown for later years – MarketScreener.com

Slack Investor Buys NASDAQ 100 ETF (NDQ.ASX)

Not everyone has access to direct access to US shares – if you only have an ASX broker, then to get exposure to Alphabet, a good substitute is to buy the BetaShares NASDAQ ETF (NDQ) – Alphabet represents 8.1% of this ETF – and you get profit machines like Apple, Amazon, Microsoft and Facebook thrown in. I topped up my holding here as well.

The ROE for the NASDAQ Index is 17.7 and increasing (30 June 21) – Above 15, Tick. The projected 2023 estimate for the Price/Earnings Ratio for the NASDAQ Index is 22.47 – Below 40, Tick – Very reasonable for growth sector companies.

NASDAQ 100 Index 2020 PE Ratios and Forward Estimates of PE for 2021, 2022. 2023 – From nasdaq.com

Slack Investor Buys Coles Group (COL.ASX)

YEAR201920202021(e)2022(e)2023(e)2024(e)
ROE29.832.837.034.933.334.3
PE Ratio12.422.922.423.422.821.4
Table of Fundamental metrics for Coles Group . The documented Return on Equity (ROE) and Price Earnings (PE) Ratio are shown for 2019-2020. Analyst estimates are shown for later years MarketScreener.com

The Return on Equity (ROE) for this retail business is pretty impressive and, the PE Ratio would be pretty good for a growth company – but the Income Chart below reveals that Coles is not really a “growth” company – so the expectation is that the PE Ratios should be much lower, in the early 20’s or below would be the Slack Limits for slow growth companies.

Income statement for Coles Group (COL.ASX) showing a very gradual increase in projected income – Compare this with the Alphabet chart above – from MarketScreener

The income chart shows some pretty shallow growth and the slow earnings per share (EPS) growth makes the Coles Group something that Slack Investor would not usually be interested in. But, I go to Coles Supermarket at least twice a week and I actually like going there as a company part owner. Coles is in the “stable income” section of the Slack Portfolio rather than “Growth”. Even if the worst of times was thrust upon us and there was a recession in the next few years, a business like Coles will keep on performing. I would much rather put up with the price fluctuation of shares and have my money in a business like this at a projected yield of 3.5 – 4% p.a. than have Slack Dollars tied up in cash for 2 years in a Big 4 bank term deposit at 0.3%.

August 2021 – End of Month Update

Slack Investor remains IN for Australian index shares, the US Index S&P 500 and the FTSE 100.

There were significant rises in all followed markets (S&P 500 +2.9%, and the FTSE 100 +1.2%). The Australian stock market is also in record territory (ASX 200 +1. 9%). This is all happening during extensive COVID-19 related lockdowns in the populous South Eastern part of Australia.

Slack Investor is normally relaxed about most things, but I am moving to the edge of my couch and starting to get ready for action. Looking at the monthly charts for all the indexes, in these boom times, the index prices have been getting too far ahead of my stop losses for comfort. I have tightened up my rules for adjusting stop losses upwards.

All Stop Losses are live and are being moved upwards every month if the index price exceeds the stop loss by 10% or more. All Indexes have got this treatment this month – It is sometimes difficult to work out where to put the stop losses on the monthly chart. I usually go to the weekly charts and find a minimum on the weekly price range that is within 10% of the current price (see below). If the stock price is below the stop loss at the end of the week – I will usually sell at the next opportunity.

The weekly US S&P 500 Index chart showing an upward adjustment of the stop loss from 4056 to 4233 – Thanks Incredible Charts

All Index pages and charts have been updated to reflect the monthly changes – (ASX IndexUK IndexUS Index).

FY2021 Nuggets and Stinkers and July 2021 – End of Month Update

It’s not whether you’re right or wrong that’s important, but how much money you make when you’re right and how much you lose when you’re wrong. 

George Soros

Now George knows how to make a dollar and, to his great credit, is a generous philanthropist. I am sure, like any successful investor, that George looks back at times on his investment decisions. Slack Investor looks forward to this time of year when I can reflectively analyse my greatest investing failures. Fortunately, my stinker to nugget ratio was good this year.

The percentage yearly returns quoted in this post include costs (brokerage) but, the returns are before tax. This raw figure can then be compared with other investment returns. I use Market Screener to analyse the financial data from each company and extract the predicted 2023 Return on Equity and 2023 Price/Earnings Ratio on the companies below. This excellent site allows free access (up to a daily limit) to their analysts data once you register with an email address.

Slack Investor Stinkers – FY 2021

Growth stocks (High Return on Equity >15% and increasing sales) are fantastic companies to associate with as they are growing and hopefully, their earnings per share, are growing also. The downside to this is that these companies are usually sought after in the stock market and command high prices in relation to their current earnings because the “future earnings” of the company are priced into the current price. This gives them a high PE Ratio. Whenever there is a future earnings revision, or a stutter in growth, there is usually a dramatic drop in price.

Slack Investor has a look at his stocks every weekend on a free chart program (Thanks Incredible Charts!). I actually pay a small amount to get the chart data early in the morning. Both of my “stinkers” this year were actually “nuggets” from last year. For FY 2020, Appen +58% and A2M +26%. Such is the cyclic nature of some growth stocks.

Appen (APX) -24%

APX (2023 ROE 14%, 2023 PE 19) remains a company that puzzles me “the development of human-annotated datasets for machine learning and artificial intelligence”. The company has had a few problems due to COVID-19 and a hit to its underlying profit and increased competition. Slack Investor got out late last year at $25.87 as the weekly chart moved below the stop loss at $28.11. However, this represented a loss of 24% for the financial year.

The downward trend marked by the thick blue line is setting up niciely for one of Slack Investors favourite chart trading patterns – “The Wedgie”. When the share price punches through a downward trend line of at least 6 months … and the fundamentals are right, Slack Investor is interested. Given the forward PE for 2023 is a relatively low 19 – I might have another crack at this once the price has poked above the blue wedge line.

A2 Milk (A2M) -21%

A2M (2023 ROE 17%, 2023 PE 23) sells A2 protein milk products to the world. The actual benefits of the A2 only protein seem to be limited to easier digestion. Long term independent studies with large data sets are still in the works … but the marketing skill of this company is undisputed. COVID-19 brought big changes to sales with the collapse of the “daigou” market and worries about China trade sanctions. Slack Investor sold about half way through the downtrend – but not before taking a hit for the team.

Slack Investor Nuggets – FY 2021

A great benefit of investing in companies that have a high Return on Equity, and with a track record of increasing earnings, is that they sometimes behave as “golden nuggets”.

Codan (CDA) +161%

Codan - Niramar

What a company! Codan is a technology company that specializes in communications and metal detecting. It has made a major US acquisition this year and paid with cash. Sales are up and predicted to keep increasing. The high 2023 ROE 32%, and relatively low 2023 PE 24 (for a growth company) makes me think there will be more price growth over the next few years – I will try and top up my position this year on any price weakness.

Alphabet (GOOGL) +61%

(GOOGL – 2023 ROE 23%, 2023 PE 23) The Alphabet list of products continues to grow. I use a ton of Alphabet products every day and the company is growing fast into the cloud with cloud computing revenue jumping 46% in the March quarter. There are a few regulatory problems coming up with the US Justice department claiming that Google’s actions harmed consumers and competition. There is also the ongoing work of G7 nations trying to make international tech companies pay their rightful share of tax on revenues in each country.

Despite this, if there is one company that Slack Investor could invest in and then pay no attention to for 10 years, and still sleep well, … it would be Alphabet.

REA Group (REA) +59%

File:REA Group logo.svg - Wikipedia

The owners of RealEstate.com.au. which is the go to portal for house selling and buying (REA – 2023 ROE 38%, 2023 PE 44). The group has just completed an acquisition of Mortgage Choice and picked up a big chunk of a Mortgage software company. This expanding of the business must be good. 65% of Australia’s adult population are checking the site every month looking at property listings and home prices. However, the 2023 projected PE is very high (44). Using the Slack Investor bench marks, suggests the stock is expensive at the moment.

Integral Diagnostics (IDX) +37%

Integral Diagnostics | Medical Imaging Services | Australia | New Zealand

This medical image company (2023 ROE 16%, 2023 PE 24) provides diagnostic image services to GP’s and specialists. IDX seems to be getting a few tail winds with an ageing population and more demand for their MRI, CT and PET scans.

Macquarie Group (MQG) +36%

Commonwealth Bank Macquarie Group Finance Westpac, PNG, 1800x600px,  Commonwealth Bank, Australian Dollar, Bank, Brand, Finance Download

Macquarie is a complex business(2023 ROE 14%, 2023 PE 17) with a range of banking and financial services, and plays in global markets and asset management. The latter division looks for undervalued companies. Despite COVID-19, profits are increasing. The management seem to know what they are doing – Slack Investor remains a fan.

Betashares Global Robotics And Artificial Intelligence ETF (RBTZ) +36%

RBTZ ASX | Global Robotics & AI ETF | BetaShares

This ETF tracks the megatrend of robotics and artificial intelligence. Although the PE ratio is a bit high (2021 PE Ratio 37), this is a disruptive sector that should make gains against existing industries with the advantage of technology against rising labour costs.

Most honourable mentions to those other companies that returned over 20% for the tax year. Cochlear (COH) +34%, BetaShares Nasdaq ETF (NDQ) +33%, VanEyk MOAT ETF (MOAT) +32%, Vanguard International ETF (VGE) +29%, BetaShares HACK ETF (HACK) +31%, Vanguard Asia ETF (VAE) +28%, BetaShares QLTY ETF (QLTY) +25%. To these companies, I am grateful for your service.

Slack Investor Total SMSF performance – FY 2021 and July 2021 end of Month Update

A great year for shares, Chant West reports Super funds have delivered their strongest financial year result in 24 years, with the median growth fund (61 to 80% in growth assets) returning 18% for FY21. The FY 2021 Slack Investor preliminary total SMSF performance looks like coming in at around 22%. The 5-yr performance is a more useful benchmark to me – as it takes out the bouncing around of yearly returns. At the end of FY 2021, the Slack Portfolio has a compounding annual 5-yr return of over 21%.

Slack Investor remains IN for Australian index shares The FTSE 100 had a flat month (-0.1%) but rises in the US Index S&P 500 (+2.3%) and the ASX 200 (+1.1%).

The party with the US S&P 500 just keeps on going. As the S&P 500 has moved more than 20% higher than its stop loss on the monthly chart, I have adjusted the stop loss upward to 4056 from 3622. It is difficult to decide where to put the stop loss on the monthly US Index chart. In these cases, I go to the weekly chart and look for a “sensible place” to put the stop loss coinciding with a minimum value (dip) on the chart. The current stop loss is 8% below the end of month price.

US Index (S&P 500) weekly chart showing a moving up of the stop loss this month.

The US economy entered a recession in February 2020 and has now entered a phase of expansion (since June 2020). Slack Investor is nervous though and has his stop losses live for all Index funds. I will be checking these charts on a weekly basis for breaches of the stop loss.

All Index pages and charts  have been updated to reflect the monthly changes – (ASX IndexUK IndexUS Index).