The Real October 2019 – End of Month Update … and Australia’s debt binge

Apologies to my faithful email subscribers, two days ago an unfinished version of this post was released into the ether. Slack Investor has rudimentary skills in the blogging arts and didn’t know how to recall the post. Anyway … this is what it was supposed to look like – with all information updated!

Slack Investor remains IN for Australian index shares, the US Index S&P 500 and the FTSE 100.  The Slack Investor followed overseas markets are a mixed bag with a flat ASX200 (-0.4%), and a dropping Brexit plagued FTSE100 (-2.2%). The good old US has shrugged off chants of “Lock him up” for their president and the S&P500 has had a monthly increase of 2.4%.

The Federal Reserve bank of Cleveland have the probability of a US recession within the next year at 31.0%, this has been gradually dropping since a peak at 41% two months ago. However, the current value exceeds the Slack Investor threshold of 20% and my monthly stop losses for Index funds are definitely “switched ON”

All Index pages and charts  have been updated to reflect the monthly changes – (ASX IndexUK IndexUS Index).

Household debt – the couch is getting a little uncomfortable

According to 55,000 respondents to the ABC’s Australia Talks National Survey, debt is a major problem for the nation.

On an individual level, 37 per cent are struggling to pay off their own debts, with almost half of millennials reporting that debt is a problem for them personally …

Australia Talks National Survey
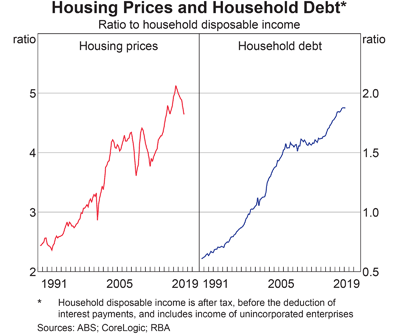
Australia may not be in the top four countries for Rugby these days but we are one of the world leaders in terms of household debt. In fact, we are second only to Switzerland. I am ashamed to say Australia’s Household Debt is world class and edging towards 200% of income. With such a big chunk of our disposable income leaking to debt, it is no wonder that recent interest rate cuts are not having much effect on the economy as Australian consumers try to tighten the belts. According to the Reserve Bank, it seems that, with stagnant wages growth, most are coping with their debt by reducing their consumption.
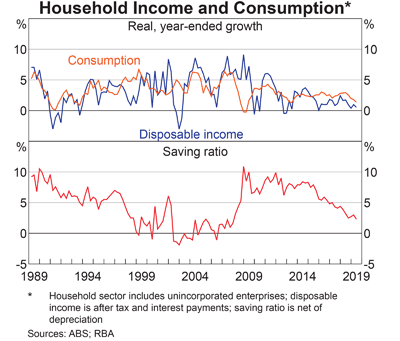
Basically, the Australian economy is facing a long period of sluggish demand growth as our record high household debt becomes a giant millstone around the economy’s neck.

From macrobusiness.com.au

Debt can be multi-headed with mortgage, credit card, personal loans and education components. The ME Bank survey has found that there is stress in some parts of the community. If your employment income is steady, in these reducing interest rate times, the fortunate have been able to keep up existing monthly payments to reduce overall debt. This is a good strategy. Most Australian homeowners are ahead of their payments – so there is a bit of a buffer. RBA statistics show that the average borrower is almost 36 months ahead of their required payments. Though, there are worrying signs in some households.

Of households with debt, there was an increase in the
number expecting they ‘will not be able to meet their
required minimum payments on their debt’ and ‘can just
manage to make minimum payments on their debt’ in
the next 6–12 months – 43% combined compared to
38% in December 2017.

ME Bank survey 

With the number of mature-age Australians carrying mortgage debt into retirement increasing rapidly, many are intending to use a portion of their super (which was supposed to fund retirement!) to try to extinguish their debts when they retire. The ME Bank Survey found that even with compulsory superannuation, only around 18% of households expect to ‘fund retirement with their own super’ (down four points in the past six months). The proportion of households expecting to ‘use both private savings and the government pension’ increased two points to 42%.

I hope that our politicians have a plan for all of this – although, as this involves a bit of thinking beyond the next election, I doubt it!

May 2019 – End of Month Update … and, that recession vibe

Slack Investor remains IN for Australian index shares, the US Index S&P 500 and the FTSE 100.  In what the cool investor analyst types call a “Risk Off” month there were big falls in Slack Investor followed overseas markets (FTSE100 -3.5%;  S&P500 -6.6%) – but for the moment, still above the monthly stop losses. Checking out the US Yield Curve indicator at GuruFocus shows a negative result  (Just … -0.05% though!) so my monthly stop losses for Index funds are definitely “live”.

The Australian ASX200 had a positive month (+1.1%) – but this was due mainly to the election of a “business-friendly” government on May 18. General nervousness prevails though.

All Index pages and charts  have been updated to reflect the monthly changes – (ASX IndexUK IndexUS Index). 

That Recession Vibe

Trump and Xi are shaping up for a trade war and I don’t like the smell of it … especially with news reports such as “If you want to talk, the door is open; if you want to fight, we’ll fight to the end,” said a Chinese TV anchor, capturing the mood in Beijing. – Image from Business Insider

Slack Investor is no great predictor of trends – But, whenever things are going well in the stock market, experienced investors naturally get skittish – Particularly when two belligerent world leaders are at loggerheads. There is a chance that all of this will get solved at the next G-20 in June. But Bloomberg analysts think it is more likely that the trade war will be long, messy—and expensive. Thanks Donald!

(The US economy is going OK) but … other countries remain sluggish or are slowing. Diminishing global growth could drag down the U.S. also. … although the Federal Reserve is now signaling a halt in its rate hiking, it has raised interest rates nine times since December 2015. At some point, those higher rates become the gravitational force that pulls down stock prices.

From Ray Martin at CBS News

All of this uncertainty is talked about constantly in the media and with trade war stuff thrown in as well, as all fans of The Castle know … ” It’s the Vibe!”, When all of this negative stuff gets too much. for a quick recession-busting refresher, try this Youtube highlights clip from the film.

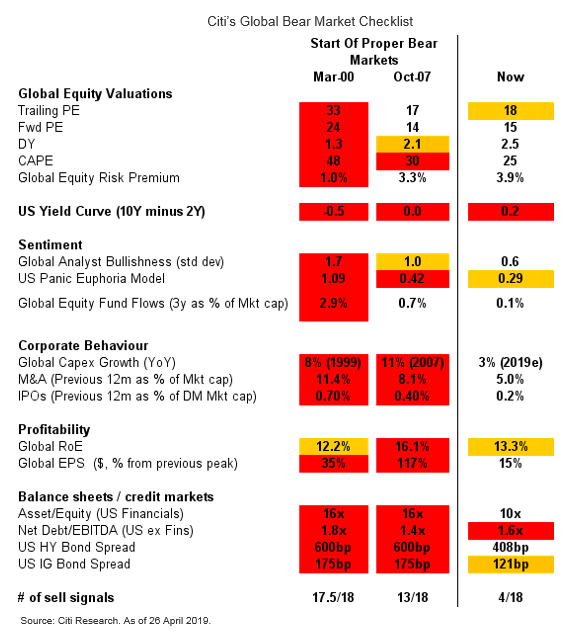
Slack Investor has mentioned one of the pre-indicators of a recession, the US Bond Yield Curve, which has just gone into the “Red Zone”. The economist boffins have been very diligent at Citibank and have tracked a range of 18 economic statistics up to the end of April. The US Yield curve is just one of these and is #6 on the list. They compare current statistics with those from previous “proper” recessions.

The Citibank Global Bear Market Checklist

Citi’s Bear Market Checklist (BMC) shows only 4 out of 18 red flags, and suggests that it is too early to call the end of this ten year bull market. In previous cycles, the BMC red flags have accumulated gradually before rising exponentially in the last year of the bull market. Citi analysts would be more concerned when 7-8 factors are flagging caution.

From Citi Insights

So Slack Investor does what he does best … and leaves the economics research to those who can do it well … business as usual. There are a couple of my individual stocks (CTD, CGC, PMC) that are on the slide and may need attention. I will look at their numbers and outlooks (and charts) again this week on Market Screener . But other than that, I will ease, ever so slowly, into the couch.

March 2019 – End of Month Update … and Revised Slack Index Method

Slack Investor remains IN for Australian index shares and IN for the US Index S&P 500. The dogs’s breakfast of Brexit still weighs heavily in my mind but I am buying back IN for UK Index shares – as the FTSE 100  has shown remarkable resilience to the fraught politics of Brexit and displayed a monthly uptrend. I will buy back IN to the FTSE at near the end of March value of 7279 (See UK Index Page).

There were rises in all  Slack Investor followed markets (ASX200 +0.2%; FTSE100 +2.9%;  S&P500 +1.8%).  All Index pages and charts  have been updated to reflect the monthly changes – (ASX Index, UK Index, US Index).

The Slack Monthly Index Trading Method – Revised

Last month I mused about the diminishing returns of the Slack Monthly Index Trading Method. I am still outperforming the “Buy and Hold” investor in all followed markets – but the advantage is slim. Per annum outperformance is 2.9%, 1.2% and 1.1% for the ASX, UK and US markets respectively. Not really fantastic results when you consider that I am missing out on the “buy and hold” dividends for the times when I am out of the markets.

The Slack Index method was devised with a lot of back-testing on 30 years of market performances and does really well when sustained bear markets occur as it gets out of the market at a hopefully early stage in the price downturn. Ideally, the Slack method should stay in the market for the smaller fluctuations (corrections <~10%) and get out of stocks before it becomes a full bear market. The problem with my current strategy is that I am getting “whipsawed” out of the market in these smaller downturns.

Connection between US Bear markets and Recessions

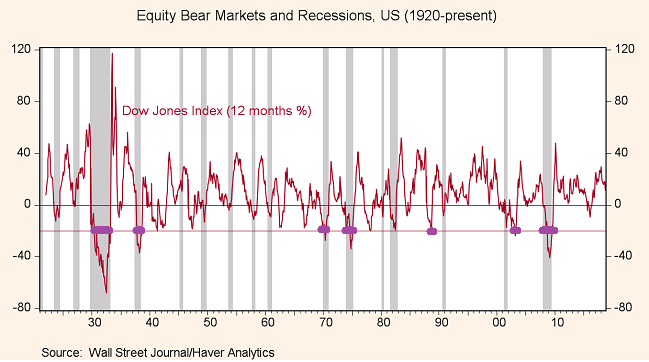
There is a link (not a perfect link!) between US bear markets (drops of more than 20%) and US recessions. In the chart below, the bear markets are shown in thick purple lines and they mostly coincide with US recessions (grey columns).

Modified chart 1920-2019 showing (in purple) the bear markets (where the red US stock prices fall >20%) and the US recessions shown as grey columns – From Gavyn Davies Financial Times – Original source Haver Analytics

All well and good so far, but we want to be out of the markets before a recession … how can we predict recession? Should we ask economists? A recent survey found that 3/4 of those surveyed thought there would be a recession before 2021. This is good to have in the mind … but not that useful in a practical sense. Economists have a poor record in predicting recessions. I don’t mean to be mean to economists … I also have had a career in prediction (weather!) and there are many similarities. Like the atmosphere, economics is complicated, not all factors are known, and not all processes are truly understood – But we do our best!

The “Inverted Yield Curve” as a predictor of US Recession

There might be an answer to predicting recessions by using the US Treasury Bond “Yield curve” . You may have heard about the yield curve (Probably not! but read here) – where short-term US treasury bill yields are compared to long-term yields. Normally, you would expect the yields on your money to be higher the longer that you lock it away – this corresponds to the periods above the red line on the graph below. Usually, the 10-year Treasury bill yield is greater than the 1-year bill yield. However, if there is a very a gloomy US outlook and the Feds are raising rates, you can earn more in the short term. This is when the yield difference [10-yr minus 1-yr (or 2-yr)] slips into negative territory, and you have an inverted yield curve – shown with the thick purple lines below. Note that these inverted yields usually occur one to two years before a recession (grey columns).


Chart showing where the yeild curve becomes inverted (purple lines) with the US recessions shown as grey columns. Modified from Morningstar report – original source Gurufocus.com

I love being the owner of companies and much prefer being in the share market than not. I will adopt the brand new exciting Slack Monthly method that should keep me in shares for the smaller downturns (corrections). I will ignore any monthly downturn signals UNLESS there is a sustained period of the US Inverted Yield Curve. I can check this at the end of the month at Gurufocus.com. This should maximise my chances of staying in shares until there is a threat of recession and the expectation of a larger downturn.

Jacinda Ardern shares a hug at a Wellington Mosque – From The Guardian

This has been a tough month for this part of the world – where, in Christchurch, a hate-filled idiot with a gun can a cause so much heartache for decent families. Great respect to the people of New Zealand and their exceptional leader Jacinda Ardern for bringing gun reform and such a strong message for humanity in the wake of this tragedy.

Power to love, tolerance and humanity.

Innovation Boom

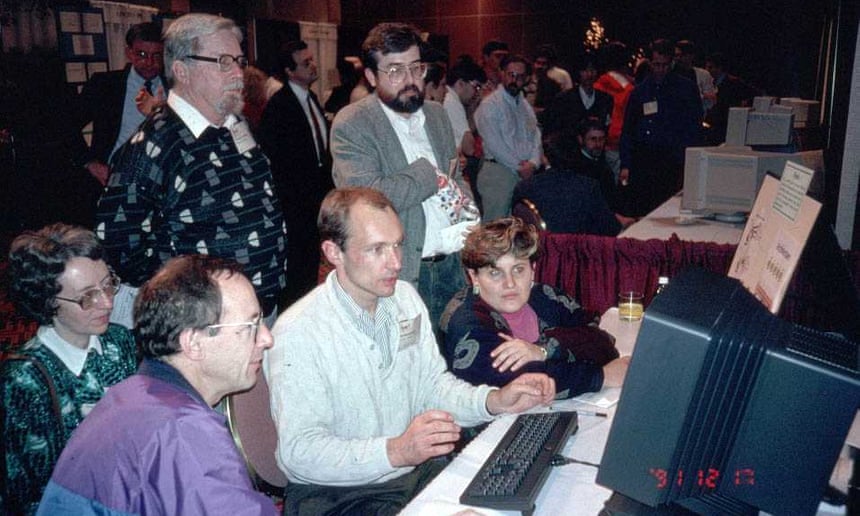
Tim Berners-Lee (in the white shirt) demonstrating the world wide web to nerdy enthusiasts at a 1991 conference in Texas.  – From theguardian.com

I have been lucky enough to live through one revolutionary innovative idea that has changed the world. The magnificent Internet – a global system of connected computer networks which has been developing since 1983 – but it was Tim Berners-Lee who introduced the publicly available World Wide Web in 1991 – This was a way of connecting the vast resources and documents on the internet through hypertext and URL’s.

It was 26 years ago, in 1993, when things really started to take-off with the first graphical web browser. Imagine how different the world was without the internet innovations such as Search Engines, Web Browsers, Real time streaming, emails, e-banking, online shopping, wi-fi and, my favourite, GPS linked to an internet map.

My portfolio is filled with companies that have made growing businesses based upon this innovative technology. Altium (ALU), Appen (APX), RealEstate.com (REA), Rhipe (RPH), and Seek (SEK) are all companies that make extensive use of the Internet.

The science man in me (Nerdy part) doesn’t really trust a graph without a vertical scale but I came across this image below from an Ark Investment report that really made me think. It puts other great innovations into some historical context and points to a series of new innovations that are predicted to have a large effect on economic activity in the future – One thing I don’t agree with on the image is the author’s notion of tapering off the impact of internet as we go towards 2020. But I can see that at least some of the innovations mentioned on the right will have a big impact on our future.


Impact of innovations on the economy – ARK Investment Management LLC, 2018 from Ark Invest

Part of being Slack is not wanting to research all of these head-hurting new ideas myself (but they do sound interesting!) and I think I should outsource this to someone else. Luckily there are a few research boffins at BetaShares that have come up with the BetaShares Global Robotics and Artificial Intelligence ETF – (RBTZ).

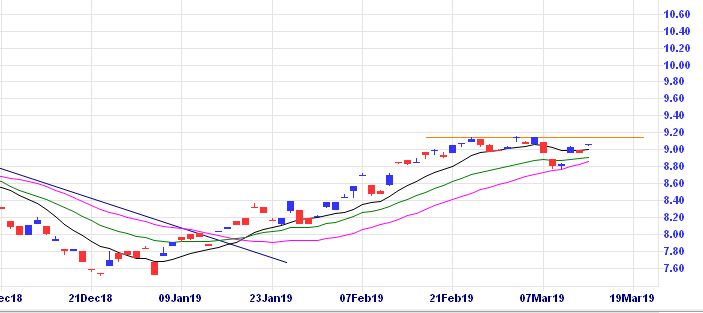
The ETF covers two of the emerging innovative sectors, Robotics and AI. This fund invests in an index of companies involved in Industrial Robotics and Automation, Non-Industrial Robots, Artificial Intelligence and Autonomous Vehicles and Drones. There is a cost – a management expense ratio of 0.57% ($57 per $10000 invested p.a.). Costs of investment are really important for the total returns on your investments. In this case, this is a cost that I am willing to pay and am looking for an opportunity to invest in the RBTZ ETF soon as I have finally unloaded my Challenger (CGF) shares and have a bit of cash to invest. I will wait till this chart shows some upward price momentum and breaks through the orange line “double top resistance” on the CGF daily chart at $9.15.

Daily RBTZ chart BetaShares Global Robotics and Artificial Intelligence ETF – from incrediblecharts.com

Oh … and in passing, thanks to Sir Timothy John Berners-Lee for that world wide web thing … it was a pretty good idea!

IMF … Not as cool as the IMF! … and BREXIN

From Source – Image may be subject to copywrite.

IMF The “Impossible Missions Force” made famous by the Mission Impossible Franchise and Ethan Hunt is a bit better known than the “International Monetary Fund” IMF which has the drier and more impressive mission to

 … ensure the stability of the international monetary system

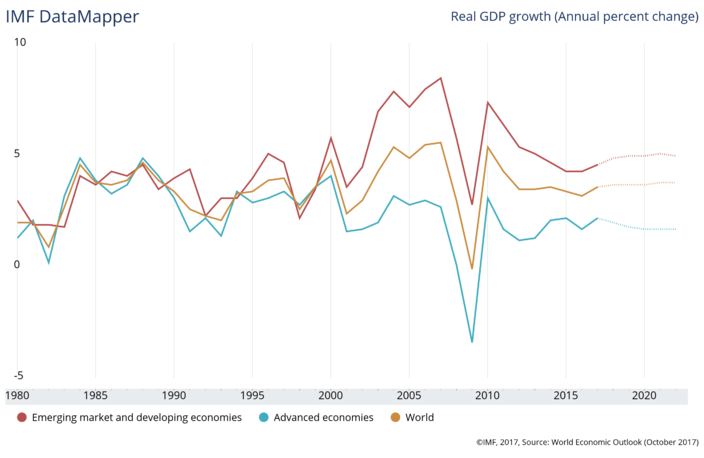
Some would say that this mission is as equally impossible as Ethan Hunt’s escapades but, like Ethan, they have had their successes. If you are one of the 189 membership countries you share your economic data with the IMF and they monitor and provide assistance with each countries’ economy – this may be with advice – or even to help out with a loan … and they also come up with projections for world economies. These are represented by the dotted lines on the chart below. As you can see, for 2018 and beyond, the boring IMF is quite optimistic on the overall world and emerging economies (China +6.4%, India +7.8%, Indonesia +5.5%, Philippines +5.8%) but less so for the advanced economies (US +2.7%, UK +1.5%, Germany +2.0%, Australia +3.1%). The percentages represent IMF Real GDP growth forecasts for each country in 2019.

From World Economic Forum

In fact, they have lifted their world growth forecasts for 2018 and 2019 to 3.9%, Now these are just projections based upon a forecast of buoyant trade and investment ( as well as recent US tax reforms). These projections are not set in stone and subject to world events – Yes I’m talking to you Donald! – but they are reasons for optimism. I am glad to be diversifying my risk by being a holder of the Vanguard Asia (Ex Japan) ETF – VAE.

Long live the IMF – impossible mission accepted!

Brexin

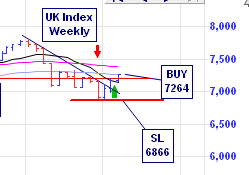
FTSE 100 (UK Index Weekly chart – From Incredible Charts

In a whirlwind cycle … within 2 weeks of getting out of the UK Index, I’m back in! – this is just part of the way that markets move sometimes. Although Slack Investor prides himself on the minimization of decisions, through looking at historical data on the ASX over 40 years,  he has found that it is advantageous to act on weekly signals to get into the stockmarket and stick with monthly decisions on getting out of the market.  As a result, the weekend reading of the FTSE 100 chart has given me a buy signal at 7264 and a new stop loss of 6866. More detail on the UK Index page.

Australia … Dumbing Down!

From abc.net,au

Further reading of the excellent article referred to in my last post by Kerr Neilson – The Rise of Asia – has got the Slack Investor onto one of his hobby horses. In a previous life, before my main working stint as a meteorologist, I was a maths and science high school teacher in Australia, UK, Jamaica, US and PNG. With the zealotry of an ex-teacher, I have been keeping a loose eye on the education system in Australia and … I don’t like what I see …

There is an international (OECD countries) test that measures student skills (in mathematics, science, and reading comprehension) called the Program for International Student Assessment (PISA). Shown below, 7 of the top 10 positions were filled by Asian countries. In 9 years, Australia has fallen from no. 9 in 2006 to no. 21 in 2015. The UK ranked 23 and has not changed much in the rankings. The US ranked 31 and also has had a declining performance this past 6 years. There are arguments that these absolute rankings can be misleading, but they are presented below.

2015 Rank Country 2015 Average Score 2006 Average Score Change In Rank (2006-2015)
1 Singapore 552 543 +1
2 Hong Kong (China) 533 542 +1
3 Japan 529 517 +7
4 Macao (China) 527 509 +10
5 Estonia 524 516 +6
6 Chinese Taipei 524 526 0
7 Canada 523 529 -2
8 Finland 523 553 -7
9 Korea 519 542 -5
10 B-S-J-G (China) 514
11 Slovenia 509 506 +5
12 Ireland 509 509 +3
13 Germany 508 505 +4
14 Netherlands 508 521 -6
15 Switzerland 506 513 -3
16 New Zealand 506 524 -9
17 Norway 504 487 +11
18 Denmark 504 501 +4
19 Poland 504 500 +4
20 Belgium 503 511 -7
21 Australia 502 520 -12

Source: OECD (PISA)

What is wrong and how can we fix it …

Smarter people than myself have been contemplating this problem. Most of the information below comes from a Conversation article “Six ways Australia’s Education system is failing our kids”. .. and the answer is not just spending more money.  Education spending in Asia is around 2-4% of GDP and lags that of Western countries (about 5%).  Perhaps a clue can be found in the importance that other countries place in education – In addition to normal schooling, around 80-90% of Asian families are willing to give their kids private tuition, compared to just 20-30% of households in western countries.

The solution to this alarming relative fall in standards is complex but a good start would be to bring Education more to the forefront of Australian minds. Germany had a similar fall in its PISA scores in the year 2000. However, in contrast to Australia, it started a national conversation that saw education on the front page of newspapers for the next two years! Germany has since greatly improved its ranking.

There seems to be a morale problem with teachers. Gabrielle Stroud reports that new teachers complain of a lack of support and have difficulty getting  secure full-time jobs. Experienced teachers complain of the many non-teaching duties that they have to do and they don’t have time for mentoring younger staff. Also it seems that teachers are not hanging around …

Australian Bureau of Statistics suggest 53 per cent of people who hold a teaching degree do not currently work in education. – from abc.net.au

A few of the distressing facts from the Conversation article

Australia ranks 22 out of 37 on the OECD league table that measures the total investment across education as a percentage of GDP.

In maths and science, an average Australian 15-year-old student has the problem-solving abilities equivalent to an average 12-year-old Korean pupil.

Australia is just about the only developed nation that does not make it compulsory to study maths in order to graduate from high school.

Teacher education degrees had the highest percentage of students entering with low University entrance scores.

You cannot expect top performances if we recruit our teachers from below average students. Perhaps we should take a lead from Singapore, where  the government has focused on a centralized system of education and a key factor in their ranking rise has been the standard of teaching, recruiting their teachers from the top 5% of graduates.

“Singapore invested heavily in a quality teaching force – to raise up the prestige and status of teaching and to attract the best graduates,” – Prof Sing Kong Lee, Nanyang Technological University

From Rise of Asia

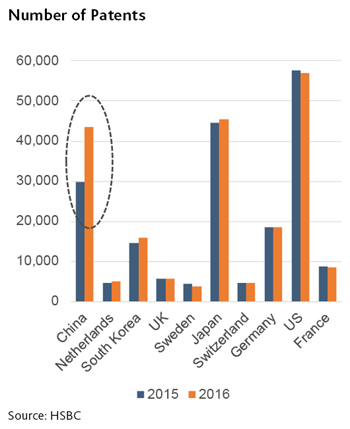
Whatever we do, we must do it soon and hold our politicians to account for this depressing trend. The march to be successful in the future depends on ideas and technology –  and the growth trends are definitely in China’s favour.

I haven’t even started on the sparsity of financial education in Australian schools … I think I had better go for a lie down!

November 2017 – End of Month Update … and the rise of the Asian Middle Class

Slack Investor remains IN for US, UK, and Australian index shares.

… and further gains for the Australian Index (+1.0%) and the US index (up 2.8%).  The UK Index dropped 2.2% in November due to what the Financial Times attributes as the “Firmer Pound contribution”.

Slack Investor is on the couch again and

From Pixabay

marvels at the sage judgement of the Financial Times – and most other financial publications that always assign a reason for the random walk of market fluctuations after the fact.


Asian middle class on the rise

While on the couch, Slack investor has an ear out for world affairs and came across an article from the accomplished fund manager (and Asia Buff) Kerr Neilson – The Rise of Asia – worth a full  read if you have the time. The article points to the need to consider Asia, and its effect on the world economy, over the next 10-20 years. It is a powerful collection of facts e.g,

  • China and India have grown their economies consistently at 6-7% for the past 20 years – they are now 4 times bigger than they were in 1998.
  • When measuring purchasing power, their combined GDP of US $33 trillion is 50% larger than either the US or the EU!
  •  China and India originate nearly 120 million high-spending overseas travellers each year.

The last point is backed up by CNN Money who report that the number of Chinese tourists travelling internationally has more than doubled to 120 million people over the last five years – 1 in every 10 international travellers now comes from China. 

Chinese people tend to begin traveling abroad once their household earns about $35,000 – from CNN Money 

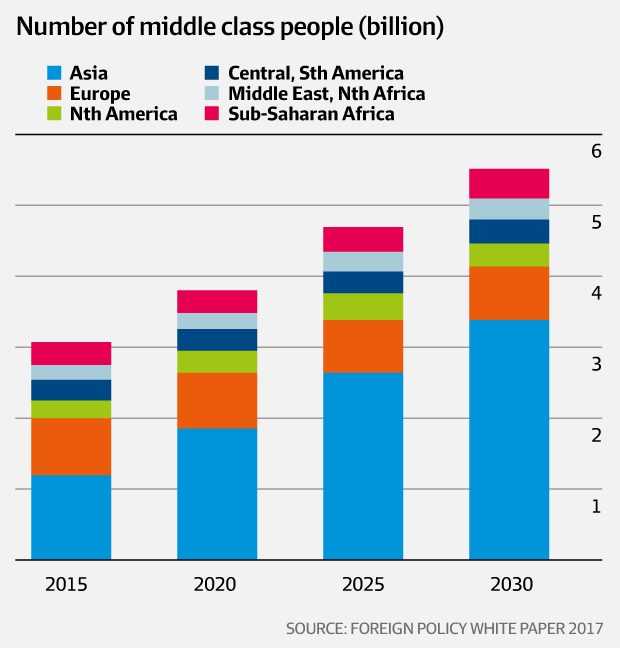
The rapidly rising middle class of these countries is behind this increased tourism and the graph below indicates the influence of these two economies will be on the rise.

Sourced from Australian Financial Review

Mental Note Slack Investor – Look for Asian themes in your investments.

All Index pages and charts  have been updated to reflect the monthly changes – (ASX, UK, US).


Cryptocurrency … Kryptonite!

Bitcoin is everywhere in the media. Tales of fortunes made from just investing in this cryptocurrency and waiting till it rapidly accelerates in price – it sounds like the ideal investment vehicle for the Slack Investor!

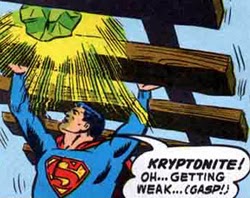
Superman encounters Kryptonite and starts to lose his powers … Image found here … but original material from DC Comics

Well … not really!

Slack Investor is a student of history and feels like this has all happened before … Some people may be able to make their fortunes through this type of vehicle … but I reckon you would be taking a big risk … Cryptocurrencies might become Kryptonite for the casual investor.

There have been many famous “bubbles” in history, see The Bubble Bubble, The trading commodity may vary but they they all have some things in common, a period of “rampant speculation” … where the price rises sharply …  and an eventual crash. Bitcoin has been through several of these cycles already in its brief history – and each time so far has gone on to make higher prices.  Those around in the late 1990’s may remember the dot.com bubble the bubble burst in a big dip of the NASDAQ index shown below left.

Dot-com Bubble Chart (Nasdaq Bubble)
The dot.com bubble shown on a late 1990’s NASDAQ chart from thebubblebubble.com

The South Sea Company bubble 1716-1720, from thebubblebubble.com


In the days of the British Empire, in the early 1700’s, the South Sea Company purchased the rights to trade in the South Seas from the British Government and then went to the public to raise money. This was a time of prosperity for some and the money flooded in … and the price rose spectacularly (above right). Despite having this great trade monopoly, the company was mismanaged and eventually failed when the news came out that the management had sold their shares.

A hero of Slack Investor’s, and not a bad scientist and mathematician, Isaac Newton became involved in this saga as an investor. The quote below comes from the updated version of Benjamin Graham’s  “The Intelligent Investor,” by Jason Zweig.

Sir Isaac Newton

“Back in the spring of 1720, Sir Isaac Newton owned shares in the South Sea Company, the hottest stock in England. Sensing that the market was getting out of hand, the great physicist muttered that he ‘could calculate the motions of the heavenly bodies, but not the madness of the people.’ Newton dumped his South Sea shares, pocketing a 100% profit totaling £7,000. But just months later, swept up in the wild enthusiasm of the market, Newton jumped back in at a much higher price — and lost £20,000 (or more than $3 million in [2002-2003’s] money. For the rest of his life, he forbade anyone to speak the words ‘South Sea’ in his presence.”

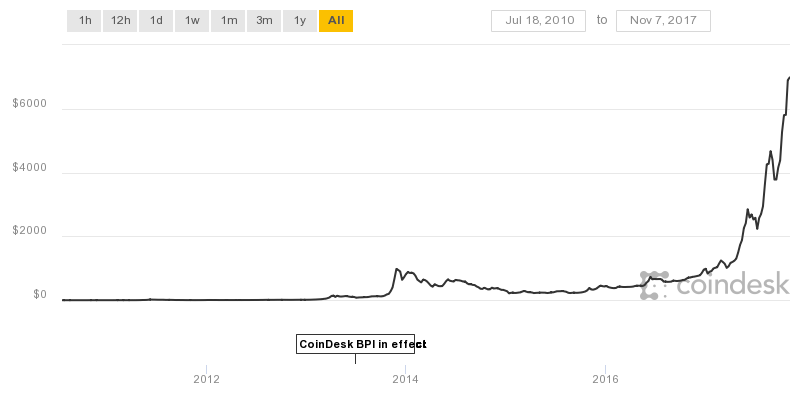
I have included a $USD price chart for Bitcoin – worth over $7000 USD on 7th November, 2017. The chart is below and it maps a spectacular rise since 2010 – when you could pick up a bitcoin for under a dollar! It might be possible to make money using the “greater fool” theory of investing – but your timing had better be impeccable –  it looks like a “bubble” to me!

The bitcoin price in US Dollars – From coindesk

Rather than “Bubble” investing, Slack Investor likes to invest in a diverse range of growth companies – these are real businesses that hopefully have unique products. They are businesses that are run well and are forecast to grow. Financial independence might take longer this way … but the results are surer, and I sleep well at night. I will leave Bitcoin to the speculators.

After all, if a very clever bloke like Issac Newton couldn’t make money on a bubble … what hope does Slack Investor have?

Infrastructure … Boom!

There are plenty of naysayers in the market today but, from the couch, Slack Investor has been noting a few things.

Since 2008, the Reserve Bank of Australia (RBA) has been cutting interest rates from 7.25% to 1.5%. This is the right thing to do for this independent body when the country is recovering from a bit of trouble and they have helped Australia avoid a recession for over 25 years.

Portrait of Isaac Newton at 46 in 1689 by Godfrey Kneller – Wikipedia

However, the great mathemetician and scientist,  Issac Newton (1642 -1727), the inventor of Calculus and the Laws of Motion – and heaps more – had a few insights.

To any action there is always an opposite and equal reaction

It is not quite opposite (or equal!) but there are a few consequences of these lower interest rates. This cheap money, together with overseas investment (and a few other factors) have helped home prices in Sydney increase  76% from December 2011 to March 2017. The state government “clips the ticket” on all of these home transfers and the state budgets of New South Wales (and Victoria) are moving rapidly into big surpluses as home prices rise. Where will this money go?

Australian politicians (of all persuasions) have been getting a lot of (mostly deserved) bad press – but behind the scenes, some good things are going on. When money is cheap, this is exactly the right time to borrow for nation building assets. According to a recent Milford analysis for the next budget cycle, the NSW Government will be spending an additional $4.4 billion on school upgrades, $7.7 billion on health infrastructure and a staggering $72.7 billion on infrastructure.

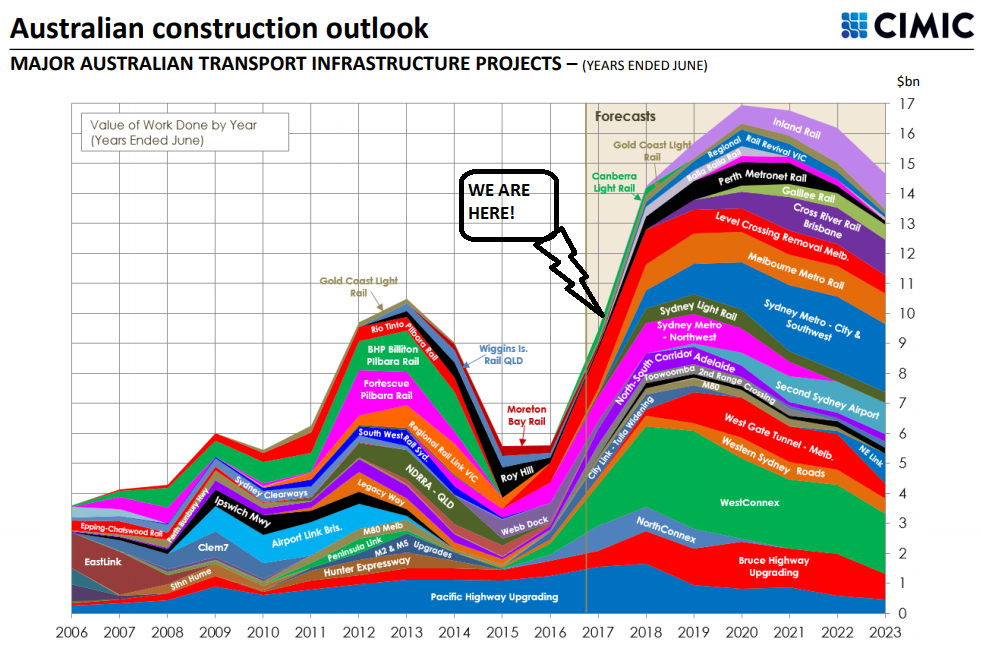
An AFR article quotes the Commsec economist Craig James. He laments that the focus has been on “negatives such as high household debt, weak consumer sentiment and low wages growth, research published this week shows almost $100 billion in local, state and federal government spending will hit the economy this financial year alone.” The cool graph of proposed infrastructure spending is presented below – please click for image for greater resolution.

Modified From Source

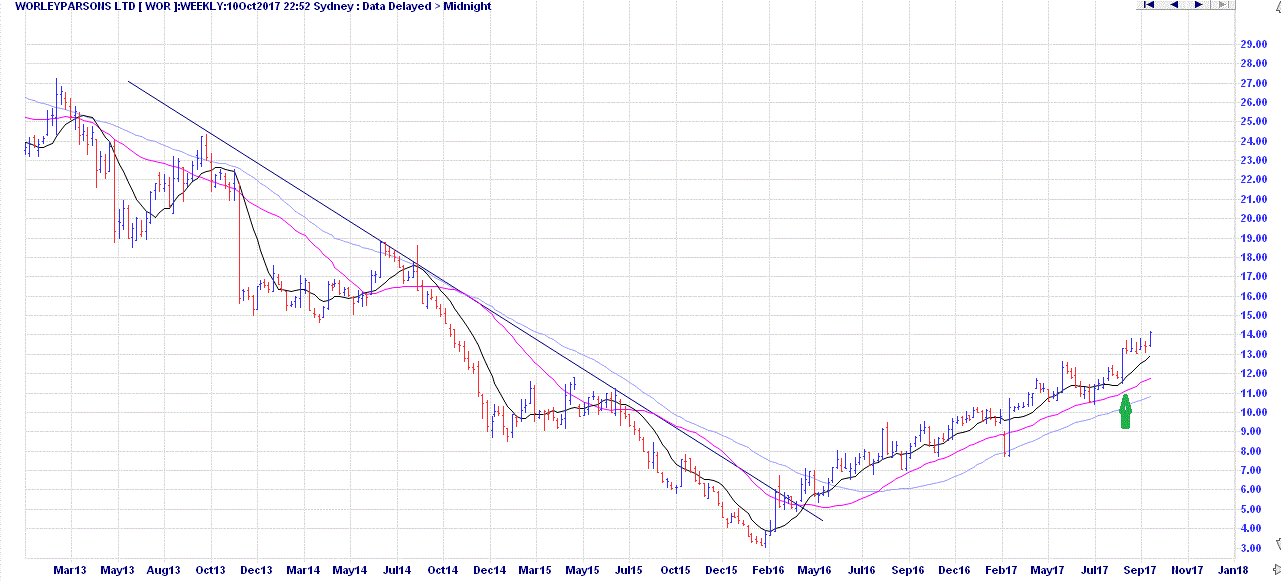
 Slack Investor generally does not think in terms of investment themes, but the chart of an Australian infrastructure firm WorleyParsons Ltd (WOR) has been speaking to him. After a long term down trend in price, WorleyParsons management have cut costs and are riding the wave of this infrastructure development since the start of 2016. This is not advice, and Slack Investor is a bit late to this party, but he has cut himself a slice of the WOR cake. Click on chart for greater resolution.

September 2017 – End of Month Update … and “Ultimate Job”

Slack Investor remains IN for US, UK, and Australian index shares.

A mixed month for all markets that I follow – The Australian Index slumped 1.6%, the UK index flat (-0.5%) and the booming US market up 2.1%. Slack Investor stays on the couch and almost does nothing …

In response to the US SPY Index rising over 20% from the last setting of the stop loss at the end of December 2016. This movement triggers a reassessment of the stop loss from 208 up to 232. Hopefully this will lock in some profits when the inevitable correction on the US Markets occurs.

… and now to Slack Investors ‘Ultimate Job’ The AFR reports that the Reserve Bank of Australia (RBA) could potentially set a record for doing nothing. 

The new ‘Guvner’ riding the horse of the Australian Economy. From HeraldSun.com.au

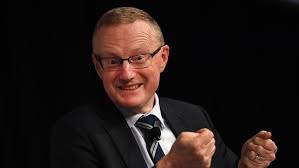
The RBA Governor Philip Lowe who, by the way, is yet to match Slack Investor’s favourite RBA chief (Glenn “Sexy” Stevens) for lack of charisma, is looking at an unusual record … the longest stretch of monetary policy inaction in more than 20 years. Dr Lowe is only in the second year of his new job.

Australian economists expect no movement from the “emergency low” cash rate of 1.5% this month which will be the 13th month in a row  of inaction. However, for a record to fall into place, all he has to do is nothing right up to the May 2018 board meeting. This would be no action for 18 straight meetings – beating the record 17 meeting run of inaction for between early 1995 and July 1996.

No wonder this is Slack Investor’s ideal job! Pulling the levers on the Australian economy comes with a salary of over a million dollars – and, I don’t really begrudge him that … (there are meetings to attend!) … this is a wage package that wouldn’t get him into the top 50 of Commonwealth Bank executives! Don’t get me started here!

Dr Lowe is sitting tight because of the sensitive nature of the Australian economy with very low wage growth and the large amounts of household debt that Australians have. But other world economies are starting to climb out of the exceptionally low borrowing rate world. There have been rate rises in Canada and England. The US Federal Reserve chair Janet Yellen has flagged further rises this year … and, this is not such a bad thing as it means that she is starting to think that the US economy is getting stronger.

I have updated all Index pages and charts to reflect the end of month data. My Portfolio page is also updated as it is the end of the quarter.