It serves an investor well to occasionally lift themselves away from the day to day stresses of the world – and the trials of owning a share portfolio!
ASX 200 – The Australian Index
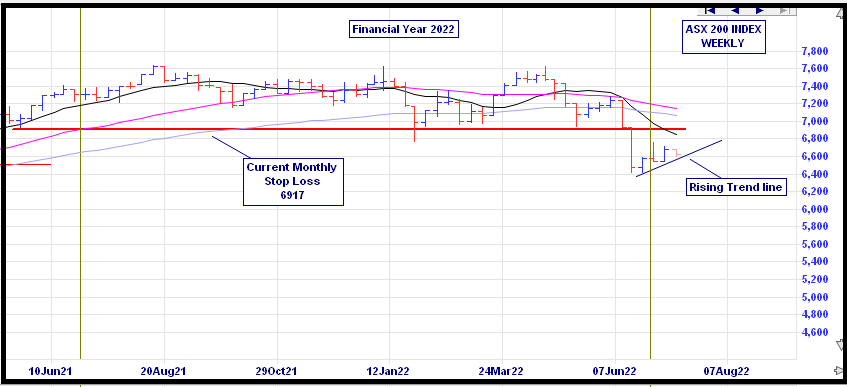
My previous post outlined a few of the difficulties of market timing and my decision to be tentatively out of the Australian Index according to my “market timing rules”. I also try not to trade against the market trend … and I would not sell while the weekly chart was looking positive.

So far this has been the case, with the weekly chart just above the rising trend line. I will sell if the ASX200 is below the trend line and still below the stop loss at the end of the week. This gets to one of the problems of market timing – you can set up the most definitive strategy that will give you an objective selling point – but my heart is not in it as Slack Investor believes that the ASX 200 represents reasonable value at the moment. I am actually looking forward to the end of my 20-year market timing experiment – even though it does have the useful purpose of giving Slack Investor something to do in a market downturn.
Lifting the gaze
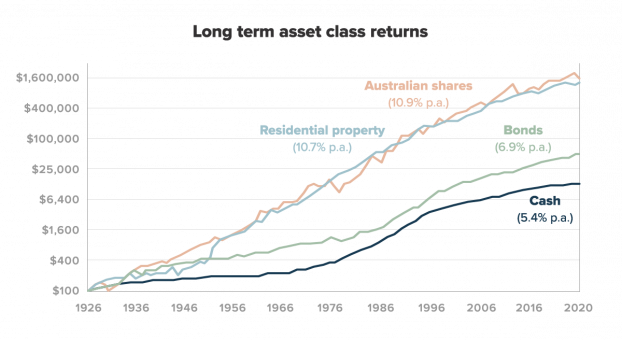
My absolute favourite way of lifting the gaze is to look at the Vanguard Asset Index chart over a long period. However, a later version than 2021 isn’t due out till mid August 2022 – so I have just shown last years version. The Long term asset class returns chart shown below – in a logarithmic scale, show that the asset classes of Residential Property and Australian shares – are the only really worthwhile games in town. When things just get too much in the day to day trading world – just sit on the couch and gaze in wonder at these two charts … and then perhaps doze off.


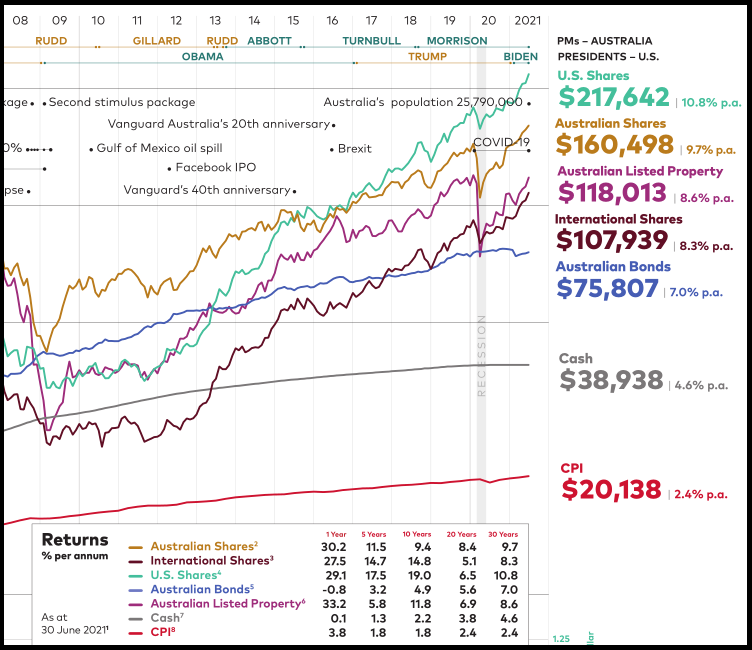
Extract from the 2021 Vanguard Index chart (Just the 2008-2021 portion) – the dollar values on the right are the results of investing $10000 in index funds in each asset class for 30 years (since July 1991). – Check out the full glory of the Vanguard 2021 PDF chart – Click for better resolution.
