

Slack Investor is not known for his fast work … and have often taken the couch when action was probably needed. There are some stocks that I will hold for the long run, and their weekly charts are not of big concern to me. However, about half of my portfolio is on a weekly watch – I review the charts on a weekend and cast the Slack Investor jaundiced gaze over each stock that I own (Thanks Incredible Charts!)
“You can observe a lot by watching”
Yogi Berra – American Baseball Legend and Master of Tautology
I do have some routines though …
Daily
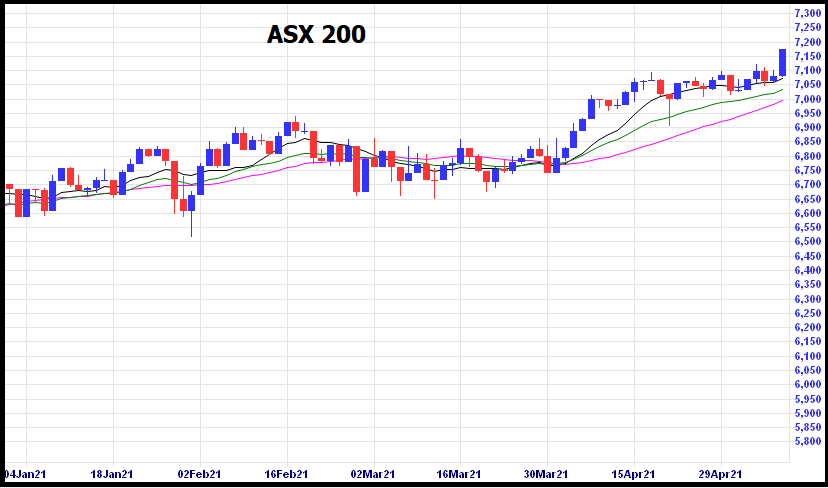
This is the least satisfying timescale and, if I could successfully train myself to ignore this daily oscillation of my investments – I would. The reason to avoid daily swings of the share price is that I have absolutely no idea about whether the price of a stock or index will go up or down on the next day – the share price is determined by others! In the chart below, in the first 7 days shown, the daily index went down, down, up, down, down, up, up, etc – monitoring daily prices can be frustrating!
I have to admit that I follow my investments every few days through a portfolio in Yahoo Finance and will download prices to my accounting software – the free Microsoft Money Sunset International Edition available at the most excellent Ameridan’s Blog. I download share prices into Microsoft Money with MS Money Quotes with a 10 USD lifetime licence. In the USA, Personal Capital is recommended.
I am happy to say that, when on holiday, or busy, I have no need to monitor on the daily timescale. Regardless, no decisions are made on this daily basis.
Weekly
Weekly is where the “rubber hits the road” for Slack Investor – and I look forward to my weekly sessions with my portfolio. I set aside an hour on the weekend to make sure my portfolio prices are updated and the charts are reviewed. The weekly time scale smooths out a bit of the volatility and I then open up Incredible Charts to scroll through my portfolio.
Incredible charts offer a free month sign up and then $9.95 per month for access to worldwide updated delayed charts daily from 6pm Australian time. This package is not in “real time” and does not suit a day trader. But for an investor on my slower time scale, it is very good value. These charts open up the whole world of technical analysis as it allows you to monitor trends in your stocks and mark in trend lines and stop losses.
I have always used the weekly charts to make decisions on buying a company – looking for a momentum shift in the trading using the Directional Movement System. I also like to trade a “breakout”, or a “wedgie”
Monthly
This is the timescale when I am most happiest and would like to make decisions just every month. After a life of work where decisions were a constant grind – It is a gift not to make decisions!
It is still my aim to make selling decisions monthly – but things seem a little precarious lately and, for now, I am on a weekly decisions cycle for selling. The sell happens when a stock price finishes below my stop loss at the end of the week/month (see Technical Sell below).
Yearly
This is the “Look at yourself in the mirror” period where Slack Investor does the evaluation of his portfolio performance against benchmarks at the end of each financial year. Although the financial year ends at June 30, it usually takes until the middle of August for me to get my final results and benchmarks together. I present my results at the annual Financial Year Results post.
Special Occasions Selling
Slack Investor is in one of those right now and he has to free up some cash to by selling some shares. I like to do things a bit methodically and here is my process for a sell.
Technical Sell
This is my first port of call. Technical Analysis uses charts and trends and I have been watching the charts for the past 4 weeks for a technical sell signal in my portfolio. For me, this happens when the stock price falls below the pre-determined stop loss that I have set. I will then try to sell at the start of the next week/month. My rules are not rigid here, if the stock starts to rebound after I have made my sell decision, I might stick with it for a little while longer.
Another technical signal is when a stock loses its momentum – but this is a more subjective signal than when a stock simply moves below a line.
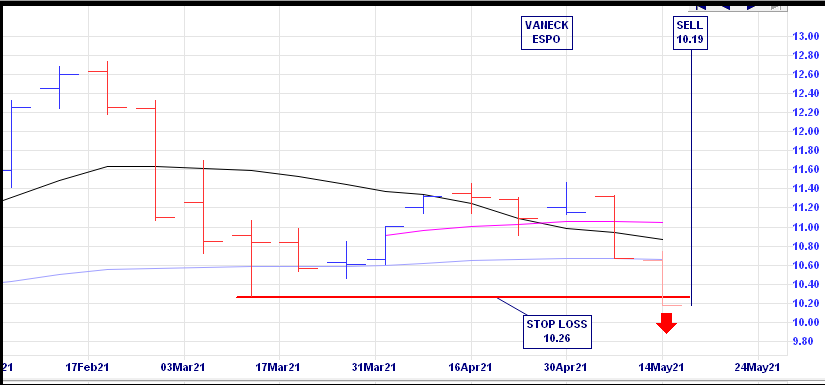
Slack Investor bought into ESPO in October 2020 at $10.39 and sold this week at a small loss $10.19. The stock didn’t grow like I thought it would – but that’s fine. I like the concept of this ETF but I am happy to be out for now and look forward to be getting back in when a strong upward trend establishes itself.
I was also able to exit on a technical sell for the Betashares ASIA ETF and I am not sure what is going on here as I thought the tailwinds for this sector were good. Small profit this time and will get back in if the trend changes.
Fundamental Sell
Fundamental Analysis revolves around trying to determine the real value of a stock by looking at its financial data (e.g, Price/Earnings ratio, Return on Equity, Debt, etc) over time and, in reference to its competitors. This is a much more complicated process.
If Slack Investor can’t find a technical sell, I look for a fundamental sign. I will list all of my sellable stocks (Shares that I don’t hold for “the long run“). The first step is to get some financial data on each company from the very good Market Screener then put them in a table and hope that something stands out as a sell. A sell signal might be a trend of falling earnings, increasing debt, or decreasing Return on Equity (ROE). I also get nervous about a stock if its predicted (+ 2 years) Price Earnings (PE) ratio goes over 50. Fortunately, I didn’t have to resort to any fundamental analysis this this time … and this approach probably needs a post in itself.
In the meantime, like my pumpkin friend … always watching …
while the peaches are asleep !!
Yes Sandy … those peaches really aren’t pulling their weight – and the paper bag … what a bludger!