

Slack Investor introduced one of his favourite technical chart patterns in January 2019 … “The Wedgie”. I promised to look at the results in 12 months time.
Looking at charts of stock prices and trying to recognise useful patterns is known as Technical Analysis. Some investors do not have faith in in this dark science … and Slack Investor would not act on chart signal alone – the underlying company must be sound with established earnings and good prospects.
“The Wedgie” is Slack Investor’s name for a pattern more boringly known as the “breaking of a long-term downtrendline“. You have to admit … “the Wedgie” has a more of a ring to it.
The breakout from a Wedgie on a share price chart is discussed in detail in the original post and it is when the share price rises out of the wedge pattern. The top of the wedge downtrend line should be drawn for a period of at least 3 months and connect at least 2 (and preferably 3) descending high points.
This pattern has the potential to be a trend “reversal” – Lets see how it has performed over 12 months for the Slack Investor bought stocks. The first 3 are all still in the portfolio.
CSL – Commonwealth Serum Laboratory
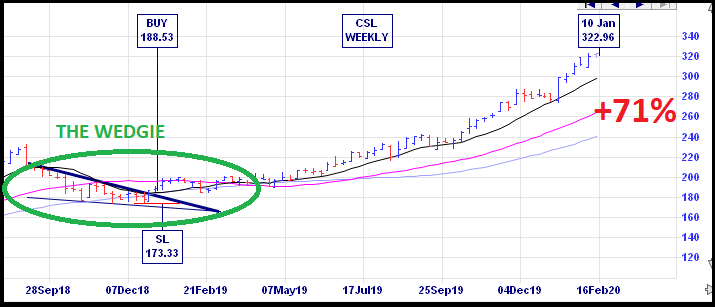
This great company share price was consolidating a year ago but has recently boomed with a 71% gain.
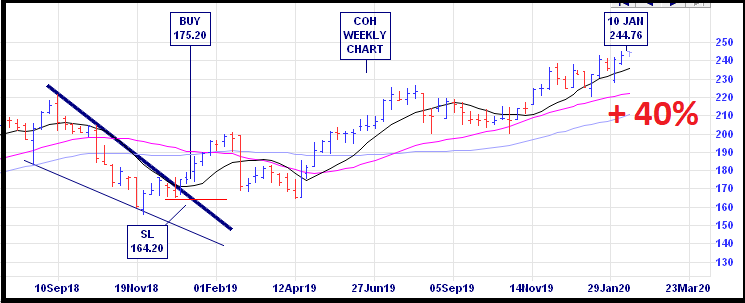
COH – Cochlear
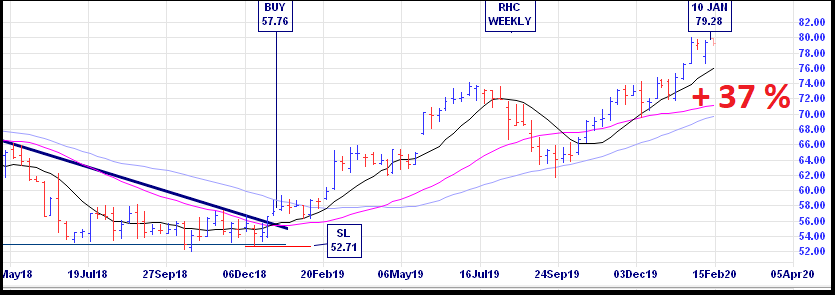
RHC – Ramsay Health Care
In the January 2019 post, ALU, APX, CAR, CCP, FPH, SEK, and A2M were also mentioned as breaking the wedgie pattern. All of them have made very good gains since the breakout from “the wedgie”. Gains of 73%, 64%, 48%, 76%, 74%, 29% and 25%, respectively – from January 18, 2019 to February 10, 2020. Slack Investor thinks that, so far, the Wedgie is working in most cases! – but, it has no guarantee – vigilance is required.
The Wedgie does not always work, CGC – Costa Group –
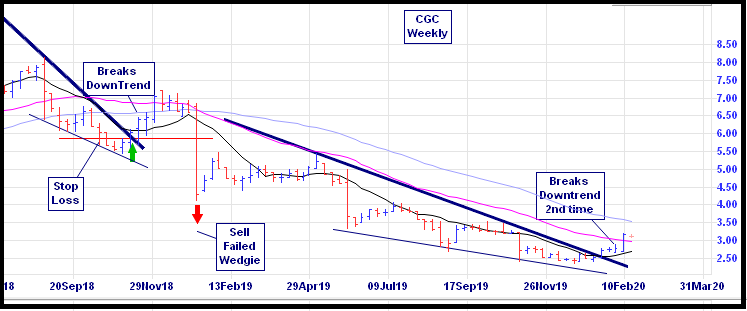
CGC was not mentioned in the original post and clearly the first break of the downtrend in November 2018 lost a bit of steam due to drought and supply problems – Slack Investor was, sadly, an investor in this stock at the time – and it was a loser! This is an example of the wedgie pattern NOT working. However, for all of 2019, CGC has been in a long-term downtrend but the pattern is starting to get interesting again as the longer the downtrend line the more bullish it will be when the stock breaks above the trendline.
As always, however great the pattern may look, Slack Investor is interested in the fundamentals of this stock before he will invest. Wisetech (WTC) is also breaking its Wedgie. Using marketscreener.com, CGC has a good 2021 forecast PE and yield, but the 2021 ROE is too low (<15%). WTC has good Return on Equity (ROE) but the 2021 forecast PE is too high for me (Slack Investor likes the forecast PE to be less than 40-50) … So, despite good looking technical patterns, it is no investment from Slack Investor for these two.
| SI Wedgie 2020 | P/E 2021 | Yield % 2021 | ROE % 2021 | |
|---|---|---|---|---|
| Costa Group | CGC | 17 | 3.3 | 9 |
| Wisetech | WTC | 82 | 0.2 | 21 |
Let’s visit CGC and WTC in 12 months for the sake of curiosity. Long live the Wedgie!