November 2017 – End of Month Update … and the rise of the Asian Middle Class

Slack Investor remains IN for US, UK, and Australian index shares.

… and further gains for the Australian Index (+1.0%) and the US index (up 2.8%).  The UK Index dropped 2.2% in November due to what the Financial Times attributes as the “Firmer Pound contribution”.

Slack Investor is on the couch again and

From Pixabay

marvels at the sage judgement of the Financial Times – and most other financial publications that always assign a reason for the random walk of market fluctuations after the fact.


Asian middle class on the rise

While on the couch, Slack investor has an ear out for world affairs and came across an article from the accomplished fund manager (and Asia Buff) Kerr Neilson – The Rise of Asia – worth a full  read if you have the time. The article points to the need to consider Asia, and its effect on the world economy, over the next 10-20 years. It is a powerful collection of facts e.g,

  • China and India have grown their economies consistently at 6-7% for the past 20 years – they are now 4 times bigger than they were in 1998.
  • When measuring purchasing power, their combined GDP of US $33 trillion is 50% larger than either the US or the EU!
  •  China and India originate nearly 120 million high-spending overseas travellers each year.

The last point is backed up by CNN Money who report that the number of Chinese tourists travelling internationally has more than doubled to 120 million people over the last five years – 1 in every 10 international travellers now comes from China. 

Chinese people tend to begin traveling abroad once their household earns about $35,000 – from CNN Money 

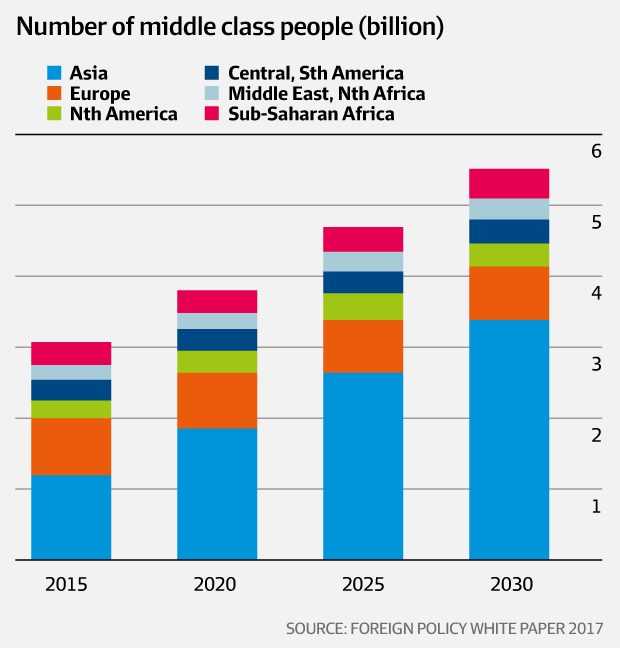
The rapidly rising middle class of these countries is behind this increased tourism and the graph below indicates the influence of these two economies will be on the rise.

Sourced from Australian Financial Review

Mental Note Slack Investor – Look for Asian themes in your investments.

All Index pages and charts  have been updated to reflect the monthly changes – (ASX, UK, US).


October 2017 – End of Month Update … and Index Page Updates

Slack Investor remains IN for US, UK, and Australian index shares.

… and what a bumper month it has been with all markets that I follow on the rise – The Australian Index rockets 4.0%, the UK index up 1.6% and the booming US market up a further 2.1%.

From Incredible Charts

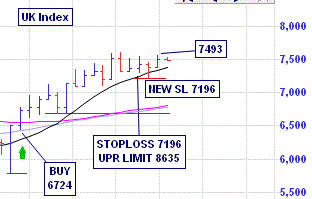
Slack Investor gets off the couch and has a look at the UK Index … as it is recovering from a small fall in September where the monthly price range (the red third bar from right) breached the 10-month moving average (black line). This breaching is a trigger for the Slack Investor trading method as it establishes a new “higher low” for a moving of the stop loss upward – as a new support price has been established.  The stop loss for the UK Index was moved upward from 6677 to 7196.

Index Pages Updates … Radical Man!

Based on image from Pixabay

I have undertaken a major change to the Index pages (ASX, UK, US). Previously I have been basing my decisions on Exchange Traded Funds (ETF’s) that I own that are proxies the actual Indexes for each market. As there are a multitude of these ETF’s, it makes more sense to make my decisions on the actual indexes – as this will have more relevance to the readers that are exposed to the general market indicies through whatever means e.g. another index-based ETF, Superannuation funds or Retirement Plans (US).

From the current investment cycle, Slack Investor will base his decision on the following charts

All Index pages are updated together with the charts to reflect these changes. Also, the the previous charts based upon the Index ETF’s are also kept at the bottom of the page for reference (for the super keen!) on the index pages – (ASX, UK, US).

Measurement … The Sweet Science Part 3


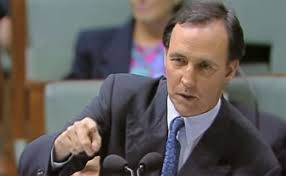
Paul Keating, the father of dividend imputation (franking credits) in 1987 – when he was the Treasurer for the Australian Government. He was Prime Minister 1991-96 and is shown here ready to nail to the wall any “24 carat pissants” and “mangy maggots” that cross his path. Source

Previous posts One and Two in this series show a few simple ways to calculate your portfolio performance. Slack Investor has a complicated set of portfolios with inflows and outflows during the year and, for an accurate performance figure, it is necessary to account for the time that your money is available for investment. For example, an additional $10000 invested at the start of the year should add more value to your portfolio compared to an addition in the last week of the year.

I usually calculate returns before taxes, this is sometimes referred to as “gross of tax”. An important reason to do these calculations is to compare your investments with other investments, such as a managed fund, super fund, ETF or another benchmark. With very few exceptions, performance figures are always reported pre-tax. In Australia, we are lucky enough to have our dividends mostly “franked” or tax paid at the rate of 30%. Thanks Paul Keating … you are a legend!

So I include these franking credits in my return calculations as they represent tax already paid on my Australian Dividends.

The Internal Rate of Return (IRR) and Time-Weighted Return (TWR) are two different ways of calculating portfolio performance. The IRR measures the actual return achieved by an investor’s money in a portfolio. There are also good arguments for using the TWR, Both IRR and TWR take into account the time value of money … The arguments for each are presented here –

Slack Investor likes to do things accurately … but easily! The TWR requires a portfolio valuation after every inflow/outflow and this adds an extra step to the calculation. With a spreadsheet, the IRR calculation is a simpler process. So Internal rate of Return (IRR) is what I use.

3. Portfolio with inflows and outflows – Internal Rate of Return (IRR)

The IRR is also known as the “money weighted rate of return” and the calculation is complex as it involves trial and error mathematics – for the enthusiasts further details can be found here.

The good news is that with an Excel spreadsheet, all this is taken care of by the XIRR function and you only have to enter the start value of your portfolio, dates of inflow/outflows and finish value. I have included the rather complex set of inflows and outflows based upon my SMSF portfolio and hope that your portfolio is simpler. Just use the lines that you need, but it is important that you have an initial date and balance, and a finish date and balance – (scroll down to the bottom of the spreadsheet). Inflows are entered as positive numbers and outflows as negative.

To download the Excel spreadsheet that that performs these calculations go to the Resources Page.

Of course, if this is too difficult, you can always get a bit of software to do your portfolio management and return calculations. Slack Investor likes to keep the costs of investing on the down low and Sharesight in Australia is an excellent choice for the starting investor. They offer free monitoring of investments, capital gains and performance reports if you have 10 or less investments to track. Slack Investor monitors his shares with the retired but excellent (and free) “Sunset” international version of Microsoft Money  Australian Version, UK Version, US Version linked into share prices with MSMoneyQuotes. The latter is not freeware but it is $10 US well spent.

In the USA, Personal Capital is recommended. 

September 2017 – End of Month Update … and “Ultimate Job”

Slack Investor remains IN for US, UK, and Australian index shares.

A mixed month for all markets that I follow – The Australian Index slumped 1.6%, the UK index flat (-0.5%) and the booming US market up 2.1%. Slack Investor stays on the couch and almost does nothing …

In response to the US SPY Index rising over 20% from the last setting of the stop loss at the end of December 2016. This movement triggers a reassessment of the stop loss from 208 up to 232. Hopefully this will lock in some profits when the inevitable correction on the US Markets occurs.

… and now to Slack Investors ‘Ultimate Job’ The AFR reports that the Reserve Bank of Australia (RBA) could potentially set a record for doing nothing. 

The new ‘Guvner’ riding the horse of the Australian Economy. From HeraldSun.com.au

The RBA Governor Philip Lowe who, by the way, is yet to match Slack Investor’s favourite RBA chief (Glenn “Sexy” Stevens) for lack of charisma, is looking at an unusual record … the longest stretch of monetary policy inaction in more than 20 years. Dr Lowe is only in the second year of his new job.

Australian economists expect no movement from the “emergency low” cash rate of 1.5% this month which will be the 13th month in a row  of inaction. However, for a record to fall into place, all he has to do is nothing right up to the May 2018 board meeting. This would be no action for 18 straight meetings – beating the record 17 meeting run of inaction for between early 1995 and July 1996.

No wonder this is Slack Investor’s ideal job! Pulling the levers on the Australian economy comes with a salary of over a million dollars – and, I don’t really begrudge him that … (there are meetings to attend!) … this is a wage package that wouldn’t get him into the top 50 of Commonwealth Bank executives! Don’t get me started here!

Dr Lowe is sitting tight because of the sensitive nature of the Australian economy with very low wage growth and the large amounts of household debt that Australians have. But other world economies are starting to climb out of the exceptionally low borrowing rate world. There have been rate rises in Canada and England. The US Federal Reserve chair Janet Yellen has flagged further rises this year … and, this is not such a bad thing as it means that she is starting to think that the US economy is getting stronger.

I have updated all Index pages and charts to reflect the end of month data. My Portfolio page is also updated as it is the end of the quarter.

Measurement … The Sweet Science Part 2

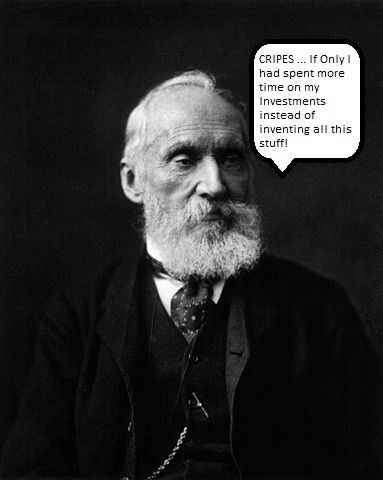
Lord Kelvin (1824-1907) – based on image from Wikimedia


Measuring your portfolio performance can do your head in … but Slack Investor thinks that it is important that you set aside a time to evaluate your investment performance at least once a year. I choose the end of the financial year in Australia (June 30) as a good time for these calculations … but you can chose your own date … and, if whatever you do, you do it consistently … you are going to be OK.

First of all … why measure? Lord Kelvin was a smart bloke – as discussed previously, measurement adds to our knowledge – By measuring your own portfolio performance you get an idea of how you are doing compared to other portfolios, share indicies, or managed funds. If you consistently underperform against other bench marks … then it might be time to become the ultimate Slack Investor and outsource your portfolio to Index funds.

Outsourcing into passive investment is not so bad … if the fees are kept low … “The Buff” , (aka Warren Buffet, the worlds greatest investor!)  has promised to give away 99% of his $65 billion fortune when he dies – the remainder of his fortune will be invested in bonds and index funds to support his wife and family.

My advice to the trustee could not be more simple: Put 10% of the cash in short-term government bonds and 90% in a very low-cost S&P 500 index fund. (I suggest Vanguard’s.) I believe the trust’s long-term results from this policy will be superior to those attained by most investors – whether pension funds, institutions or individuals – who employ high-fee managers. from source

  1. Portfolio with no inflows or outflows

Lets start simply … supposing your have the most basic portfolio that reinvests its earnings with no external inflows (“cash in”, contributions, or transfer) and no external outflows (“cash out”, pension payment, or transfer) from your investment portfolio during the year and you want to do a performance calculation to benchmark yourself with other funds and investments. Most people can come up with a starting value and an ending value of their portfolios at the year (financial year) end – this includes the value of your stocks and any portfolio cash. Slack Investor prefers to calculate his returns before tax. So, tax credits such as franked dividends are included in his portfolio return.

Whatever happens inside this portfolio – buys and sells, dividends, interest, expenses, brokerage and fees – are just part of the portfolio business and will be reflected in its finishing value.

An Excel spreadsheet that will make this job easier is available on the Resources Page.

2. Portfolio with inflows and outflows – Approximation

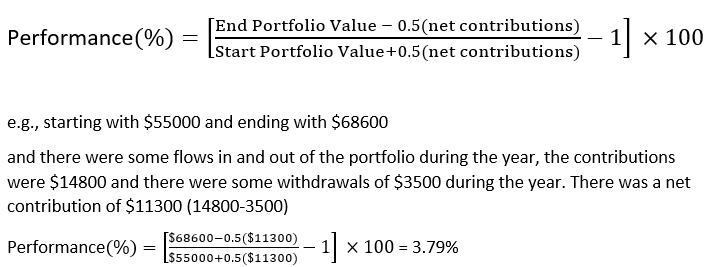
However, for most real portfolios, there is money transferred into, or out of, your portfolio account during the year. Unlike the Beardstown Ladies, if you want to accurately portray how you are doing, it is imperative that you account for cash flows either in or out of your portfolio. If you want the least amount of work and you are willing to calculate your portfolio return approximately – the way below will work a treat. A net contributions figure is obtained (inflows – outflows) to give an ‘average’ amount of capital invested during the year and by subtracting 50% of net additions from the ending value and adding 50% to the beginning value – we get an approximate percentage return.

An Excel spreadsheet that that performs these calculations is available on the Resources Page.

Of course, in real life, rather than using averages, portfolio returns depend greatly in the timing of when you had capital available. The above is an approximation. Slack Investor chooses to go into more detail to reflect the time value of money for his portfolio. These intricate ways will be revealed in the last of this measurement series next month.


August 2017 – End of Month Update … and Fund Returns FY2017

Slack Investor remains IN for US, UK, and Australian index shares.

A steady month for all markets that I follow – Slack Investor stays on the couch and does nothing …

The Chant West media release  referred to in the previous monthly update has plenty of other useful information.

Fund Performance Results (Up to June 30, 2017)- Source Chant West

The above table quotes the median performance figures from various types of funds that Chant West monitors, ranging from All Growth to Conservative. As mentioned in a previous post, the 1-Yr column shows it has been a bumper year  for all types of funds – If you owned any growth fund during the last 7 years, you would be tremendously pleased with the 10% pa returns.

The GFC (Global Financial Crisis) of 2008 (and later years) continues to weigh down the ten year returns (4-5% for growth assets).

Over the last 25 years, Chant West found the returns of growth funds were a more reassuring 8.3%. It just drives home the devastating affect of a major downturn that an event like the GFC has on growth funds. The figures are, in the jargon of the industry,”net of investment fees and taxes” … but curiously before admin fees and advisor commissions … but this is another story!

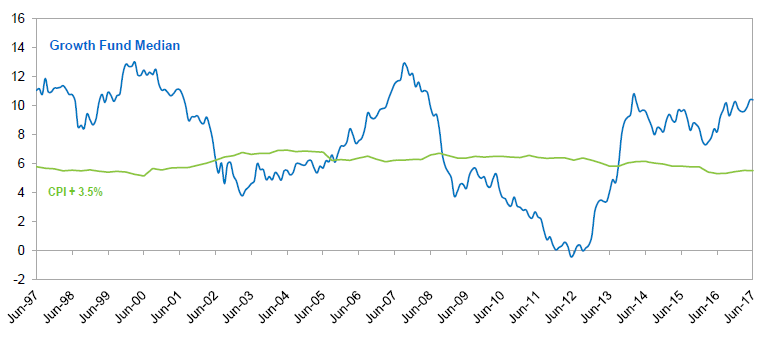
Growth Funds – Rolling 5-Year Performance (Returns %pa) – Source Chant West

The above graph compares the growth category median (rolling 5-year) with the average return objective for growth funds – CPI (Consumer Price Index) plus 3.5%. This is a typical target for growth funds. In an environment where cash returns are mostly below 2% there is risk involved with investing in growth assets.

I never ever ever thought I would be quoting the far-right (recently) former Trump employee on this site.

“My old firm, Goldman Sachs – traditionally, the best banks are leveraged 8:1. When we had the financial crisis in 2008, the investment banks were leveraged 35:1.”
― Steve Bannon, Media Executive and former Investment Banker source

However, “Breitbart Steve”, after the fact, your quote rings true … the signs are always there …  Excessive borrowings (leveraging) and a willingness for people to pay top dollar for overvalued assets are sure signs that trouble is coming.

Slack Investor is comfortable with risk and would always prefer growth funds – especially with a large time horizon – but I will never be able to avoid ordinary fluctuations (corrections) in the stock market. A disciplined approach to stop losses should keep me out of the huge falls that the GFC presented to owners of shares.

Although valuations are generally high, Slack Investor does not see a bubble in the Australian or UK Stock Markets for now – Unlike the US market, Australian and UK share valuations are not too far higher than long term averages – and there has never been a calamitous fall in stock values without a bubble first. Regardless, my stop losses will protect me from huge losses of capital.

I have updated all Index pages and charts to reflect the end of month data.

Measurement … the Sweet Science

Lord Kelvin (1824-1907)from Wikimedia


“….when you cannot measure it, when you cannot express it in numbers, your knowledge is of a meagre and unsatisfactory kind…”


Lord Kelvin, a Science “Hall of Fame” member was right … Particularly so when it comes to your investments. As well as some notable scientific discoveries, including  the invention of the absolute temperature scale which defines the lowest possible temperature – at which atoms stop moving (-273.15C) – The wise Lord Kelvin showed a respect for measurement … and the nerd in me remembers the graffiti homage from Physics Lab toilet doors …

Absolute Zero is Cool!

Slack Investor takes the measurement of investment performance very seriously and puts some effort into doing it right. Slack Investor is old enough to recall the famous case of the Beardstown Ladies Investment Club – a club that published a book in 1994 that claimed a market-beating investment performance from a group of talented, but amateur, investors from a small town in Illinois, USA.

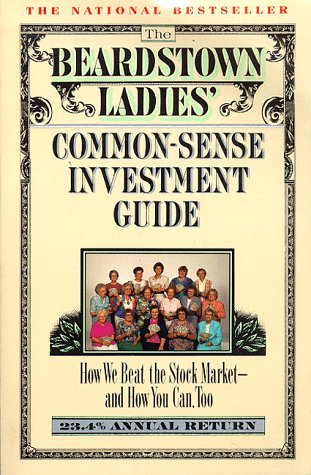
From Source

The Beardstown Ladies are a group that are still going, a 14-woman investment club that hit the financial headlines with their “The Beardstown Ladies’ Common-Sense Investment Guide” which included a seemingly astounding financial performance that beat the best of Wall Street with their investment returns of 23.4% pa between 1984 and 1993.

This gave other amateur investors a real kick and did wonders for their book sales. It was far better than the 14.9% gained by the index S & P 500 and almost twice the 12.6% return of the average US stock mutual fund.

However, after an independent audit, according to the LA Times, in 1998, their was a recalculation of their the performance figures amid questions about accuracy. The ladies, sadly,  have an audited revised portfolio return of a 9.1% a year – a great effort … but lagging the index!

The problem was, the lovely ladies from Beardstown had innocently forgotten to account for their cash flows into the fund (Contributions) and these had been added into their portfolio performance to give an inflated figure. Their book is still for sale … and they have published four others … The US loves winners(?)!

The Slack Investor message is to not always believe what you read … wait for the independent audits …  and, like Lord Kelvin, to avoid “meagre and unsatisfactory knowledge”, take some time in your measurement of portfolio performance. More of this next month …

July 2017 – End of Month Update … and Long Term Returns!

Slack Investor remains IN for US, UK, and Australian index shares.

A steady month for the ASX and gains for the UK market (0.7%) and the US Market (2.3%) – It must be the “Mooch” Effect.  I am sad to see him go … In a circus you need heaps of clowns!

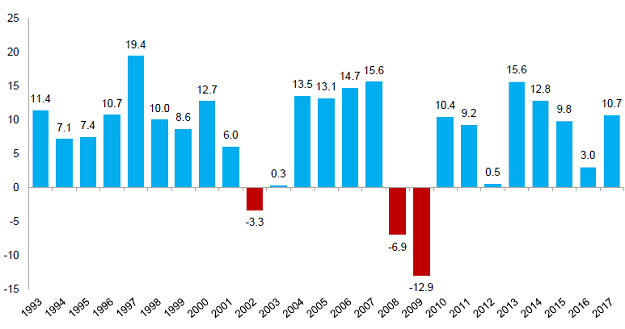
Chant West are a superannuation consultancy and research firm that release a trove of data on how superannuation is rolling along in Australia. The have excelled themselves in a very timely media release. outlining that this is the 8th financial year in a row of median gains for Australian Super “Growth” funds. They define growth funds as funds that invest 60-80% of their investments in growth assets such as shares and property. Their results for the past 25 years for Australian Super Funds is presented below.

Median Australian Growth Super Financial Year Returns (%) – net of fees and taxes – from Chant West


Despite the worries of the world, this last financial year, the median of Australian growth funds achieved a 10.7% return and some of the low fee funds  discussed in the last post, such as HostPlus and Sunsuper achieved FY17 returns of 13.2% and 12.4% respectively in a year where the safety of cash could only yield 1.8%.

The five-year period up till now have been boom times for the share market. There will be high fives and bonuses all round for the suits that control your funds. This has been a good investing year and you should rejoice at the returns shown in your super statements when they are sent to you soon – and reflect upon the pitiful returns that you would have got if you had your super invested in a bank account.

But, it is a good reminder that not all years represent gravy for growth funds and it is the nature of these assets that their will be some yearly fluctuations. Slack Investor’s feeble memory is strong on the returns of the years 2008 and 2009 where the Global Financial Crisis caused asset prices and market returns to crash. I can remember many who lamented that this compulsory super business was a costly rort – it was tough to watch your retirement savings shrink even though money was taken out of your wages each week.

Slack Investor has a soft spot for the bard

“Ay, to the proof, as mountains are for winds, that shakes not, though they blow perpetually.”  ― William Shakespeare, The Taming of the Shrew

So “shake not” dear investors … think long term and think growth … and despite the occasional disappointment … you will be rewarded! Compound interest will be doing its work on your savings in all those years that are blue in the above image – It is only fair that you have got to give compound interest the occasional year off – for recuperation!

I have updated all Index pages and charts to reflect the end of month data. .

Spaceship … Let Me Out Here!

From Enolytics.com

Hey you Millennial dudes and hipsters… Suh!

Space … sounds good … its so snatched! … Spaceship … even better. Come on … lets get on board. Superannuation is so boring … but Spaceship .. Its so now – isn’t Elon Musk working on one?

What Slack Investor is referring to is the reach out to the younger crowd of cool new investor products that will look after your superannuation in a really cool way. Spaceship, is just one of the new breed of disruptors (e.g, Zuper, MobiSuper, Grow Super)  that is encouraging you to put your super investments into a high tech sounding enterprise that focuses on new technology companies. It seems that their marketing push has been successful with at least $100 million in funds under management for Spaceship.

Now, Slack Investor has a soft spot for disruptors that make use of new technology to help the investor work more efficiently through lower costs and new platforms. However, Spaceship and their ilk are not, so far, disruptors. They are just a repackaging of the same old greedy financial industry that are trying to separate the investor from their hard earned loot.

We had a look at the critical importance of fees in investment in an earlier articles here and here. Despite the marketing fluff, Slack Investor is getting off the couch and drilling down. A highly recommended process before you part with your money to anyone. Spaceship fees are 1.6% plus administration, MobiSuper fees 1.5% plus admin fees,  Grow Super fees are 1.85%! Fees are critical to investment returns.

The same drilling down process can be done in the USA with Individual Retirement Accounts (IRA) or employer sponsored 401(k) plans. Google is your friend – Long term performance and Fees Fees Fees is what you are looking for. A good articles for the USA on fee impact can be found here, And for the UK here.

The Australian Securities and investment commission (ASIC) says

A 1 % difference in fees can lead to a 20 per cent difference in the value of a superannuation benefit over 30 years.

From Hostplus – Money Magazine Best of Best 2017

The above table shows some existing funds that have established long-term returns and with a fee structure less than 0.5% for $50000 invested.

So get out of the spaceship … and relish life on planet Earth with some low cost super funds … they are so “On Fleek” as far as your money is concerned.


Volatility … Its Scarey! … Take a deep Breath!

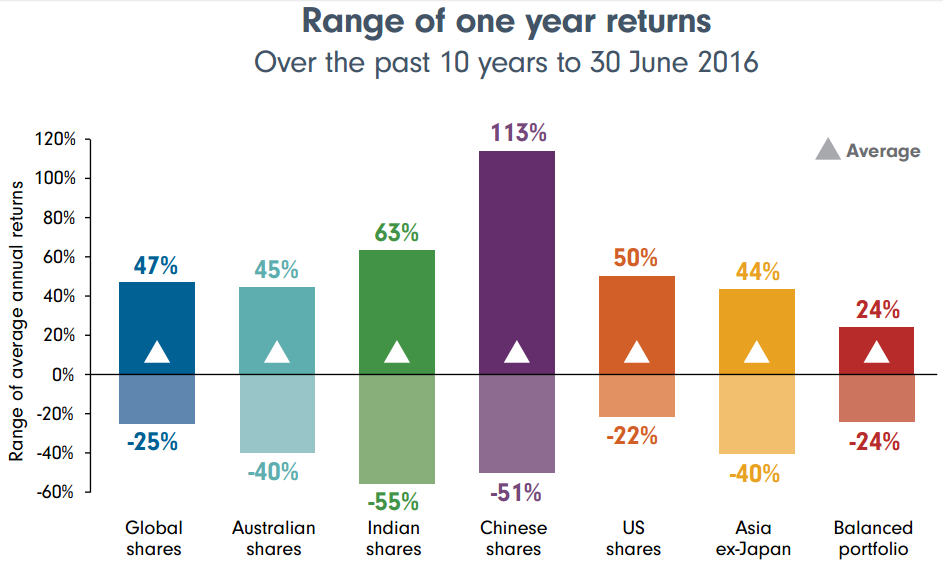
The range of one year share investment returns over a 10-year period – From Fidelity

In the above data collected by Fidelity, it is sobering to look at the range of returns that a share investor can expect over a one year period. By setting stop losses, you can help protect yourself from the very worst of declines – but even with this protection, there will be some bad investment years. Lets look at the worst investment year for Australian Shares shown above (-40%). Even with stop losses, your portfolio might lose 10-25% due to prices rapidly falling before you can act. This is a major hit on your savings and during the 2008 GFC many experienced losses in their investment and superannuation savings that have turned them off share investment forever. This, in hindsight, has not been the best decision as cash returns have been relatively low and, up till June 2016, median balanced funds have improved 86% since this global financial crisis.

But volatility is not for everyone – You must be able to sleep at night!

This week, Slack Investor just had the shock of one of his stocks dropping in price by 37% on an earnings update.  Price swings like this on your hard-earned investment dollars are hard to take and the volatility of the stock market – particularly with individual companies – make share investment a difficult environment for many.

To Slack Investor this is was not great news and though I prefer to make my investment decisions at the end of each month, the price revision has triggered the “not very slack” procedure of a review of this stock. Are the companies earnings still forecast to grow? There is now a daily review of this stock – with a view to sell. The correction may be an over reaction … or just the start of more bad news.

The things that protect me in these moments are diversification and the fact that Slack Investor is a long term investor. There are always at least 20 stocks or managed funds in the Slack Portfolio.

Although at the time of buying, by doing a bit of research on past and future earnings, I am convinced that each individual company will be an enormous contributor to the retirement fund. However, I have been investing long enough to know that things don’t always pan out as forecast … and I have realized that it’s not necessary to get all your investment decisions right … just so long as you get a good portion of them right!

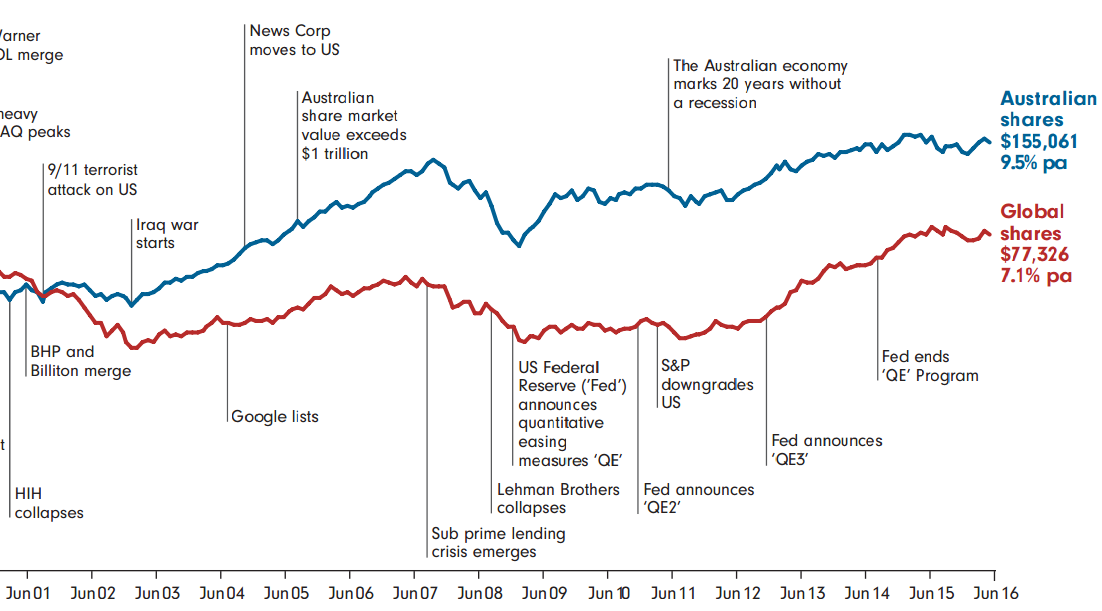
Investing can be tricky at times and during times of market volatility it is useful to take the long view. The 15-year extract above (Shown on a compressed Logarithmic scale)- from Fidelity – indicates what would happen to a $10 000 investment over 30 years in index funds in various markets. For Australian shares the average yearly return is 8.5% over 30 years – but there were some boom times over this time frame. Over a shorter period, Canstar reports a 10-year average return for the Australian Index of 5.5% compared to the, admittedly risk free, cash option of 3.1% over 10 years.

Particularly in these times of low bond and cash yields, if you can accept the volatility of the share market, be willing to live with the occasional investment mistake and have a diverse list of well-managed growing companies in your portfolio – take a deep breath and you will be OK!