 Slack Investor remains IN for US, UK, and Australian index shares.
… and what a bumper month it has been with all markets that I follow on the rise – The Australian Index rockets 4.0%, the UK index up 1.6% and the booming US market up a further 2.1%.

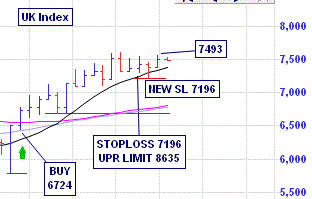
Slack Investor gets off the couch and has a look at the UK Index … as it is recovering from a small fall in September where the monthly price range (the red third bar from right) breached the 10-month moving average (black line). This breaching is a trigger for the Slack Investor trading method as it establishes a new “higher low” for a moving of the stop loss upward – as a new support price has been established. The stop loss for the UK Index was moved upward from 6677 to 7196.
Index Pages Updates … Radical Man!

I have undertaken a major change to the Index pages (ASX, UK, US). Previously I have been basing my decisions on Exchange Traded Funds (ETF’s) that I own that are proxies the actual Indexes for each market. As there are a multitude of these ETF’s, it makes more sense to make my decisions on the actual indexes – as this will have more relevance to the readers that are exposed to the general market indicies through whatever means e.g. another index-based ETF, Superannuation funds or Retirement Plans (US).
From the current investment cycle, Slack Investor will base his decision on the following charts
- S&P/ASX 200 (^AXJO ) , on Yahoo Finance, for the Australian (ASX) Index.
- FTSE 100 (^FTSE ) , on Yahoo Finance, for the UK Index.
- S&P 500 (^GSPC) , on Yahoo Finance, for the US Index.
All Index pages are updated together with the charts to reflect these changes. Also, the the previous charts based upon the Index ETF’s are also kept at the bottom of the page for reference (for the super keen!) on the index pages – (ASX, UK, US).
