

“In the business world, the rear view mirror is always clearer than the windshield.”
Warren Buffett
Slack Investor has a proven track record in not being able to predict where speculative assets (such as Bitcoin or precious metals) are going. I would also add to the “speculative list” some companies whose share price have become divorced from the link to their actual earnings. As a rough guide, I try not to invest in companies that have a forward P/E ratio of greater than 50. I get these forward P/E ratios from the excellent Market Screener site.
This means that I have missed out on the great gains of being by in companies like Afterpay (APT – 2023 P/E ratio 190) or TESLA (TSLA – 2023 P/E ratio 193). Some folk have made a lot of money with these companies …. but they are just too speculative for me. Slack Investor tries to “stick to his knitting” with growing companies that have an established earnings record and forward P/E ratios <50.
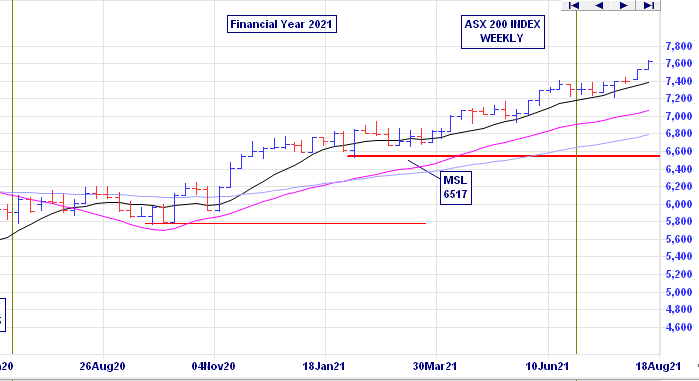
After an eventful FY 2020 and the COVID-19 dip in the markets around the world. FY 2021, has seen very good gains for most global markets. In the UK, the FTSE 100 Total Return Index is up 18.1% (last FY 20 down 13.8%). Dividends helped the Australian Accumulation Index to be up 27.8% for the financial year (last FY down 7.7%). These Americans remain stupendously optimistic … the S&P 500 Total Return Index was UP 36.4% (last FY up 12.0%) for the same period. All of these Total Return Indexes include any accumulated dividends, wheras the chart below of the ASX 200 for FY 2021, just shows stock prices.
Slack Portfolio Results FY 2021
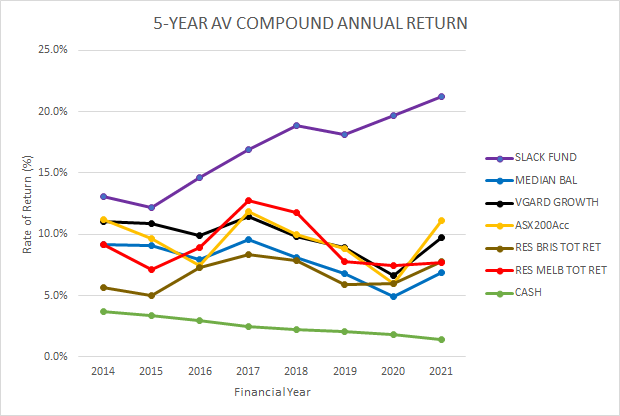
All Performance results are before tax. The Slack Portfolio had a cracking year with annual FY 2020 performance of +21.7%. Full yearly results with benchmarks are shown in the table below. It was also a top year for all benchmarks (Median Balance Fund +13.0%, Vanguard Growth Fund +20.3%, ASX 200 Accumulation +27.8%).
Against all Slack Investor predictions … Real Estate turned out to be a great investment in the Brisbane and Melbourne markets for FY 2021 (+17.9% and +10.7%) – Perhaps I should also give up on the “looking ahead” in the residential property market – I just don’t get it!
| YEAR | SLACK FUND | MEDIAN BAL | VGARD GROWTH | ASX200Acc | RES BRIS | RES MELB | CASH | CPI |
|---|---|---|---|---|---|---|---|---|
| 2010 | 6.6 | 9.8 | 12.3 | 13.1 | 10.8 | 26.9 | 4.2 | 3.1 |
| 2011 | 2.5 | 8.7 | 9.1 | 11.7 | -2.4 | 0.9 | 4.4 | 3.7 |
| 2012 | 8.3 | 0.4 | 1.3 | -6.7 | 1.3 | -0.9 | 4.3 | 1.2 |
| 2013 | 26.5 | 14.7 | 18.6 | 22.8 | 7.7 | 8.3 | 3.2 | 2.4 |
| 2014 | 23.6 | 12.7 | 14.5 | 17.4 | 11.5 | 12.8 | 2.6 | 3.0 |
| 2015 | 2.4 | 9.6 | 11.8 | 5.7 | 7.7 | 15.6 | 2.5 | 1.5 |
| 2016 | 14.2 | 3.1 | 4.2 | 0.6 | 8.4 | 9.5 | 2.2 | 1.3 |
| 2017 | 19.5 | 8.1 | 8.8 | 14.1 | 6.5 | 17.7 | 1.9 | 1.9 |
| 2018 | 37.6 | 7.2 | 10.0 | 13.0 | 5.2 | 3.9 | 3.9 | 2.1 |
| 2019 | 19.7 | 6.2 | 9.8 | 11.5 | 1.7 | -6.0 | 2.0 | 1.3 |
| 2020 | 9.4 | 0.3 | 0.6 | -7.7 | 8.4 | 13.8 | 1.1 | -0.3 |
| 2021 | 21.7 | 13.0 | 20.3 | 27.8 | 17.9 | 10.7 | 0.2 | 3.8 |
The Slack Fund yearly progress vs BENCHMARKS. The Median Balanced Fund (41-60% Growth Assets), Vanguard Growth Fund, ASX 200 Accumulation Index, Corelogic Residential Property total return in both Brisbane and Melbourne, and Cash (Australian Super Cash Fund) and Consumer Price Index (CPI)
The five-year compound annual performance gives me a much better idea about how things are going and will smooth out any dud (or remarkable!) results.
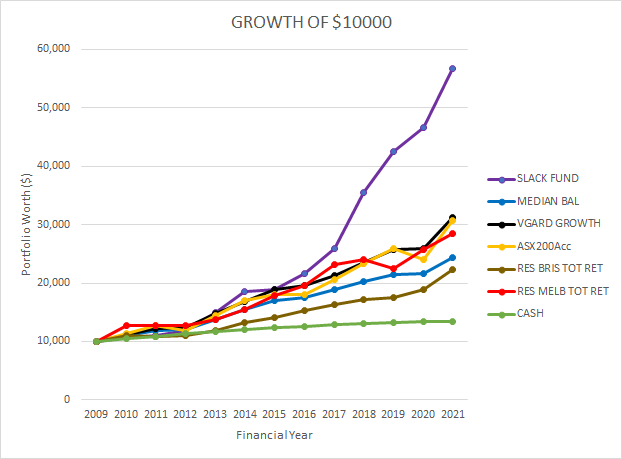
The beauty of compounding with a succession of good performance results can be seen in the chart below showing the growth of an initial investment in June 2009 of $10000.
The lessons of long term investing
Every year Vanguard publish their performance data on each asset class. Slack Investor looks forward to this – as it reminds him of the power of the appreciating asset classes of Shares and Property. Vanguard highlights the volatility of asset values in the short term – but also emphasizes the joys of holding and accumulating shares or property for long periods of time. These asset classes have steadily increased in value over the last 30 years. $10000 invested in Australian Shares in 1990 would have compounded to $160 498. Staying in Cash would have yielded $38 938.
2021 Vanguard Index Chart
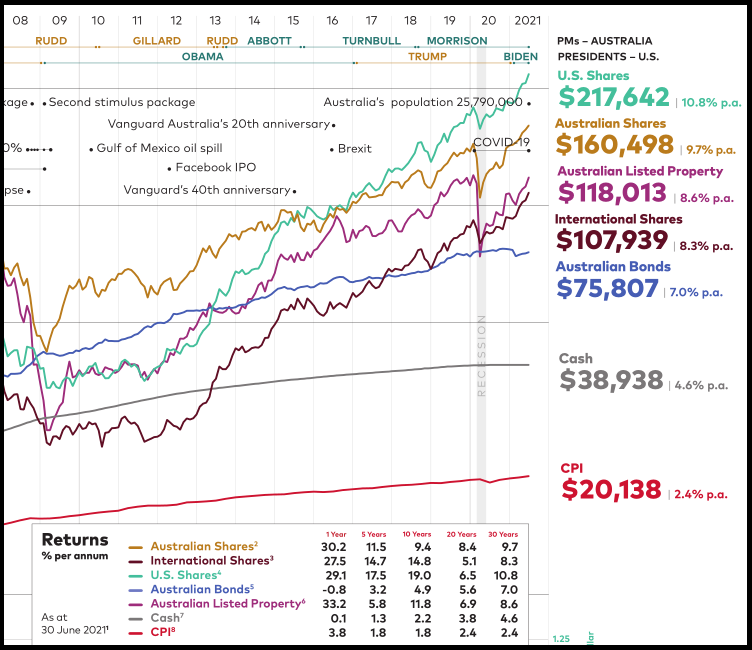
Financial year total returns (%) for the major asset classes
In the chart below, for each asset class the total annual returns are given and the best performing class for each year is marked in green … and the worst in gold. What stands out to Slack Investor is that is rare for and asset class to lead in annual returns (green) for two years in a row – and there are years where the leading asset class (green) becomes the worst performer (gold) in the next year. This drives home the often repeated sentence in the finance world.
Past performance is not a guarantee of future results.
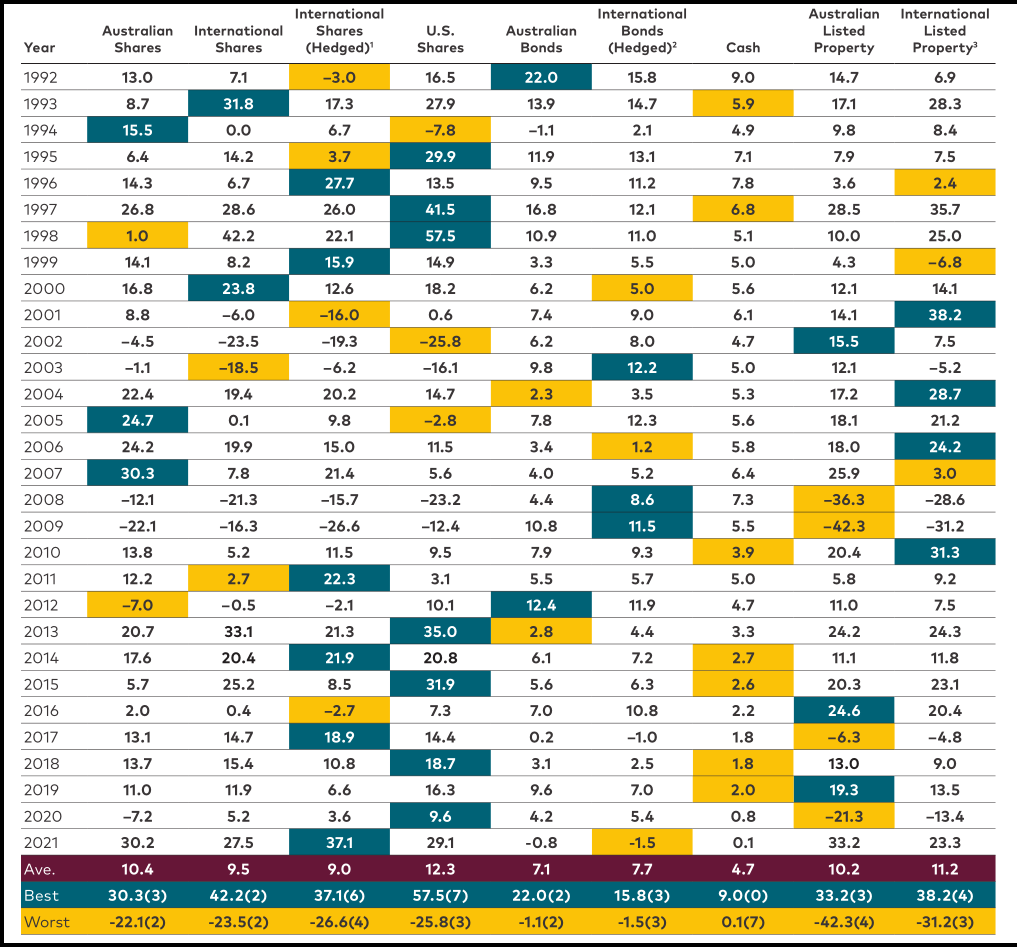
This table highlights the benefits of diversification across asset classes for the long term investor.
Sitting on the couch, Slack Investor is quietly pleased with his 2021 results – Roll on Financial year 2022. However, when comparing this year’s bumper returns with the long term average returns for Australian and International shares of around 10% – Slack Investor can’t help but be a little nervous.
.