hubris: (noun) – an extreme and unreasonable feeling of pride and confidence in yourself:
Cambridge Academic Content Dictionary
Cathie Wood is the CEO of Ark Innovation and is best known for her NASDAQ based flagship fund ETF (ARKK). She has been concentrating her bets on the “disruptive technologies,” such as artificial intelligence, genomics, blockchain and cryptocurrency, and clean energy. She is a big fan of Tesla and has made the prediction
Bitcoin will crack $1 million by 2030
Cathie Wood – The Street
Slack Investor is no seer … but at the October 14, 2022 price of 16240 USD, Bitcoin has quite a way to go to reach that mark. In the words of the great BBC TV character Sir Humphrey, this looks like a “very courageous” prediction Cathie!
The ARK Innovation ETF (Nasdaq: ARKK)
Wood, is a devout Christian, and has named her company after the sacred Ark of the Covenent. Cathie Wood is a household name in the US and has a huge number of loyal fans. Her funds had 60 billion USD under management at their peak. She was named by Bloomberg as Stock Picker of the Year in 2020 . The flagship ARKK fund gained a remarkable 152% in 2020, but since then, the performance has not been so stellar – ARKK is down 65% so far this year. In interviews, she often refers to her past success, and insists, over and over again, her performance should be judged over a five-year time horizon.
Wood is nothing but confident. She hosts a monthly finance video – delightfully called “In the Know” and is a great defender of her fund. She sees “spectacular returns” for Ark Invest over the next five years. According to a recent article by New York magazine, her initial predictions for ARK Invest were annualized returns of 15 percent, “Now we think 50 percent.”
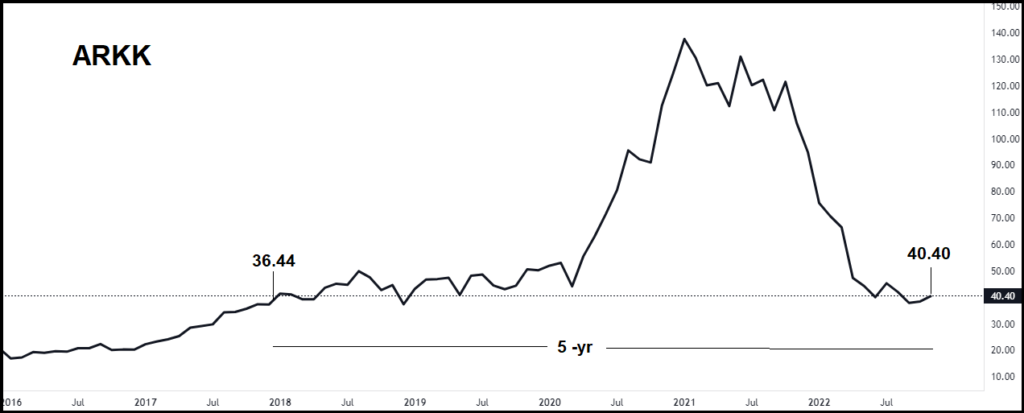
Slack Investor would agree that a 5-yr holding period is a good minimum to judge how a fund is performing – to allow for volatility and to allow growth stocks to grow. She might be right that tech stocks are undervalued at the moment. But let’s have a look at her results as a fund manager over the last 5 years. The total return of ARKK expressed as a compound annual growth rate (CAGR) since November 2017 was a not so impressive 3.5% when compared with other “no stock picking” index funds.
| Instrument | Value Nov 2017 | Value Nov 2022 | 5-yr CAGR |
| ARKK | 36.44 | 43.31 | 3.5% |
| NASDAQ 100 TR | 7159 | 13881 | 14.2% |
| S&P 500 TR | 5212 | 8407 | 10.0% |
| FTSE 100 TR | 6510 | 7564 | 3.1% |
| ASX 200 TR | 56486 | 81102 | 7.5% |
Cathie Wood conducted a recent session at a Morgan Stanley event in Sydney. where she maintained her bullish outlook. According to the Financial Review, the fund manager essentially argued it’s the market that’s got it wrong, not her!
Slack Investor is far more humble … he “takes his licks” when times are bad – doesn’t “crow” when times are good – and is mostly wary when a new “stock guru” emerges.
In the stock market, volatility is the price he has to pay for being involved with long-term asset growth.
November 2022 – Mid-Month Update

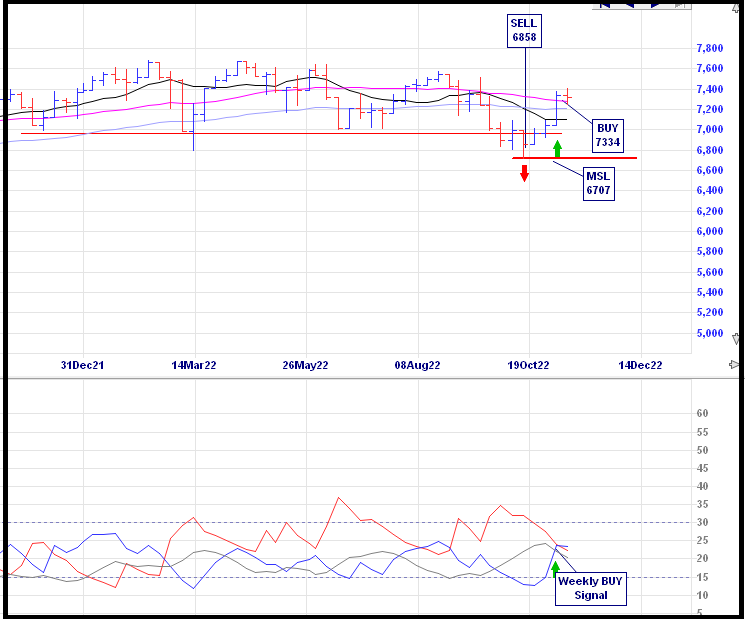
My small-scale, and often very frustrating, market timing experiment continues until its projected end in 2024. On a weekly signal for the FTSE 100 from the momentum following Directional Movement system. I have bought back into the UK index. I am back now to fully invested in the ASX Index, UK Index, US Index.
The buy signal can show itself as a downward dip in the trend strength indicator ADX (grey line) of the lower panel below. There are many ways of setting up this Directional Movement system. Slack Investor likes the “smoothing” that is enabled by a system that looks back over the previous 11 periods – but the complexities are best left for the Resources page.