
“ So the last shall be first, and the first last: for many be called, but few chosen“
Matthew 20:16 – King James Version of the Christian Bible
Slack Investor is not a very religious person – but he is a numbers man and 84% of the global population identifies with a religious group – so I have to go with the flow here. This sort of majority demands respect. The Christian disciple Matthew was reporting on one of Jesus’s teachings. Biblical scholars think that Jesus was trying to point out that Heaven’s value system is far different from earth’s value system.
The “Last first and First last” might also be applied to how some of the Slack Portfolio stocks have been going over consecutive years. There seems to by a cycle of last years Nuggets … might end on the Stinker pile the year after – and vice-versa. Growth stocks have many virtues … but they are not immune to the cycles of price – bouts of overvaluation followed by a period of undervaluation.
The percentage yearly returns quoted in this post include costs (brokerage) but, the returns are before tax. This raw figure can then be compared with other investment returns. I use Market Screener to analyze the financial data from each company and extract the predicted 2024/2o25 Return on Equity (ROE), Dividend Yield and Price/Earnings (PE) Ratio on the companies below. This excellent site allows free access (up to a daily limit) to their analysts data once you register with an email address.
Slack Investor Stinkers – FY 2022

Financial year 2022 was the Pepé Le Pew of all of Stinktown for Slack Investor.I hold mostly growth shares in the technology and healthcare sectors. These sectors have been heavily punished across the world so far in 2022.
This is the first time I have had a negative result for my investments over a financial year since 2009. Slack Investor is a great believer in long term investing returns – usually evaluated over a 5-year period – so this year’s result, while painful, does not change my overall strategy.
Three of my “stinkers” this year were actually “nuggets” from last year. For FY 2020, Codan +161%, REA +59% and IDX +37%. Such is the cyclic nature of some growth stocks.
Codan (CDA) -58% (Still held)
(CDA – 2025: PE 14, Yield 3.8%, ROE 25%) Codan is a technology company that specializes in communications and metal detecting. This company was one of my big nuggets last year (+161%) – so I should not have been really surprised that there could have a bit of a pullback. The decline hurt, but the fundamentals of the company remain sound. Holding on.
Xero (XRO) -41% (Sold)

(XRO– 2025: PE 81, Yield 0.3%, ROE 15%) Xero is an innovative cloud -based accounting provider for small business. Every business owner that Slack Investor talks to say that Xero is a boon to their business. This sort of “word of mouth” got me over-excited this year and I just held my nose and jumped in – against all my rules of avoiding the excessively high forward PE ratios of over 50! It is these high PE companies that are usually punished first in a downturn – and that’s exactly what happened. I still look at it and think its a decent growing business – but I can feel the recent bite!
Integral Diagnostics (IDX) – 39% (Still held)
(IDX – 2024: PE 16, Yield 4.5%, ROE 12%) This medical image company provides diagnostic image services to GP’s and specialists. IDX was another of my nuggets from last year (+37%) that has just shed all of last years gains. The Return on Equity of this company is starting to get a bit low (<15%) – But the PE and yield seem OK. Will keep this company on watch for the moment.
BetaShares Asia Technology Tigers ETF -33% (Still held)
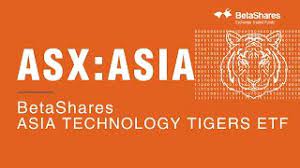
(ASIA – 2022: PE 14, Yield 0.7%,) Growth in Asia … What could go wrong! Plenty it seems.
These “technology tigers” that make up this ETF have been part of a global selloff of tech-related shares this year.
A lot of the Chinese companies (such as Alibaba) have been marked down because the Chinese government imposed its will on a few industries. Also the US government has hinted at action on Chinese companies that have listed on American market. However, the ASIA ETF has large holdings in such monsters as Taiwan Semiconductors, Samsung and Tencent Holdings – so I will accept the current pain and stick with this as a long-term holding
REA Group (REA) -33% (Still held)
(REA – 2024: PE 29, Yield 1.8%, ROE 32%) The owners of RealEstate.com.au. which is the go to portal for house selling and buying. 65% of Australia’s adult population are checking the site every month looking at property listings and home prices. Another long-term holding.
I have only listed the stinkers that lost over 30% this year … sadly, there were many more rogues that lost over 15% for the Slack Fund. They include PPK Group (PPK) -28%; Altium (ALU) -25%; Nick Scali (NCK)-20%; Pushpay Holdings (PPH)-16%; and A2 Milk (A2M)-15%.
Slack Investor Nuggets – FY 2021

Nuggets were few and far between this year. A great benefit of investing in companies that have a high Return on Equity (ROE), and with a track record of increasing earnings, is that they sometimes behave as “golden nuggets”.
Technology One(TNE) +17%

(TNE – 2025: PE 34, Yield 1.7%, ROE 36%) This Software as a Service (SaaS) and consulting company continues to be profitable. This year is the 13th year in a row of record half-yearly profits. A high 2025 PE of 34 (Expensive) is a little scary but, if the high Returns on Equity (36%) remain, on balance, this is OK.
Macquarie Group (MQG) +10%

(MQG – 2025: PE 25, Yield 4.0%, ROE 13%) Macquarie is a complex business with a range of banking and financial services, and plays in global markets and asset management. Once again, the management seem to know what they are doing – Slack Investor remains a fan.
Honourable mention to the only other company that ended in the black – Coles (COL) a decent +8% in these troubled times.
Slack Investor Total SMSF performance – FY 2022 and July 2022 end of Month Update
In a year that Chant West describes as “a rough year for markets”. Following FY2021, which was one of the strongest years for Super funds (+18% for FY21), things have now lurched south with the median growth fund (61 to 80% in growth assets) returning -3.3% for FY22.
The FY 2022 Slack Investor preliminary total SMSF performance looks like coming in at around -14%. However, the 5-yr performance is a more useful benchmark to me – as it takes out the bouncing around of yearly returns. At the end of FY 2022, the Slack Portfolio has a compounding 5-yr annual return of over 13%.

Despite a breach of the stop loss for the ASX 200 last month, Slack Investor remains tentatively IN for Australian index shares on a dramatic rise of 5.7% this month. The FTSE 100 also had a good month (+3.5%)and I remain IN. The US Index S&P 500 eclipsed them all with a remarkable 9.1% gain – and I am now a BUY back IN.
Last month the ASX 200 price went below its stop loss. Slack Investor tries not to exit a stock against the momentum of the market, so I have been off the couch and closely watching the ASX 200. It has remained above the rising trend line and emerged above the monthly stop loss. I am tentatively still IN.
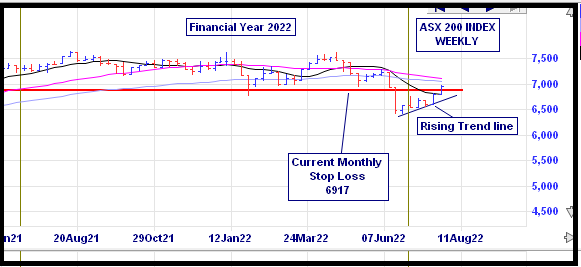
After a sell, it is important to have a notion when to get back IN to an Index or a stock. When trend trading, my main tool for finding a buy signal is a trend following (or momentum) system called the Directional Movement Index. There are many ways of setting up this system. Slack Investor likes the “smoothing” that is enabled by a system that looks back over the previous 11 periods – but the complexities are best left for the Resources page.
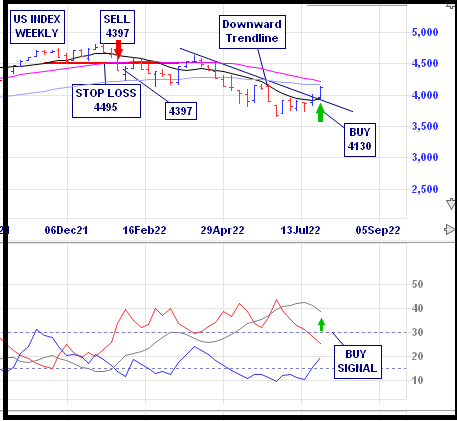
In addition to the BUY signal from the Directional Movement Index for the S&P 500, the charts show a triggering of the “Wedgie” pattern where the stock price breaks through a long term down-trend. This reinforces the BUY.
All Index pages and charts have been updated to reflect the monthly changes – (ASX Index, UK Index, US Index).