
In addition to the trading … and mostly holding onto individual companies, Slack Investor has been running an experiment on market timing for Index funds in the Australian, UK and US markets. The Index funds have been doing OK .. but Slack Investor is generally just finding that timing markets is just too hard and is hinting at an end to the timing experiment in 2024.
As a recap on the experiment so far, I am still outperforming the “Buy and Hold” investor in all followed markets – but the advantage is slim. Per annum outperformance is 1.4%, 1.9% and 0.6% for the ASX, UK and US markets respectively. Not really fantastic results when you consider that I am missing out on the dividends that “buy and holder’s” receive when I am “timed” out of the markets.
The Slack Index “timing the market” method was devised with a lot of back-testing on 30-years of market performances and does really well when sustained bear markets occur as it gets out of the market at a hopefully early stage in the price downturn. Ideally, the Slack method should stay in the market for the smaller fluctuations (corrections <~10%) and get out of stocks before it becomes a full bear market. The problem with my current strategy is that I am getting “whipsawed” out of the market in these smaller downturns – and the big swings seem to happen so quickly that the damage is done before I can get off the couch.
Things were much easier in the accumulation stage – I had set amounts of money coming out of my pay each month that would be automatically invested into my trading account. With dollar cost averaging, if the market went down, it would just mean that I would be able to buy a greater number of shares – all good.
It is different in retirement mode … as, I am not a net buyer of shares now and, as I am usually am fully invested, it is difficult to take advantage of a lower-priced market. These days, the stock market downturns are just something to be endured.
A chart that caught my eye from Current Market Valuation is shown below. They have a developed a method to try to see if a market is over, or under, valued using the cyclically adjusted price-to-earnings ratio (CAPE). This is very similar to the way that Slack Investor has previously tried to work out the valuation of the Australian, UK and US markets.
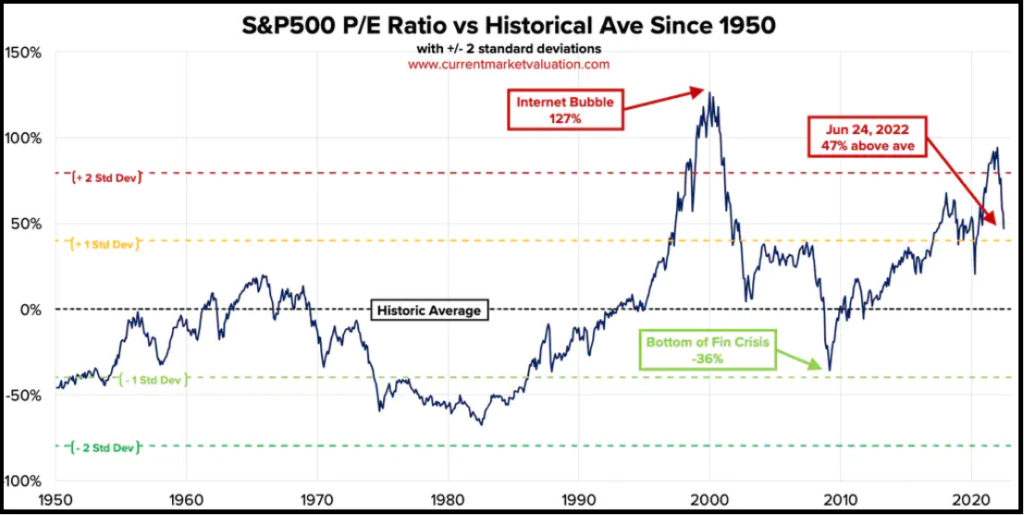
Current Market Valuation define the market as “Fairly Valued” if the CAPE Ratio is between between -1 and 1 standard deviation from the “average”. If the CAPE distribution is “Normal”, then the CAPE should be ranked as “Fairly Valued” about 70% of the time.
Slack Investor has developed similar charts – but only since 1982. I have used only a short time frame for this analysis as there are good arguments as to why the CAPE should actually rise over time – and a small time range will tend to stop this distortion. The Green shaded areas correspond to the limits of one standard deviation of the CAPE from the 40-yr average values.
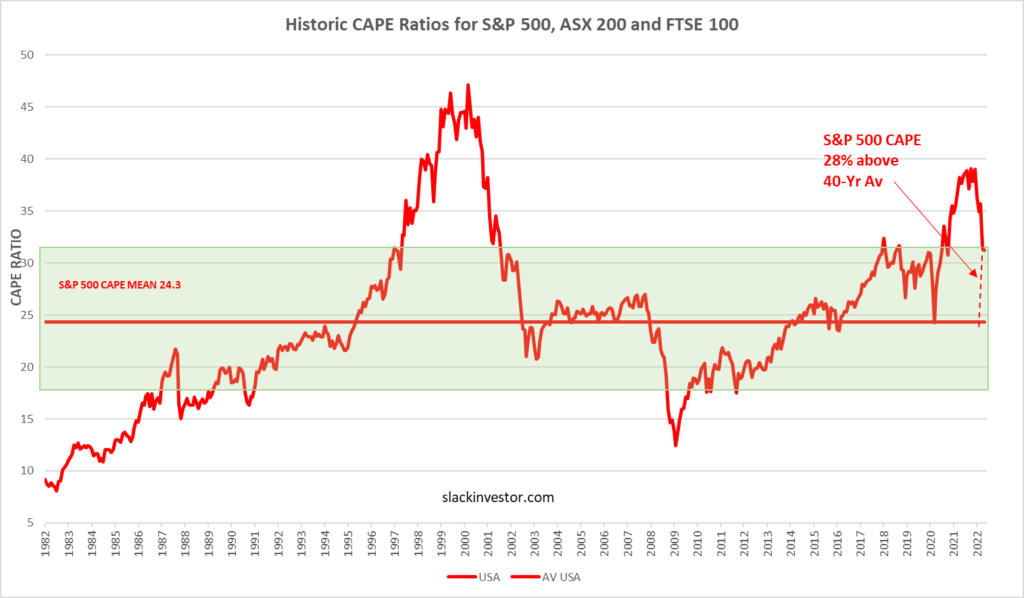
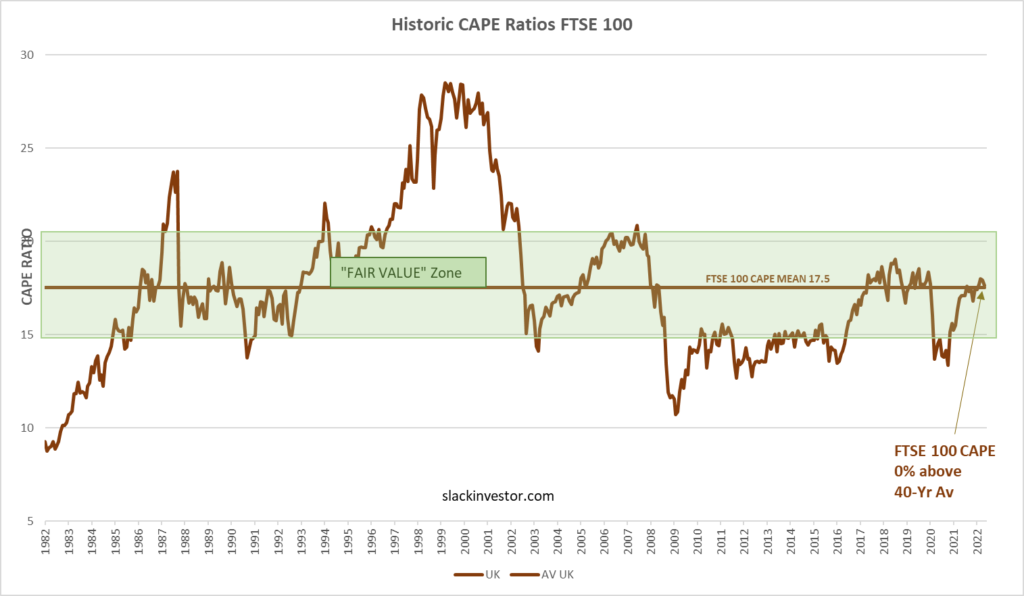
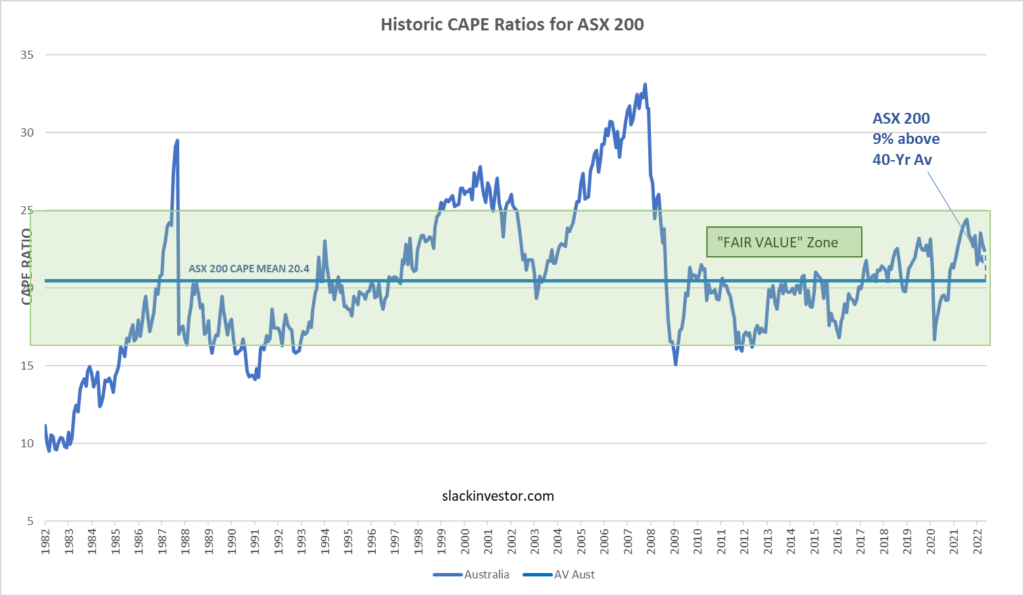
Slack Investor gets very nervous when the CAPE charts are well above the green “Fair Value” range. and would love to be a buyer when any of these markets show CAPE values below their 40-year averages.
However, as my “time the market” skills are limited, and my Stable Income pile is still producing, I am prepared to strap in and “enjoy”(not really!) the ride.
June 2022 – End of Month Update

The financial year closes and looking at the 12-month charts for FY 2022 – An official “Bear Market” for the US (>20% fall from a recent high) and big drops in the UK and Australian markets. The “blood in the streets” trend in world index prices have moved the ASX 200 below my stop loss of 6917 – This triggers a sell response.
However, I will not sell against the overall trend. Given that the ASX 200 is bouncing up a little today (01 Jul 2022), this means that I will go to a weekly watch on the ASX 200 – I will now wait till the end of next week to see if the ASX 200 continues to drop – or recovers. I have developed this “soft sell” approach when I gauge that the market is not too overvalued (see above ASX 200 CAPE chart).
Slack Investor remains IN the FTSE 100, TENTATIVELY OUT for the ASX 200, but OUT for the US Index S&P 500 due to a sell in January 2022.
All markets down for the month. The FTSE 100 (-5.8%), the S&P 500 (-8.4%) and the ASX 200 (-8.9%).
All Index pages and charts have been updated to reflect the monthly changes – (ASX Index, UK Index, US Index). The quarterly updates to the Slack Portfolio have also been completed.