

As much as Slack Investor hates retail shopping – he loves to have the opportunity to buy into companies. Like any new relationship, when you buy a stock, you are not really sure about how its going to work out – but its exciting!
I have never been good at predicting when the stock market will have a correction … and the current high valuations (PE Ratios well above the long term average) do make me nervous. However, Slack Investor would much rather be in the game than out of it and I have been looking for a few companies that would hopefully not suffer too greatly if a correction occurred in the stock market.
This is not advice … just an insight to the Slack Investor bumbling buying process. My rate of converting bought shares into winners of 55% is not that impressive – but my overall performance results are good.
I get heaps of buying ideas from investment sites such as Motley Fool, Livewire, ShareCafe. But I will always, always, check things out for myself before parting with any Slack Dollars. This involves a rigorous screening of the fundamental financial metrics PLUS a look at how the stock chart is going on Incredible Charts. This technical analysis consists of a quick scan to see if the chart is in a continual growth trend … or has just had a “breakout”, or broken out of a downtrend.
Let’s put on the buying boots. As well as the companies below, Slack Investor has also recently added to some small positions in PPK.ASX and TNE.ASX.
Slack Investor Buys Alphabet (GOOGL.NASDAQ)
Half of my buying cash went into an existing holding – Alphabet (GOOGL), This money making juggernaut is part of the new economy and I could buy this company all day. The first step is to go to the phenomenal MarketScreener.com. Registration is free on this site and they allow you to look at analyst data for up to 5 stocks a day.
Search for your stock and then finding the Financials Tab for that company. Firstly, I look at the chart Income/Sales and Earnings per Share. An increasing trend is good and, if the estimated earnings (2021 – 2023) are also increasing, I’m acutely interested. I do a quick check on debt levels. Alphabet is a cash king – has more cash than debt – solid tick.
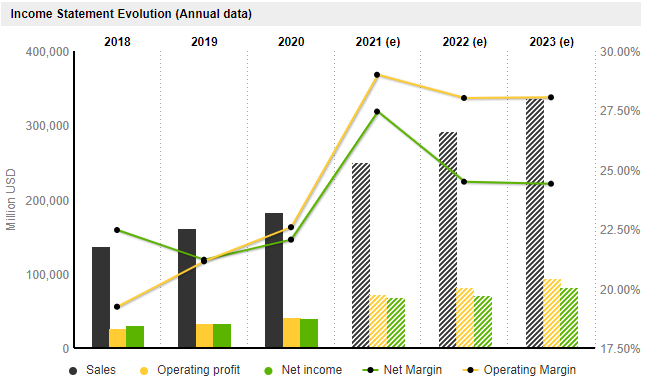
I continue with MarketScreener to extract the Return on Equity (ROE), both past and forecast. I hope that it is above 15% – Big Tick. The final bit of vital information is the Price Earnings (PE) Ratio and it is here that I gauge whether the stock price is too high for Slack Investor. For a good growth stock, I try not to buy into companies that have a projected PE of more than 40-(50 at a pinch). The analyst estimates for GOOGL is a forecast PE of 23.0 in 2023 – Tick
| YEAR | 2018 | 2019 | 2020 | 2021(e) | 2022(e) | 2023(e) |
| ROE | 18.6 | 19.3 | 19.0 | 27.2 | 25.8 | 25.2 |
| PE Ratio | 23.9 | 27.2 | 29.9 | 28.0 | 26.6 | 23.0 |
Slack Investor Buys NASDAQ 100 ETF (NDQ.ASX)
Not everyone has access to direct access to US shares – if you only have an ASX broker, then to get exposure to Alphabet, a good substitute is to buy the BetaShares NASDAQ ETF (NDQ) – Alphabet represents 8.1% of this ETF – and you get profit machines like Apple, Amazon, Microsoft and Facebook thrown in. I topped up my holding here as well.
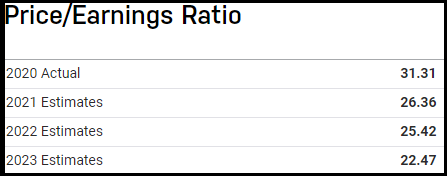
The ROE for the NASDAQ Index is 17.7 and increasing (30 June 21) – Above 15, Tick. The projected 2023 estimate for the Price/Earnings Ratio for the NASDAQ Index is 22.47 – Below 40, Tick – Very reasonable for growth sector companies.
Slack Investor Buys Coles Group (COL.ASX)
| YEAR | 2019 | 2020 | 2021(e) | 2022(e) | 2023(e) | 2024(e) |
| ROE | 29.8 | 32.8 | 37.0 | 34.9 | 33.3 | 34.3 |
| PE Ratio | 12.4 | 22.9 | 22.4 | 23.4 | 22.8 | 21.4 |
The Return on Equity (ROE) for this retail business is pretty impressive and, the PE Ratio would be pretty good for a growth company – but the Income Chart below reveals that Coles is not really a “growth” company – so the expectation is that the PE Ratios should be much lower, in the early 20’s or below would be the Slack Limits for slow growth companies.
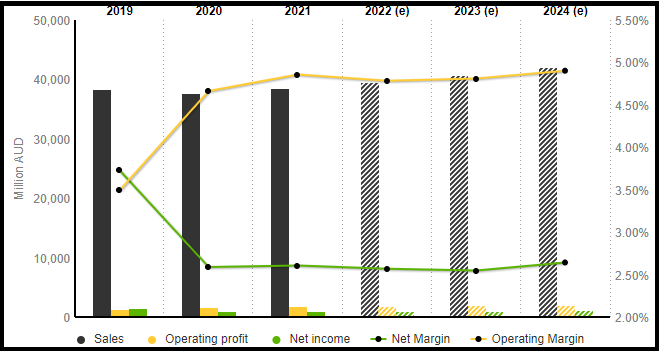
The income chart shows some pretty shallow growth and the slow earnings per share (EPS) growth makes the Coles Group something that Slack Investor would not usually be interested in. But, I go to Coles Supermarket at least twice a week and I actually like going there as a company part owner. Coles is in the “stable income” section of the Slack Portfolio rather than “Growth”. Even if the worst of times was thrust upon us and there was a recession in the next few years, a business like Coles will keep on performing. I would much rather put up with the price fluctuation of shares and have my money in a business like this at a projected yield of 3.5 – 4% p.a. than have Slack Dollars tied up in cash for 2 years in a Big 4 bank term deposit at 0.3%.
August 2021 – End of Month Update

Slack Investor remains IN for Australian index shares, the US Index S&P 500 and the FTSE 100.
There were significant rises in all followed markets (S&P 500 +2.9%, and the FTSE 100 +1.2%). The Australian stock market is also in record territory (ASX 200 +1. 9%). This is all happening during extensive COVID-19 related lockdowns in the populous South Eastern part of Australia.
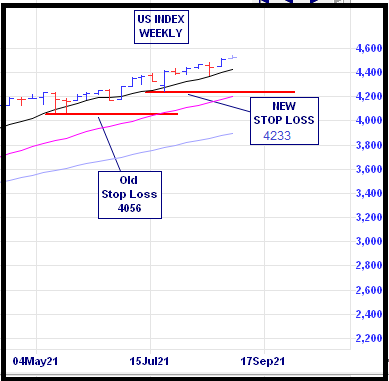
Slack Investor is normally relaxed about most things, but I am moving to the edge of my couch and starting to get ready for action. Looking at the monthly charts for all the indexes, in these boom times, the index prices have been getting too far ahead of my stop losses for comfort. I have tightened up my rules for adjusting stop losses upwards.
All Stop Losses are live and are being moved upwards every month if the index price exceeds the stop loss by 10% or more. All Indexes have got this treatment this month – It is sometimes difficult to work out where to put the stop losses on the monthly chart. I usually go to the weekly charts and find a minimum on the weekly price range that is within 10% of the current price (see below). If the stock price is below the stop loss at the end of the week – I will usually sell at the next opportunity.
All Index pages and charts have been updated to reflect the monthly changes – (ASX Index, UK Index, US Index).