Financial Year 2022 Slack Results

“When you can measure what you are speaking about, and express it in numbers, you know something about it. ”

Lord Kelvin (William Thomson, Mathematician and Physicist, 1824-1907)

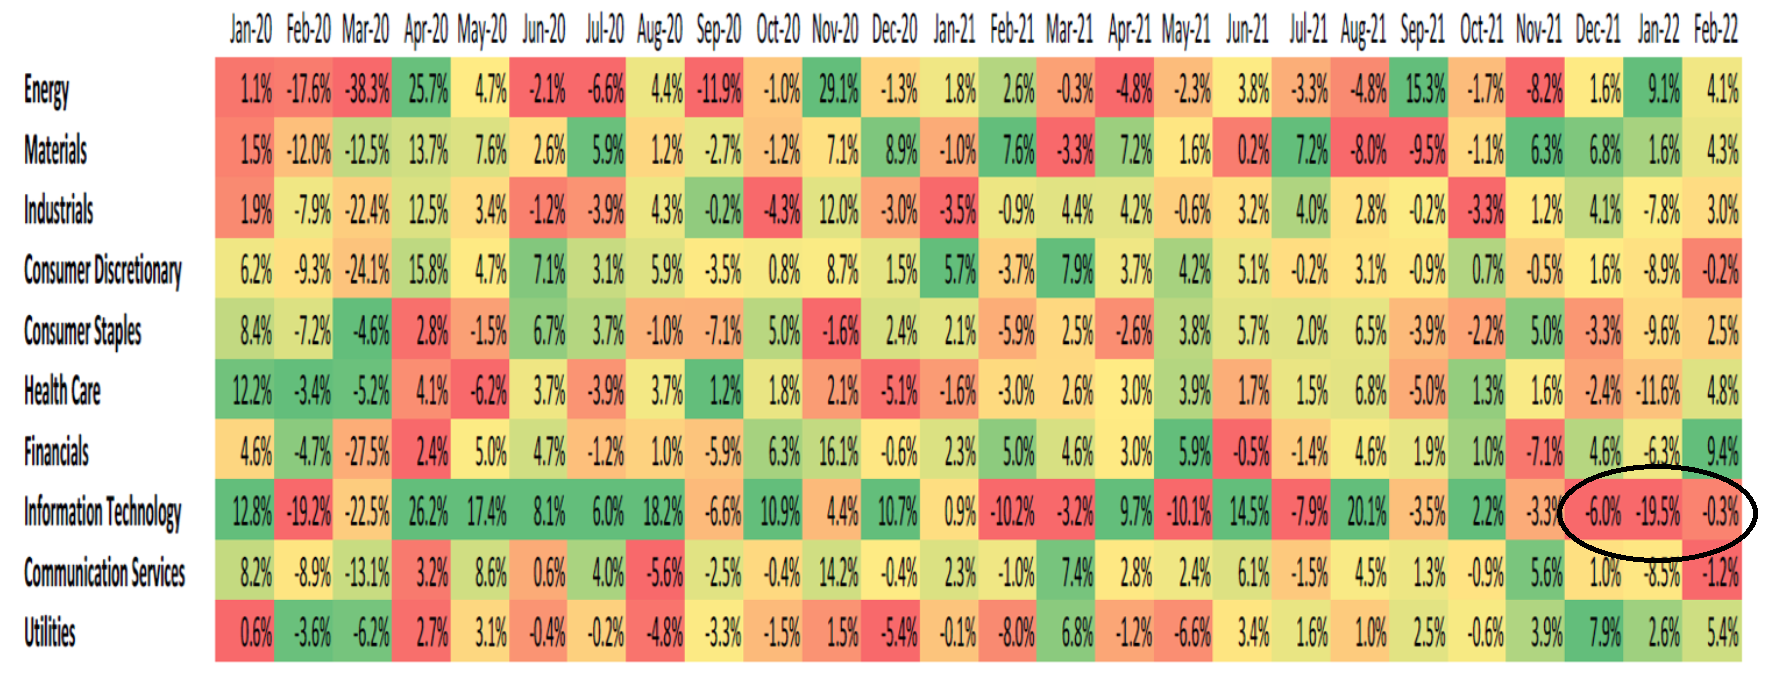
Slack Investor reflects on a tough investing year. I have mostly “stuck to my guns”  investing with growing companies that have an established earnings record and forward P/E ratios <50. There have been a few lapses (e.g. XRO) which had a forward PE ratio of about 100 when I bought it last financial year … and, I paid the price when the higher interest rates and threats of inflation caused a rapid change in valuation of most tech stocks.

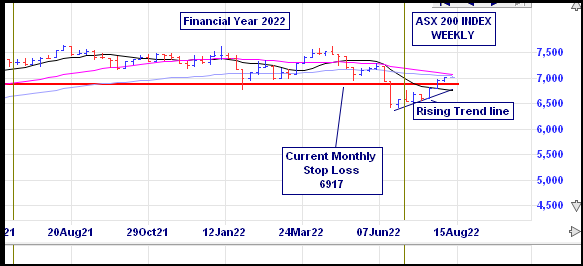
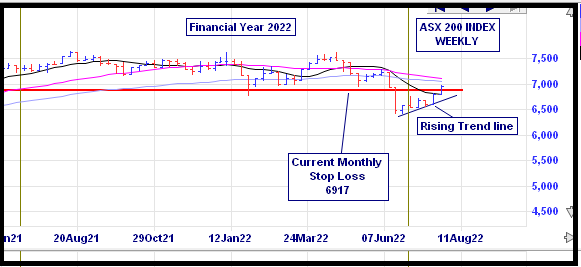
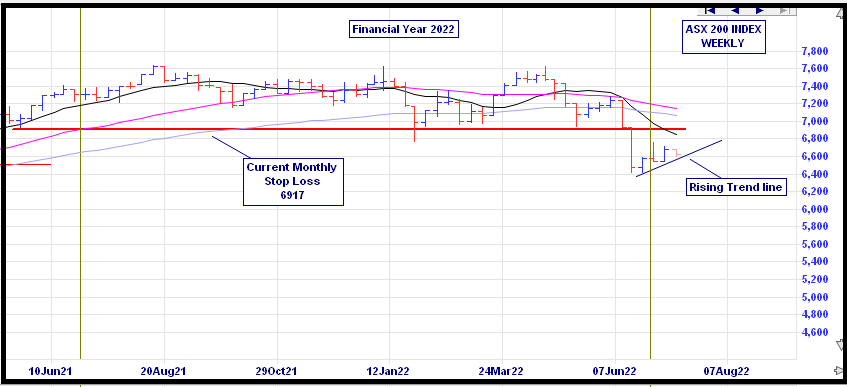
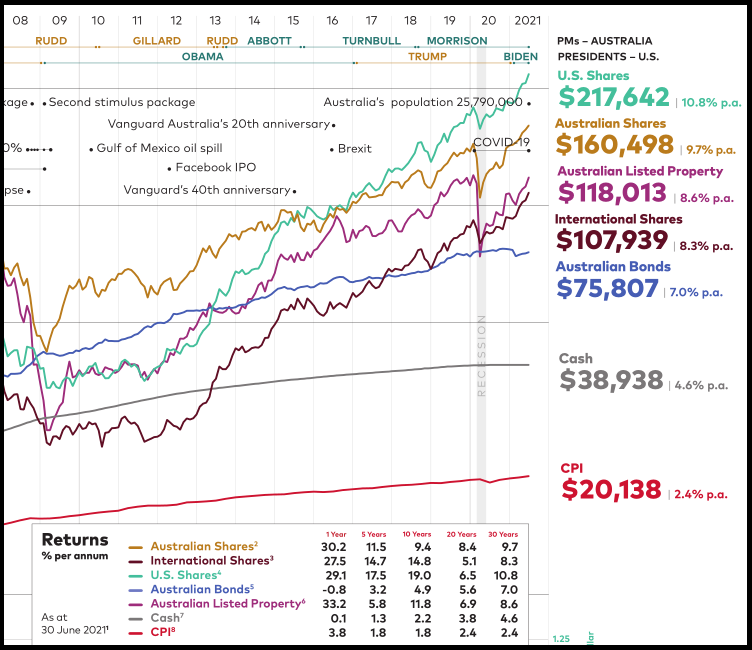
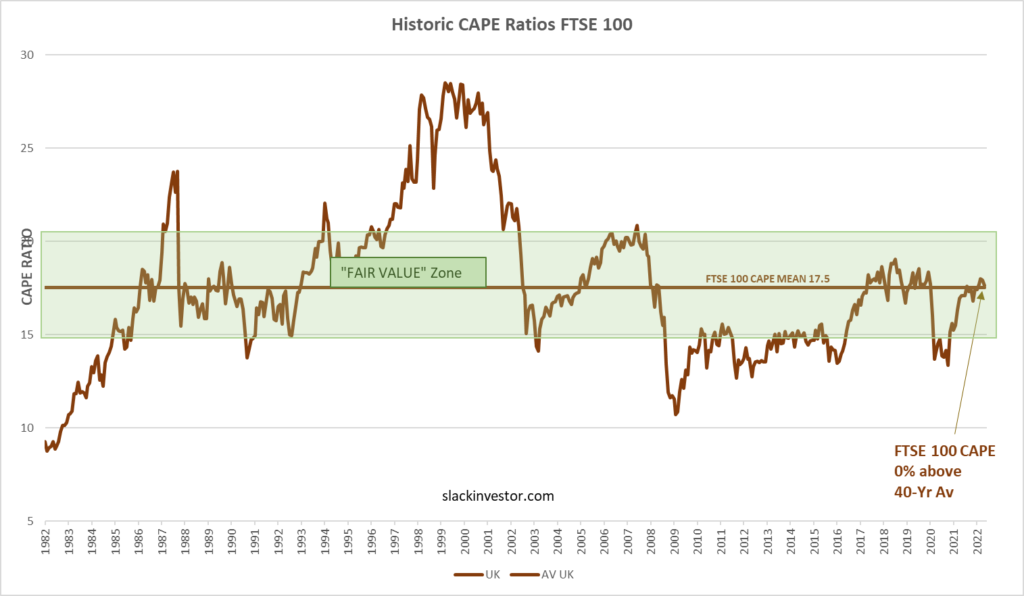
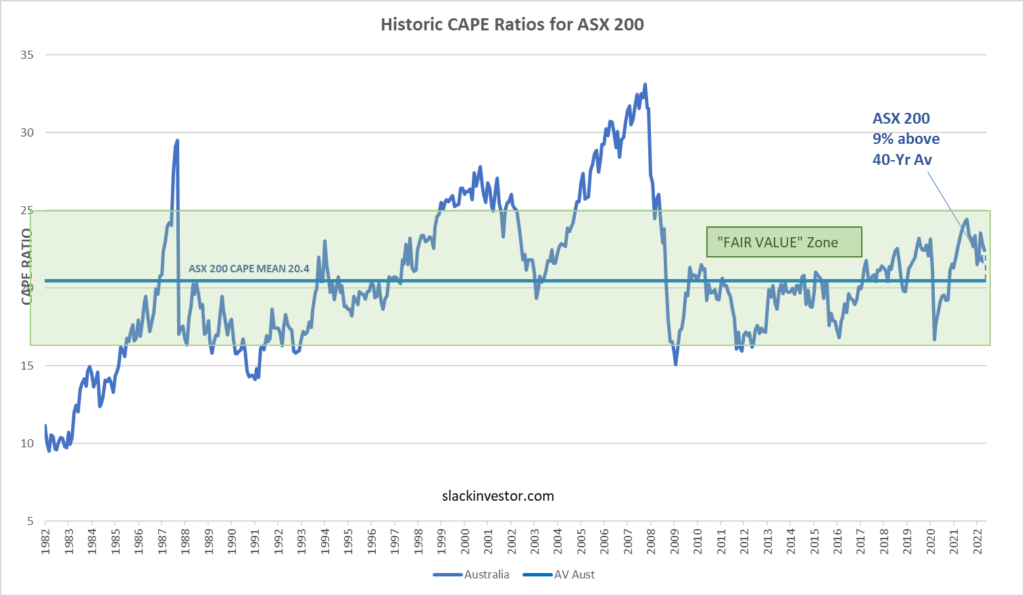
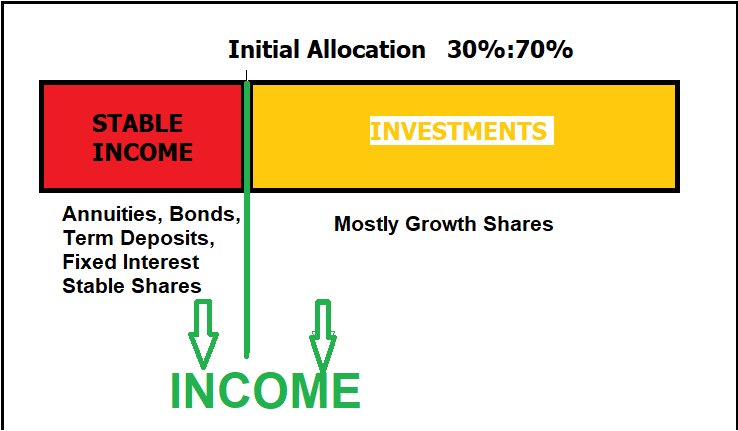
I expect a bit of volatility in my mostly “growth” investment portfolio and I try to reassure myself that, despite the odd negative year in the Slack Investment Portfolio the Stable Income portfolio is doing its job and keeping Slack Investor with enough cash to keep things running. In the world markets, the FTSE 100 Total Return Index was up 5.7% (last FY down 13.8%). Dividends helped the Australian Accumulation Index to be down 7.5% for the financial year (last FY +27.8%). The S&P 500 Total Return Index took a breather at last – and was down 10.7% (last FY up 36.4%) for the same period. All of these Total Return Indexes include any accumulated dividends, wheras the chart below of the ASX 200 for FY 2022, just shows stock prices.

The ASX 2oo Weekly chart for FY 2022- Dividends helped stem the losses for FY2022, but the ASX Accumulation Index is still down 7.5% for the FY – Incredible Charts – Click for better resolution.

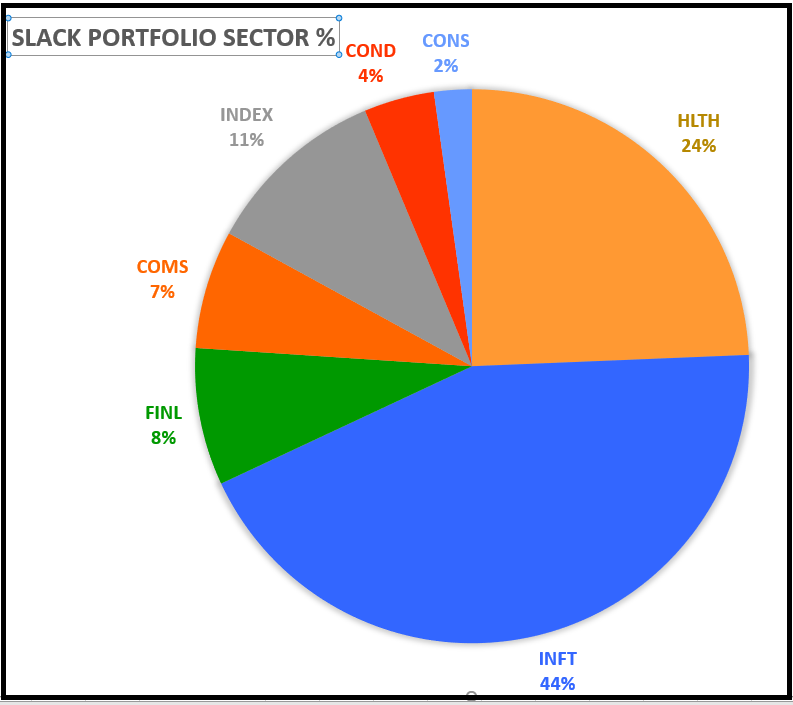
Slack Portfolio Results FY 2022

All Performance results are before tax. The Slack Portfolio is Slack Investor’s investment portfolio and it had its first negative year since its establishment in 2010 – with an annual FY 2022 performance of -14.3%. Full yearly results with benchmarks are shown in the table below. It was a challenging year for all of my benchmarks that were exposed to sharemarkets (Median Balance Fund -2.5%, Vanguard Growth Fund -13.0%, ASX 200 Accumulation -6.5%).

Slack Investor seems to be clueless in real estate predictions … I have thought for some years that there must be a sizable correction soon – as the prices are still stratospheric in Melbourne and Sydney compared to incomes. The correction may still yet happen as interest rate rises are yet to take their toll.

The Brisbane real estate market was the place to be for FY 2022 (+25.6%) on top of a big year last year!) – Inflation was also a suprise for the challenged Slack Investor – with the CPI at +6.1%.

YEAR SLACK FUND MEDIAN BAL VGARD GROWTH ASX200Acc RES BRIS RES MELB CASH CPI
2010 6.6 9.8 12.3 13.1 10.8 26.9 4.2 3.1
2011 2.5 8.7 9.1 11.7 -2.4 0.9 4.4 3.7
2012 8.3 0.4 1.3 -6.7 1.3 -0.9 4.3 1.2
2013 26.5 14.7 18.6 22.8 7.7 8.3 3.2 2.4
2014 23.6 12.7 14.5 17.4 11.5 12.8 2.6 3.0
2015 2.4 9.6 11.8 5.7 7.7 15.6 2.5 1.5
2016 14.2 3.1 4.2 0.6 8.4 9.5 2.2 1.3
2017 19.5 8.1 8.8 14.1 6.5 17.7 1.9 1.9
2018 37.6 7.2 10.0 13.0 5.2 3.9 3.9 2.1
2019 19.7 6.2 9.8 11.5 1.7 -6.0 2.0 1.3
2020 9.4 0.3 0.6 -7.7 8.4 13.8 1.1 -0.3
2021 21.7 13.0 20.3 27.8 17.9 10.7 0.2 3.8
2022 -14.3 -2.5 -13.0 -6.5 25.6 3.1 0.3 6.1

The Slack Fund yearly progress vs BENCHMARKS. The Median Balanced Fund (41-60% Growth Assets)Vanguard Growth FundASX 200 Accumulation IndexCorelogic Residential Property Home Value Index in both Brisbane and Melbourne, and Cash (Australian Super Cash Fund) and Consumer Price Index (CPI)

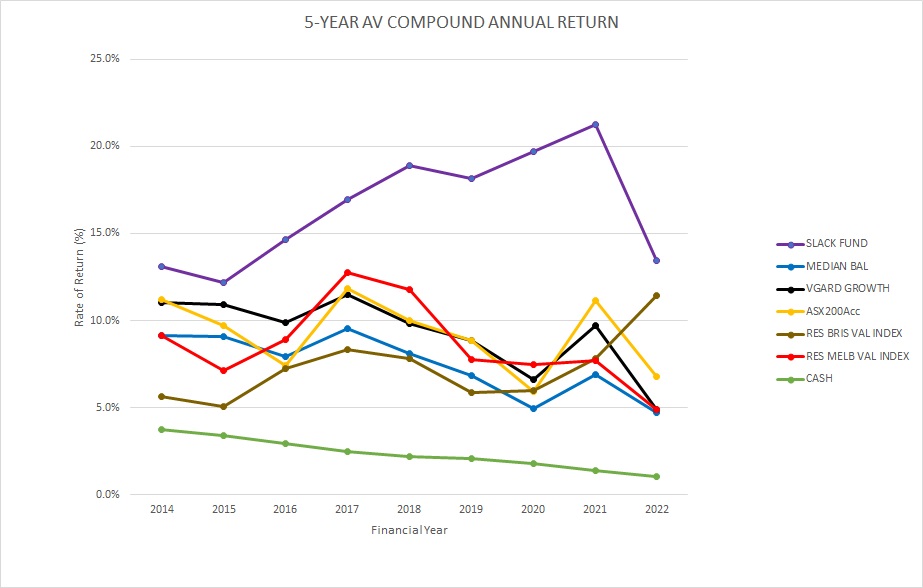
However, the five-year compound annual performance gives me a much better idea about how things are going and will smooth out any dud (or remarkable!) results. The Slack Fund is still ahead of Benchmarks – but currently being challenged by Brisbane Residential real estate.

Slack Investor 5-year compound annual rate of return – compared to benchmarks – Click for better resolution.

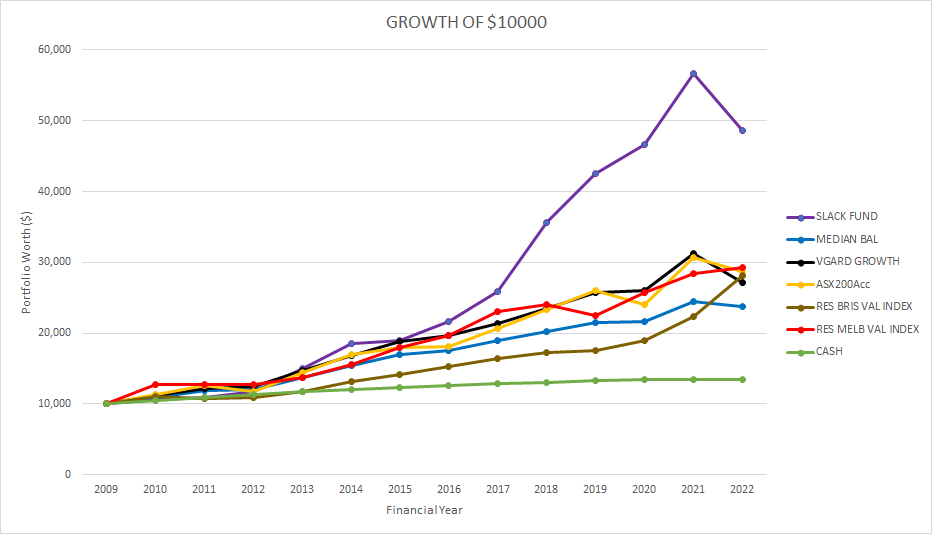
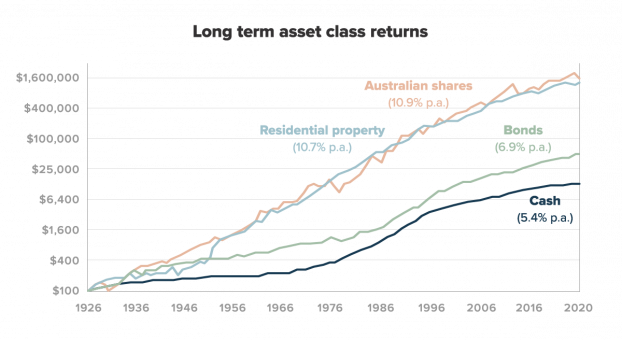
The beauty of compounding with a succession of good performance results can be seen in the chart below showing the growth of an initial investment in June 2009 of $10000.

The rate of growth of $10000 invested by Slack Investor in FY 2009 – compared to benchmarks – Click for better resolution.

10-year compound annual rate of return

The Slack Fund has been around a while and, at last, I am generating some long term data (10-year compound “rolling” annual rate of return). Over this time frame, the Slack Fund has been performing very well. A long-term annual rate of return of over 15% – Go Slack Fund!

However, the 10-yr rates of return of the Median Balanced Fund, Vanguard Growth fund, ASX200, and residential property in Brisbane and Melbourne are also great long term investments, generating a 10-year compound annual rate of return of at least 7% p.a.

YEARSLACK FUNDMEDIAN BALVGARD GROWTHASX200AccRES BRISRES MELBCASH
201915.68.010.05.88.52.9
202015.97.07.85.57.32.6
202117.97.49.37.58.32.2
202215.27.18.19.39.98.71.8
The Slack Fund 10-year compound annual “rolling” rate of return – compared to benchmarks- The Median Balanced Fund (41-60% Growth Assets)Vanguard Growth FundASX 200 Accumulation IndexCorelogic Residential Property Home Value Index in both Brisbane and Melbourne, and Cash (Australian Super Cash Fund). The Vanguard Growth Fund was established in 2012 and has only just been able to generate a 10-yr rate of return.

FY2022 Nuggets and Stinkers and … July 2022 – End of Month Update

 So the last shall be first, and the first last: for many be called, but few chosen 

Matthew 20:16 – King James Version of the Christian Bible

Slack Investor is not a very religious person – but he is a numbers man and 84% of the global population identifies with a religious group – so I have to go with the flow here. This sort of majority demands respect. The Christian disciple Matthew was reporting on one of Jesus’s teachings. Biblical scholars think that Jesus was trying to point out that Heaven’s value system is far different from earth’s value system.

The “Last first and First last” might also be applied to how some of the Slack Portfolio stocks have been going over consecutive years. There seems to by a cycle of last years Nuggets … might end on the Stinker pile the year after – and vice-versa. Growth stocks have many virtues … but they are not immune to the cycles of price – bouts of overvaluation followed by a period of undervaluation.

The percentage yearly returns quoted in this post include costs (brokerage) but, the returns are before tax. This raw figure can then be compared with other investment returns. I use Market Screener to analyze the financial data from each company and extract the predicted 2024/2o25 Return on Equity (ROE), Dividend Yield and Price/Earnings (PE) Ratio on the companies below. This excellent site allows free access (up to a daily limit) to their analysts data once you register with an email address.

Slack Investor Stinkers – FY 2022

Financial year 2022 was the Pepé Le Pew of all of Stinktown for Slack Investor.I hold mostly growth shares in the technology and healthcare sectors. These sectors have been heavily punished across the world so far in 2022.

This is the first time I have had a negative result for my investments over a financial year since 2009. Slack Investor is a great believer in long term investing returns – usually evaluated over a 5-year period – so this year’s result, while painful, does not change my overall strategy.

Three of my “stinkers” this year were actually “nuggets” from last year. For FY 2020, Codan +161%, REA +59% and IDX +37%. Such is the cyclic nature of some growth stocks.

Codan (CDA) -58% (Still held)

Codan - Niramar

(CDA – 2025: PE 14, Yield 3.8%, ROE 25%) Codan is a technology company that specializes in communications and metal detecting. This company was one of my big nuggets last year (+161%) – so I should not have been really surprised that there could have a bit of a pullback. The decline hurt, but the fundamentals of the company remain sound. Holding on.

Xero (XRO) -41% (Sold)

Xero

(XRO2025: PE 81, Yield 0.3%, ROE 15%) Xero is an innovative cloud -based accounting provider for small business. Every business owner that Slack Investor talks to say that Xero is a boon to their business. This sort of “word of mouth” got me over-excited this year and I just held my nose and jumped in – against all my rules of avoiding the excessively high forward PE ratios of over 50! It is these high PE companies that are usually punished first in a downturn – and that’s exactly what happened. I still look at it and think its a decent growing business – but I can feel the recent bite!

Integral Diagnostics (IDX) – 39% (Still held)

Integral Diagnostics | Medical Imaging Services | Australia | New Zealand

(IDX – 2024: PE 16, Yield 4.5%, ROE 12%) This medical image company provides diagnostic image services to GP’s and specialists. IDX was another of my nuggets from last year (+37%) that has just shed all of last years gains. The Return on Equity of this company is starting to get a bit low (<15%) – But the PE and yield seem OK. Will keep this company on watch for the moment.

BetaShares Asia Technology Tigers ETF -33% (Still held)

(ASIA – 2022: PE 14, Yield 0.7%,) Growth in Asia … What could go wrong! Plenty it seems.

These “technology tigers” that make up this ETF have been part of a global selloff of tech-related shares this year. 

A lot of the Chinese companies (such as Alibaba) have been marked down because the Chinese government imposed its will on a few industries. Also the US government has hinted at action on Chinese companies that have listed on American market. However, the ASIA ETF has large holdings in such monsters as Taiwan Semiconductors, Samsung and Tencent Holdings – so I will accept the current pain and stick with this as a long-term holding

REA Group (REA) -33% (Still held)

File:REA Group logo.svg - Wikipedia

(REA – 2024: PE 29, Yield 1.8%, ROE 32%) The owners of RealEstate.com.au. which is the go to portal for house selling and buying. 65% of Australia’s adult population are checking the site every month looking at property listings and home prices. Another long-term holding.

I have only listed the stinkers that lost over 30% this year … sadly, there were many more rogues that lost over 15% for the Slack Fund. They include PPK Group (PPK) -28%; Altium (ALU) -25%; Nick Scali (NCK)-20%; Pushpay Holdings (PPH)-16%; and A2 Milk (A2M)-15%.

Slack Investor Nuggets – FY 2021

Nuggets were few and far between this year. A great benefit of investing in companies that have a high Return on Equity (ROE), and with a track record of increasing earnings, is that they sometimes behave as “golden nuggets”.

Technology One(TNE) +17%

(TNE – 2025: PE 34, Yield 1.7%, ROE 36%) This Software as a Service (SaaS) and consulting company continues to be profitable. This year is the 13th year in a row of record half-yearly profits. A high 2025 PE of 34 (Expensive) is a little scary but, if the high Returns on Equity (36%) remain, on balance, this is OK.

Macquarie Group (MQG) +10%

Commonwealth Bank Macquarie Group Finance Westpac, PNG, 1800x600px,  Commonwealth Bank, Australian Dollar, Bank, Brand, Finance Download

(MQG – 2025: PE 25, Yield 4.0%, ROE 13%) Macquarie is a complex business with a range of banking and financial services, and plays in global markets and asset management. Once again, the management seem to know what they are doing – Slack Investor remains a fan.

Honourable mention to the only other company that ended in the black – Coles (COL) a decent +8% in these troubled times.

Slack Investor Total SMSF performance – FY 2022 and July 2022 end of Month Update

In a year that Chant West describes as “a rough year for markets”. Following FY2021, which was one of the strongest years for Super funds (+18% for FY21), things have now lurched south with the median growth fund (61 to 80% in growth assets) returning -3.3% for FY22.

The FY 2022 Slack Investor preliminary total SMSF performance looks like coming in at around -14%. However, the 5-yr performance is a more useful benchmark to me – as it takes out the bouncing around of yearly returns. At the end of FY 2022, the Slack Portfolio has a compounding 5-yr annual return of over 13%.

Despite a breach of the stop loss for the ASX 200 last month, Slack Investor remains tentatively IN for Australian index shares on a dramatic rise of 5.7% this month. The FTSE 100 also had a good month (+3.5%)and I remain IN. The US Index S&P 500 eclipsed them all with a remarkable 9.1% gain – and I am now a BUY back IN.

Last month the ASX 200 price went below its stop loss. Slack Investor tries not to exit a stock against the momentum of the market, so I have been off the couch and closely watching the ASX 200. It has remained above the rising trend line and emerged above the monthly stop loss. I am tentatively still IN.

ASX 200 Weekly chart – From Incredible Charts

After a sell, it is important to have a notion when to get back IN to an Index or a stock. When trend trading, my main tool for finding a buy signal is a trend following (or momentum) system called the Directional Movement Index. There are many ways of setting up this system. Slack Investor likes the “smoothing” that is enabled by a system that looks back over the previous 11 periods – but the complexities are best left for the Resources page.

S&P 500 Weekly chart showing a BUY signal on the Directional movement Index weekly chart. The weekly price ranges are at the top and Average Directional Movement Index (ADX) patterns below – From Incredible Charts

In addition to the BUY signal from the Directional Movement Index for the S&P 500, the charts show a triggering of the “Wedgie” pattern where the stock price breaks through a long term down-trend. This reinforces the BUY.

All Index pages and charts  have been updated to reflect the monthly changes – (ASX IndexUK IndexUS Index).

Lifting the gaze … to a beautiful place

Earth  Australia  planet earth satellite view  SKU 0099 image 1
An “enhanced” satellite view of eastern Australia incorporating an “exaggerated relief” technique to emphasize the topography. The mountains of PNG and Indonesia are on the horizon.

It serves an investor well to occasionally lift themselves away from the day to day stresses of the world – and the trials of owning a share portfolio!

ASX 200 – The Australian Index

My previous post outlined a few of the difficulties of market timing and my decision to be tentatively out of the Australian Index according to my “market timing rules”. I also try not to trade against the market trend … and I would not sell while the weekly chart was looking positive.

ASX200 Weekly Chart FY 2022 – Incredible Charts

So far this has been the case, with the weekly chart just above the rising trend line. I will sell if the ASX200 is below the trend line and still below the stop loss at the end of the week. This gets to one of the problems of market timing – you can set up the most definitive strategy that will give you an objective selling point – but my heart is not in it as Slack Investor believes that the ASX 200 represents reasonable value at the moment. I am actually looking forward to the end of my 20-year market timing experiment – even though it does have the useful purpose of giving Slack Investor something to do in a market downturn.

Lifting the gaze

My absolute favourite way of lifting the gaze is to look at the Vanguard Asset Index chart over a long period. However, a later version than 2021 isn’t due out till mid August 2022 – so I have just shown last years version. The Long term asset class returns chart shown below – in a logarithmic scale, show that the asset classes of Residential Property and Australian shares – are the only really worthwhile games in town. When things just get too much in the day to day trading world – just sit on the couch and gaze in wonder at these two charts … and then perhaps doze off.

The importance of Australian shares in your portfolio | Stockspot
Long term Asset returns 1926-2020 – From Stockspot

Extract from the 2021 Vanguard Index chart (Just the 2008-2021 portion) – the dollar values on the right are the results of investing $10000 in index funds in each asset class for 30 years (since July 1991). – Check out the full glory of the Vanguard 2021 PDF chart – Click for better resolution.

Market Timing and Share Market Valuation … and June 2022 – End of Month Update

Trying to time the market is a losing game

In addition to the trading … and mostly holding onto individual companies, Slack Investor has been running an experiment on market timing for Index funds in the Australian, UK and US markets. The Index funds have been doing OK .. but Slack Investor is generally just finding that timing markets is just too hard and is hinting at an end to the timing experiment in 2024.

As a recap on the experiment so far, I am still outperforming the “Buy and Hold” investor in all followed markets – but the advantage is slim. Per annum outperformance is 1.4%, 1.9% and 0.6% for the ASX, UK and US markets respectively. Not really fantastic results when you consider that I am missing out on the dividends that “buy and holder’s” receive when I am “timed” out of the markets.

The Slack Index “timing the market” method was devised with a lot of back-testing on 30-years of market performances and does really well when sustained bear markets occur as it gets out of the market at a hopefully early stage in the price downturn. Ideally, the Slack method should stay in the market for the smaller fluctuations (corrections <~10%) and get out of stocks before it becomes a full bear market. The problem with my current strategy is that I am getting “whipsawed” out of the market in these smaller downturns – and the big swings seem to happen so quickly that the damage is done before I can get off the couch.

Things were much easier in the accumulation stage – I had set amounts of money coming out of my pay each month that would be automatically invested into my trading account. With dollar cost averaging, if the market went down, it would just mean that I would be able to buy a greater number of shares – all good.

It is different in retirement mode … as, I am not a net buyer of shares now and, as I am usually am fully invested, it is difficult to take advantage of a lower-priced market. These days, the stock market downturns are just something to be endured.

A chart that caught my eye from Current Market Valuation is shown below. They have a developed a method to try to see if a market is over, or under, valued using the cyclically adjusted price-to-earnings ratio (CAPE). This is very similar to the way that Slack Investor has previously tried to work out the valuation of the Australian, UK and US markets.

S&P CAPE data showing the 1950-2022 average (mean) P/E value of 19.8 (baselined as 0%), as well as horizontal bands showing standard deviation bands. As of June 24, 2022, the S&P500 P/E ratio is 47% higher than the 1950-2022 average – From Current Market Evaluation.

Current Market Valuation define the market as “Fairly Valued” if the CAPE Ratio is between between -1 and 1 standard deviation from the “average”. If the CAPE distribution is “Normal”, then the CAPE should be ranked as “Fairly Valued” about 70% of the time. 

Slack Investor has developed similar charts – but only since 1982. I have used only a short time frame for this analysis as there are good arguments as to why the CAPE should actually rise over time – and a small time range will tend to stop this distortion. The Green shaded areas correspond to the limits of one standard deviation of the CAPE from the 40-yr average values.

Slack Investor S&P 500 CAPE data showing the 1982-2022 average (arithmetic mean) P/E value of 24.3 at the end of May 2022 -“Fair Value” is represented by the green shaded area. Despite recent price drops, the S&P 500 CAPE is still well above average (28%) but at least in the broad “Fairly Valued” range now- Data from Barclays
Slack Investor FTSE 100 CAPE data showing the 1982-2022 average (arithmetic mean) P/E value of 17.5 at the end of May 2022 -“Fair Value” is represented by the green shaded area. The FTSE 100 CAPE is close to its 40-yr mean and well into the “Fairly Valued “range – Data from Barclays
Slack Investor ASX 200 CAPE data showing the 1982-2022 average (arithmetic mean) P/E value of 20.4 at the end of May 2022 -“Fair Value “is represented by the green shaded area – Data from Barclays

Slack Investor gets very nervous when the CAPE charts are well above the green “Fair Value” range. and would love to be a buyer when any of these markets show CAPE values below their 40-year averages.

However, as my “time the market” skills are limited, and my Stable Income pile is still producing, I am prepared to strap in and “enjoy”(not really!) the ride.

June 2022 – End of Month Update

The financial year closes and looking at the 12-month charts for FY 2022 – An official “Bear Market” for the US (>20% fall from a recent high) and big drops in the UK and Australian markets. The “blood in the streets” trend in world index prices have moved the ASX 200 below my stop loss of 6917 – This triggers a sell response.

However, I will not sell against the overall trend. Given that the ASX 200 is bouncing up a little today (01 Jul 2022), this means that I will go to a weekly watch on the ASX 200 – I will now wait till the end of next week to see if the ASX 200 continues to drop – or recovers. I have developed this “soft sell” approach when I gauge that the market is not too overvalued (see above ASX 200 CAPE chart).

Slack Investor remains IN the FTSE 100, TENTATIVELY OUT for the ASX 200, but OUT for the US Index S&P 500 due to a sell in January 2022.

All markets down for the month. The FTSE 100 (-5.8%), the S&P 500 (-8.4%) and the ASX 200 (-8.9%).

All Index pages and charts  have been updated to reflect the monthly changes – (ASX IndexUK IndexUS Index). The quarterly updates to the Slack Portfolio have also been completed.

Control the things you can control … Super Fees

File:Tax payment to a lord - BNF Fr9608 f11v.jpg
Tax payment to a lord – Meister der Apokalypsenrose der Sainte Chapelle

While the market is doing what it does and there is the feeling of Armageddon in the price of stocks, Slack Investor knows that he has no control over market sentiments and, as a welcome distraction, he is having a look at some of the things he does have control over – the fees that he pays for financial services. Superannuation fees are still too high – some of the highest in the OECD. This is a recurring theme for Slack Investor.

I like to think that the Slack fund is a pretty trim ship – but, there is always room for improvement. Slack Investor runs his family super through a Self Managed Super Fund (SMSF) – but this is not the best option for those who are time poor or, don’t want the stress of the management of your own retirement. On the plus side, for larger balances, if you use a low cost provider, it is relatively easy for a SMSF to restrict fees to less than 0.5% of funds under management.

High super fees linked with underperformance

Fees are the other most important factor when choosing a superannuation fund. You can’t control how markets perform, but you can control how much you pay for the management of your hard-earned money.

Stockspot Fat Cat Report 2021 – Annual Report on Superannuation funds by Stockspot that sorts each fund into “Fit Cats” (Good) and “Fat Cats” (Bad).

As a general rule, for profit (Retail) super providers charge fees in the 1.4-1.8 % and the not-for profit funds charge 0.8-1.0 %. For larger balances (>50K), if your annual fees are more than 1.0% of your total super balance then it is time to look elsewhere – try to get your super fees below 1.0%.

Fees Charged by APRA regulated super funds as a percentage of assets. For profit funds (Retail) funds compared to Not-for Profit funds (Industry funds) – From Crikey: Why the hell are our superannuation fees so high?

There is a clear correlation between high fees and long-term underperformance in superannuation.

Stockspot Fat Cat Report 2021

What to do?

I recommend all Australian readers to drag out their latest annual super statement and find the total amount of fees and charges. Divide the total fees by your total super amount (x 100) and you will have the percentage of your super that you are paying in fees.

Canstar have compiled a 2022 Outstanding Value Superannuation Award winners report that allocates a star rating for superannuation funds. based upon 5-year performance (after all fees) and features of each account. A four or five star rating is good. Their top rated funds for value in 2022 are all Industry funds and are listed below – these would be on the shopping list if I wanted to change my super fund.

Super FundType
Australian Retirement TrustSuper Savings
Australian Super Australian Super
Aware Super Personal
Cbus Super Cbus Industry Super
Hostplus Personal Super
UniSuper Personal Account
VicSuper Future Saver / Personal Saver

For more detail on how your super compares with others, there is a fantastic bit of superannuation comparison software, designed by Chantwest, called Apple Check. You have to give up some contact details for the form and access it through individual super fund sites … but they have provided great comparison info on super products to Slack Investor with no spamming. Worth doing if you are considering a switch and want to be fully informed of a fee comparison that applies directly to your situation.

I have compared two non-profit Industry funds (UniSuper and AustralianSuper) with a for-profit Retail fund (AMP Summit) for a nominal $300K account – in both Accumulation and Pension mode. Clearly AMP Summit has higher fees for both an Accumulation a/c and a Pension a/c. I would be happy to pay higher fees of a retail fund (AMP Summit) if there was an established increase in performance. However, the Apple Check report shows a 10-year net return (investment returns after all fees) of the retail fund is at least 10% worse than either industry fund.

Apple Check comparison of fees for ACCUMULATION accounts of $300K. Unisuper (0.48%), AMP Summit (1.22%) and AustralianSuper (0.72%).
Apple Check comparison of fees for PENSION accounts of $300K. Unisuper (0.57%) , AMP Summit (1.22%) and AustralianSuper (0.77%).

Market downturns are never easy, but Slack Investor knows that this time will pass – and in the meantime, I will pursue the distraction of fine-tuning the financial fees that I do have control over.

Know your worth – but keep it smooth … and May 2022 – End of Month Update

“…the worth of that is that which it contains, and that is this, and this with thee remains.”

William Shakespeare (1564-1616) – Sonnet 74

Slack investor is accepting that Bill had quite a way with words, and that he may have been making an assessment of how a character’s worth will live on with his own writings. He wasn’t talking about financial worth here – but Slack Investor has often drawn a long bow. It is fair to say that Shakespeare wasn’t a dill with money, as a result of his works, he was well off, but not super-rich. I am not sure if the Bard took his financial independence skills seriously – but he was an investor in land.

Tracking your net worth – particularly your investing net worth – is so important to your financial well being these days. Your investments net worth is a vital number that will be used to fund your retirement income. Using the 4% rule, if you divide your investment net worth by 25, you will get an idea of your annual income that this net worth will generate in retirement.

“When you understand that your self-worth is not determined by your net-worth, then you’ll have financial freedom.”  

Suze Orman – American financial advisor and TV and podcast host. She is a prolific finance author – A noble statement, however, not sure I agree with you here Suze. Self worth is so very important – but it’s a long way from financial freedom! Lets work on both.

Measurement of Net Worth

It is a trait of Slack Investor that he likes to measure things and put them on charts. Net worth is no exception. My mother would dismiss such things as crass – but tracking your Net Worth is quite a thing amongst the financial independence set. It is a simple matter of listing your assets and then subtracting your liabilities. Slack Investor likes to keep his house (that I live in) separate from other assets – It is your non-house assets that will fund your retirement.

“Know your worth. People always act like they’re doing more for you than you’re doing for them.”

Kanye West (Slack Investor is impressed with Kanye’s self worth!)

Let’s Smooth things out

The One … the only – Kenny G. Smooth Jazz – Why are people so unkind?

I learned an important investing lesson long ago – about not treating your temporary investment gains/losses as real things. They represent a transitory moment in the great oscillation between the times when the market price for your stocks is unreasonably high – to moments when they are unreasonably low. Such is the pattern of stock volatility.

Slack Investments Net worth tracked on a monthly basis for the past 5-years. The blue columns represent the Slack Net Worth. The red line is the “lagging” average of the previous 12-mth net worth totals. This is close to the “real” Slack net worth.

Although I monitor the price of my investments on most days, and collect monthly investment net worth totals, I have taken a lead from Kipling on how I treat these totals.

If you can meet with Triumph and DisasterAnd treat those two impostors just the same.

Rudyard Kipling – from the poem “If”

Because I grudgingly accept volatility as a price to pay for involvement in the wealth creating aspects of share ownership, I don’t accept the daily or monthly figures as real valuations of the Slack Net Worth.

I put my monthly totals in a spreadsheet and then take the average of the previous 12 months. By smoothing things out, the (red line) gives me an a figure that is close to what I think is my actual investment net worth. The reassuring thing is, that despite some serious monthly investment net worth declines in the past 5 years – December 2018 (-10%), March 2020 (-17%), and May 2022 (-12% so far!) – the red 12-mth “lagging” average line of Slack Net Worth has gone reassuringly upwards. This as been the case since I started tracking 12-mth average net worth back in 1991. An example of the excel spreadsheet that calculates the trailing 12-month Slack net worth can be found in the link below.

Believe me … this helps a lot in the testing times of a falling market.

May 2022 – End of Month Update

Slack Investor remains IN for Australian index shares and the FTSE 100 – but OUT for the US Index S&P 500 due to a sell in January 2022.

Another volatile month, with the S&P 500 ending up flat +0.0%. The FTSE 100 drifting upwards +0.8% and the ASX 200 down -3.0%.

All Index pages and charts have been updated to reflect the monthly changes – (ASX IndexUK IndexUS Index).

Is your democracy sausage a little warm?

Australia election: Fines, donkey votes and democracy sausages - BBC News

For those in far off lands, a “democracy sausage” is the exquisite mixture of sausage, onions and sauce wrapped in a slice of bread that you purchase from a charitable organizations as a “reward to self” after voting at an election booth in Australia. Australia is coming up to a national voting day on 21 May, 2022. This is a day I have always enjoyed as I exercise my democratic rights and vote. Although over half the world countries are designated as democracies, due to recent changes by national governments that curtail press freedoms and suppress dissent, there is the evaluation that less than 20 percent of the world’s people now live in a Free country!

But lets not get too depressed about things I have no control over. For now, Slack Investor does have a vote.

Fossil Fuels and Climate Change

For the progress of civilization, it seemed to be an excellent idea to use fossil fuels (Coal, oil and natural gas) to provide relatively cheap energy. These fuels took hundreds of millions of years to form as vast amounts of plant matter was converted into stored carbon.

Fossil fuels are non-renewable and currently supply around 80% of the world’s energy

Client Earth – February 2022

When we use these fuels for energy, the carbon combines with oxygen – and carbon dioxide is released. Carbon dioxide, is one of the “greenhouse gases”, that trap heat in our atmosphere, causing global warming. 

The problem is, that we have managed to release huge amounts of the stored carbon dioxide in the relatively short time since the industrial revolution.

From an IPCC Report showing the rapid observed increase in global temperature since the industrial revolution – especially since the 1950’s – Climate Change 2021: The Physical Science Basis

Firstly, we must recognise that global warming is a real problem for our Earth. There is ample evidence of climate change leading to rising temperatures, rising sea levels, decreased cool season rainfall for southern and western Australia and increased weather-related disasters. Our current amount of warming due to the rapid release of these greenhouse gases is 1.1°C. Urgent action is required if we are to keep the warming below 1.5°C- We can all do our little bit to reduce our fossil fuel consumption – But real change must be led by our governments.

Emissions of greenhouse gases from human activities are responsible for approximately 1.1°C of warming since 1850-1900, and finds that averaged over the next 20 years, global temperature is expected to reach or exceed 1.5°C of warming

IPCC Report, August 2021 – Climate change widespread, rapid, and intensifying

With the Australian election looming, I am grateful to a timely Ross Gittins article and to Climate Analytics for doing the hard work of actually assessing the impact of the politician promises to help reduce greenhouse gases in order to reduce global warming. They assess Liberal party policies as leading to a warming of 3.0°C by 2030: Labour party policies consistent with a 2.0°C of warming; Teal Independents and Green party policies are consistent with a 1.5°C of warming.

Emission reductions for 2030 are very important if the
world is to have a reasonable chance of limiting warming
to 1.5°C, the long-term temperature goal of the Paris
agreement.

Climate Analytics
Climate Analytics analysis of the likely effect of of the major Australian political parties climate policies on Greenhouse gas levels and global warming.

If you think that climate change is an important issue. Think about your vote.

Slack Investor usually writes about financial matters – but a recent survey of Australian economists found that 74% of them rated “climate and the environment” as the most important issue for this up-coming election.

Also, what is the use of having a blog – if you cant have the occasional rant!

Spurious Correlations … and April 2022 – End of Month Update

Cheese Before Bed Will Not Give You Nightmares

Slack Investor is a lover … of cheese. He follows all cheese related literature and was shocked by the revelation that “Death by Bedsheet Entanglement” is highly correlated (0.95 Pearson R correlation) with cheese consumption. The thought that over 800 people died in the US in 2008 at the hand of their sleeping equipment is terrifying.

A quick explainer on the correlation coefficient, it is just a way to measure how strong the relationship is between two variables. The correlation coefficient ranges between +1.00 (perfect positive correlation) through zero (no correlation) to -1.00 (negative corrrelation)

The close association between cheese and bedsheet deaths – Click Image for more detail – Data sources: U.S. Office of Management and Budget and Centers for Disease Control & Prevention – From tylervigen.com

Slack Investor salutes Tyler Vigen here – a bloke who wrote a program that crawls through unrelated government data sets to find spurious correlations. The above chart is one of these random pairs of data that were thrown together by his program. Almost 50 000 of these graphs that show unlikely correlations have been found so far – and one more is produce every minute! Hats Off Tyler.

Correlation does not mean causation

First lecture in Statistics 101

In the cheese consumption case, it is hard to think that eating cheese actually causes bedsheet entanglement. The first step when trying to establish a link between two variables is correlation. Then, most importantly, experiments must be done to show that A actually causes B – Is there a reason that makes sense? Some people link cheese to nightmares, but there is no scientific evidence linking cheese to death by bedsheet … so, this high correlation is probably just due to chance and a limited data set (10-yr). There is likely to be a missing other variable that’s the true driver that causes the correlation. I would speculate that both variables might be linked to general population trends – but this would have to be tested.

Using Sector Correlations in Investing

Slack Investor has been banging on a bit about “Sectors” lately. and despite not feeling the need to match his portfolio with the sectors of the S&P 500 (Or ASX 200), sector analysis can be useful.

My Investments portfolio consists mostly of “growth stocks” in the Technology and Healthcare sectors. The table below shows a high correlation of these sectors with the total market – they will tend to move with the general market during an occasional downturn. The Nasdaq Composite is down about 23% from its November 2021 high – the Slack growth portfolio is down about 7 % so far this financial year – Not fun, but I do expect the occasional down year.

Sector correlations with the US stock Market – A Sector that would exactly move up and down with the US stocks would have a correlation of 1.00. Low scores ie Utilities do not move up and down the same way as stocks. – From Morningstar 2000-2018 data

However, I want my Stable Income pile, 30% of non-house wealth, to be much more conservative. It holds annuities, fixed interest products and some shares. The shares in the Stable pile need to have a low correlation with the general stock market – as, when the stock market does poorly, I want this pile to be OK.

For my Stable pile, I choose stock sectors that are not highly correlated with stock market fluctuations (circled in red below). I already have some REITS (Listed Real Estate – Correlation 0.59), and some Consumer Staples (Correlation 0.57) which Perhaps I should buy some more Utilities and REITS (real estate). When I get an opportunity, I would like to buy some Utilities (Correlation 0.40) for the Stable pile.

I am always on the lookout for spurious correlations and the 19-year data set, in the above table seems sufficient (would like longer!). Do the correlations make sense? For example, it seems reasonable that Utilities would have a low correlation with the general market. It is a sector that would be able to keep its earnings and maintain its stock price – even during a market downturn.

An asset that has an even lower correlation to the S&P 500 is Gold – and is often seen as a “hedge” to to the stock market. Over a 20-yr period (2000-2020), Gold has a correlation of -0.28 with Australian Equities and -0.12 with Global Equities

Gold has a low (and at times, negative) correlation to other assets

ETF Securities

Smarter people than Slack Investor provide compelling reasons for including Gold in your portfolio – to improve long term returns. But the pig-headed Slack Investor has not yet overcome his old fashioned view that Gold is a speculative investment that does not earn a dividend or interest.

April 2022 – End of Month Update

Slack Investor remains IN for Australian index shares and the FTSE 100 but OUT for the US Index S&P 500 due to a sell – back in January 2022.

Despite some big daily fluctuations, the FTSE 100 (+0.4%) and The ASX 200 (-0.9%) ended relatively flat this month. All is not well in the USA where inflation fears and some mixed results from the Tech sector allowed the S&P 500 to fall -8.8%.

All Index pages and charts have been updated to reflect the monthly changes – (ASX IndexUK IndexUS Index).

Diversification … It’s a good thing … up to a point

This collection of herbs and spices makes me hungry – From Systematic Risk Systematic Value

Slack Investor tries to diversify his investment risk by keep a 70% growth oriented investments portfolio with a 30% stable income portion. So far this financial year, my Investments portfolio performance has been a bit lacklustre – so I have gone to the “hall of mirrors” and had a long, hard look at myself. I decided to do a sector analysis of my investments portfolio. The biggest revelation is the large proportion of Investments in the Information Technology (INFT) and Healthcare (HLTH) sectors.

A breakup of the Slack investments portfolio by sector. Dominated by Information Technology (INFT) and Healthcare (HLTH) – but a scattering of Financials (FINL), Broad Index-type funds (INDX), Consumer Discretionary (COND), Communication Services (COMS/TELS), and Consumer Staples (CONS)

Both of my main sectors have had a rough time these last few months – as can be seen by the monthly sector performance chart below. Materials (Resources) and Energy have done well – But these are sectors that I do not own.

Monthly Sectors heatmap for S&P 500 Sectors – Click on Image for better resolution – From Livewire

Slack Investor is not too old to learn new tricks … or, at least, evolve a little. so I was interested to see how my sector analysis compared with the US S&P 500 (below). I chose the S&P 500 f0r comparison as it not dominated by Financials and Resources like the ASX 200. My weightings are very different to the S&P 500.

Dow Jones 30,000: Here's Why It's Still Underperforming the S&P 500 and the  Nasdaq | The Motley Fool
S&P 500 Sector analysis – From The Motley Fool

Annual performance for each sector in the S&P 500

I came across a great graphic showing how each sector of the S&P 500 performs annually

10 yr excerpt from the annual S&P 500 Sector Performance ranking – Click on the Chart to get the full interactive experience – From Novel Investor

Some explanation of this beautifully coloured quilt is in order. The vertical columns represent each of the last 10 years performance of each sector of the S&P 500 in ranked order. The right hand column is for 2021. The 2021 sector leader was Energy (ENRS) after a long period in the doldrums. Next is Real Estate (REAL), Financials (FINL), Information Technology (INFT), S&P 500 (S&P), Materials (MATR), Health (HLTH), Consumer Discretionary (COND), Communication Services (TELS), Industrials (INDU), Consumer Staples (CONS) and Utilities (UTIL). The full glory of this graphic is found on the Novel Investor website with a bit of interactivity.

Some things that I have gleaned from this graphic

  • Every dog has its day – Depending on the year, each sector can have it’s day in the sunshine.
  • If you want neither the best of returns or the worst sector returns – buy the S&P 500 Index.
  • Often … if a sector tops the rankings in one year, it usually performs much worse in the next year.
  • The Information Technology (INFT) sector, to which Slack Investor is heavily exposed, is in the top four rankings for performance for 7 of the last 10 years. This year is not one of them.

Should I change my sector allocation?

There are good arguments for passive investing and, if I did not enjoy investing in individual companies, and my 5-yr results were not OK), then that is what I would do. To completely diversify my investment portfolio to match the S&P 500 would mean that I would be investing solely in an S&P 500 Index fund. This has been an excellent idea for the past 50 years.

Berkshire Hathaway has tracked S&P 500 data back to 1965. According to the company’s data, the compounded annual gain in the S&P 500 between 1965 and 2020 was 10.2%

From businessinsider.com

However, Slack Investor still thinks that the S&P 500 is over valued. Regardless of the current cycle, to invest in the whole index would be lumbering my portfolio with some cyclical and low growth companies.

I will continue to skew my investments portfolio with growing businesses – regardless of which sector they are in. I will not always get the company selection right – and will suffer the occasional whack. That’s fine, as long as I get it “mostly right”.

At the moment, many of the high P/E, growing businesses that Slack Investor owns are being sold down as analysts adjust down future earnings because of anticipated inflation. But the companies I own were usually selected for their ability to set their own prices and increase their earnings … these are the qualities of businesses that will prevail – regardless of short-term fluctuations.

Asset Decisions … and March 2022 – End of Month Update

Between Wealth and Love – by William-Adolphe Bouguereau– From Arthive.com (Private Collection)

Slack Investor doesn’t face such vexed issues as this poor young woman. In this sad, but beautifully painted, scene from the 16th Century there are two suitors – the old bearded one offering wealth in a jewellery box, while the young musician offers only love. Her gaze is turned away from both men and she has a despondent expression that suggests that the decision may not be hers alone.

My decisions seem feeble in comparison to the young girl depicted by Bouguereau. Looking at this painting just reinforces to me that men must do a better job of recognizing some of the often horrible decisions that women have to make. Sure, things have improved for women since the 16th Century – but there is still plenty of inequalities. It is the duty of all men to “lean in” and try to make things better.

Asset Allocation Decisions before the end of the financial year

Slack Investor likes to have a look at my income producing piles at this time of year – The Stable Income pile and the Investments pile. I have to decide how to allocate money for living expenses and how to allocate the amounts in my investment asset mix before financial year end to get it ready for next year.

Lets just back track a bit here and remember that Slack Investor finances were thrown into three piles before retirement– a HouseStable Income, and Investments. Now that I am retired and fortunately have my house paid off, there are only two piles that really concern me – The Stable Income pile (30 %) consists of Annuities, Bonds, Term Deposits and Fixed Interest. I have recently added some shares to this pile that I think won’t be too affected by a share market downturn. This share tranche consisting of a small amount of property trusts, consumer staples and infrastructure shares.

The other pile is Investments (70%)- consists of mostly growth shares (high Return on Equity, historical and forward earnings growth).

Despite the tough recent times for growth shares, after extracting living expenses, the total of the piles has grown slightly so far this financial year (0.2%). With 70% growth shares, positive pile growth will not always be the case. But my asset allocation strategy should help be ride out the bad times.

Dividend season is almost over and throughout the financial year I have taken out most of my living expenses from both piles using income from annuities, interest payments, distributions and dividends. At this stage, my current allocation is 29% Stable Income and 71% Investments. In order to maintain my 30%:70% asset allocation, if I need anymore living expenses I will take it out of my over-allocated Investments pile. I will make final adjustments at the end of the financial year – so that the initial allocations are roughly intact (30%:70%) – ready for the next year.

The decisions I make on asset allocation are to keep my nest egg in good shape – so that it continues to provide income. In a good year for investments most of my living expenses can be withdrawn from the Investments pile. In a bad year for investments, then I dip more into the Stable Income pile. Also, in a bad investments year, I might cut back on my discretionary expenses eg. Travel.

March 2022 – End of Month Update

Slack Investor remains IN for Australian index shares and the FTSE 100 but OUT for the US Index S&P 500 due to a sell in January 2022.

The FTSE 100 was flat this month (+0.4%). There were substantial rises for the ASX 200 (+6.4%) and the S&P 500 (+3.6%).

All Index pages and charts  have been updated to reflect the monthly changes – (ASX IndexUK IndexUS Index). The quarterly updates to the Slack Portfolio have also been completed.