Four of the planets that are visible to the naked eye – Saturn, Mars, Venus and Jupiter were aligned on April 24, 2022 at 4.40am visible from Southbank, Melbourne – SBS Australia
Planetary Alignment is a special thing, depending on which planets are involved – and their order. Sadly, Slack Investor wasn’t paying attention when 4 of the 5 planets visible to the naked eye (Mercury, Venus, Mars, Jupiter and Saturn) appeared in a line around the world on April 24 2022.
The bright string of lights in the morning sky (in April 2022) is thought to be a one-in-1000-year event.
Slack Investor is coming to the planetary alignment party very late and is now setting his sights on September 8, 2040, when five naked-eye planets (Mercury, Venus, Mars, Jupiter, and Saturn) will be within a circle of 9 degrees in the sky.
Investing alignment
Slack Investor may be a poor astronomer but one of his skills is noticing when two of the most important attributes in the stock market have an alignment – Value and Momentum.
Value investing involves looking at stocks that appear to be trading for less than what they are worth using a value screener like “book value” or the Price/Earnings ratio. Slack Investor likes to use the Cyclic Adjusted Price Earnings Ratio (CAPE) as a broad indicator of value – the lower the CAPE, the better the value.
Momentum investing just uses charts and indicators to pick out the current movement of a stock. Based upon the theory that – If the trend is upwards … it is likely to continue upwards. This is tricky though … the trend is your friend … until it isn’t!
Because trend trading is difficult, I always like a bit of assurance or alignment with value. Ideally, I like valueand momentum in a stock before parting with Slack cash.
Value
It has been 6 months since I produced a set of index value charts based upon CAPE to look at how the markets are travelling.
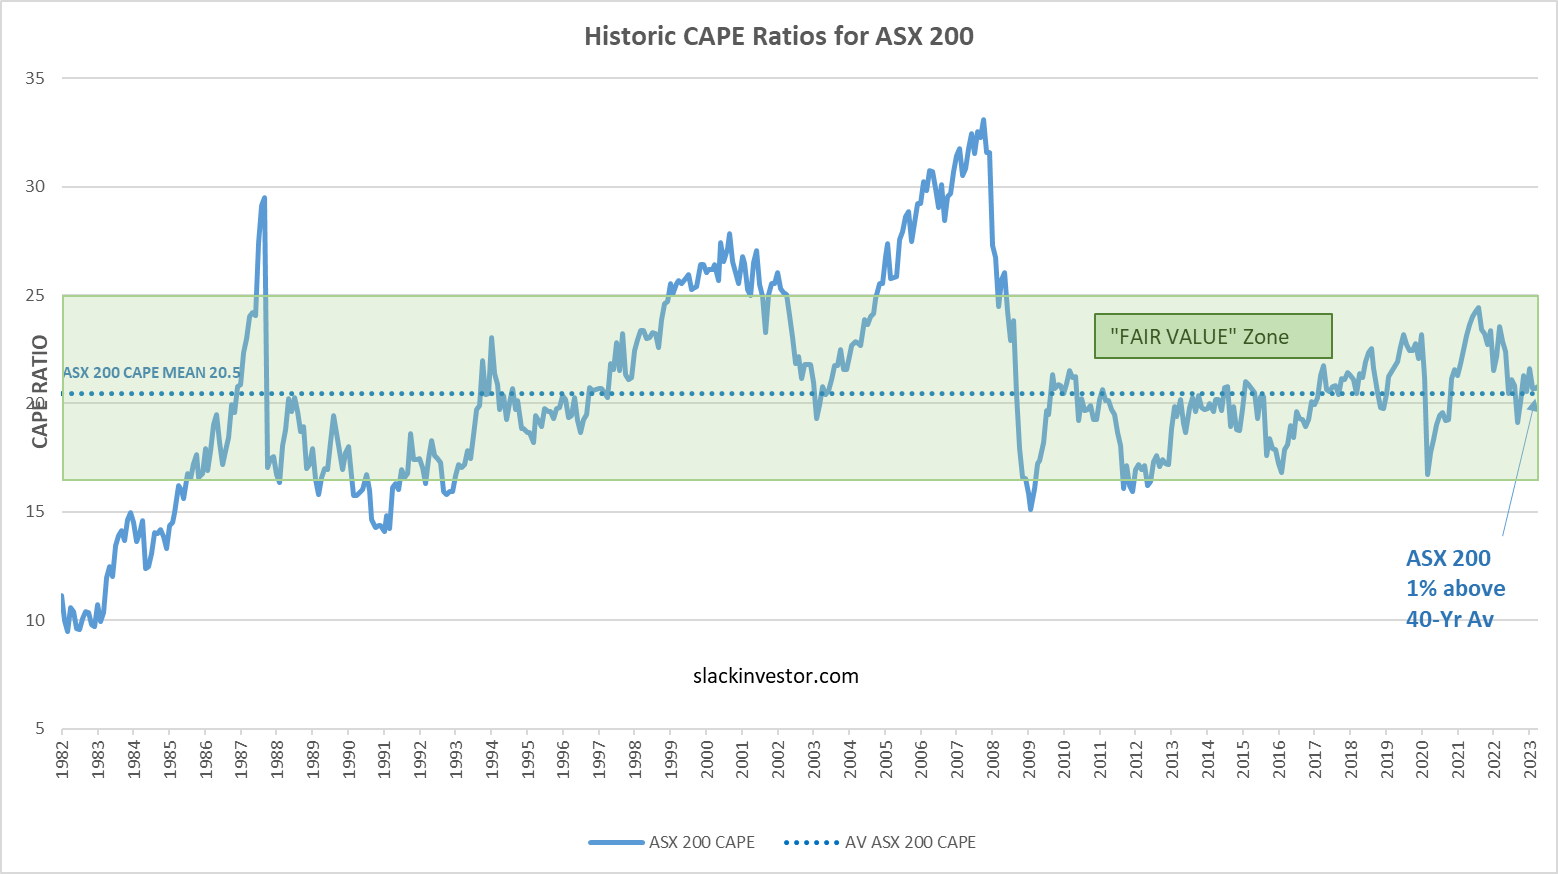
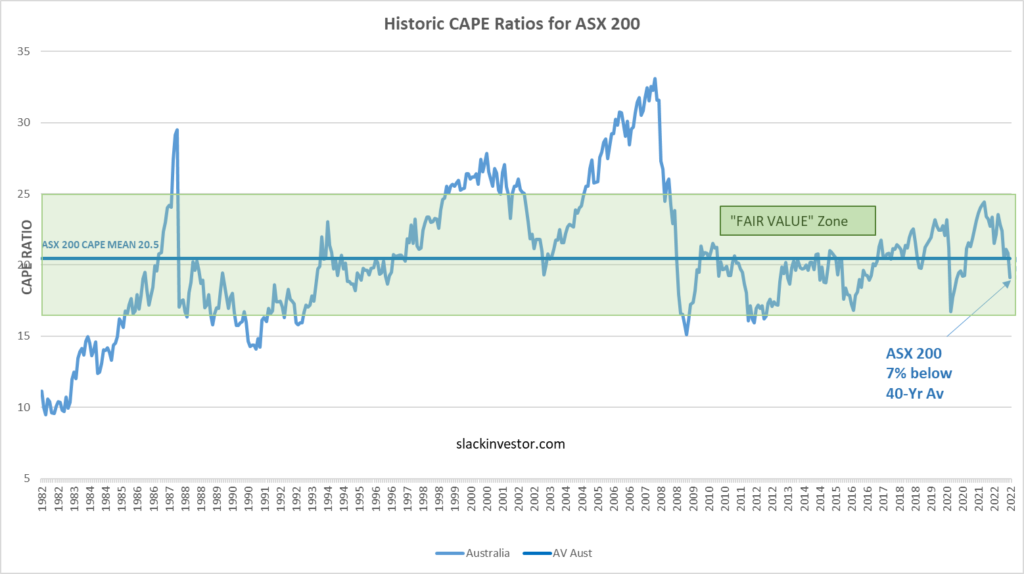
As with individual companies, the whole share market will oscillate between overvalued and undervalued. Slack Investor has written about the Cyclically Adjusted Price to Earnings ratios (CAPE) which use ten-year average inflation-adjusted earnings. By plotting this CAPE over a period of time, we can look at how the whole sharemarket is currently valued in terms of historical data.
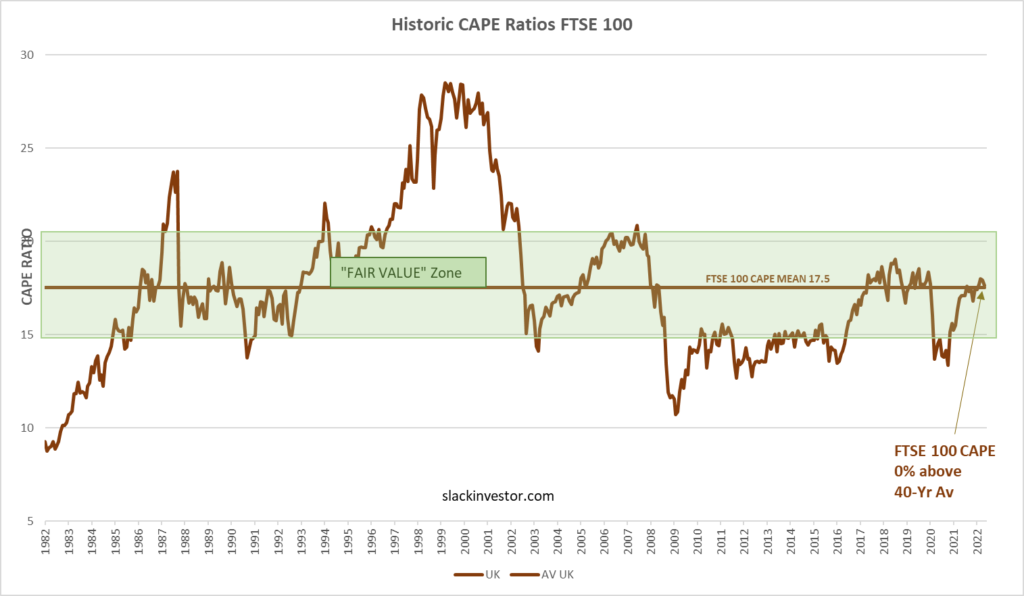
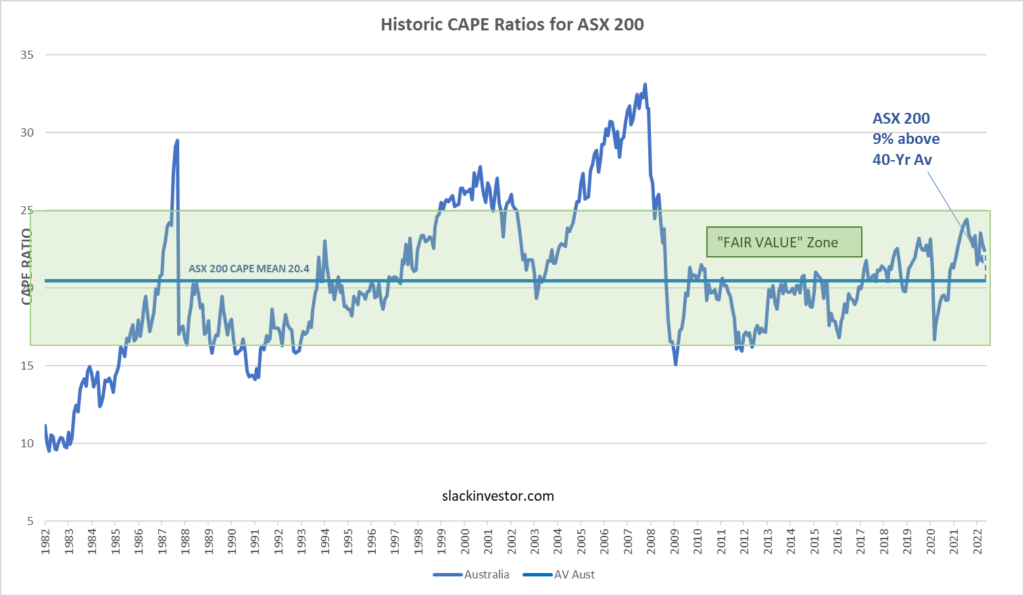
Using monthly CAPE data from Barclays, the 40-yr mean is calculated and plotted together with the CAPE values. A “fair value” zone is created in green where the CAPE is within one standard deviation of the mean.
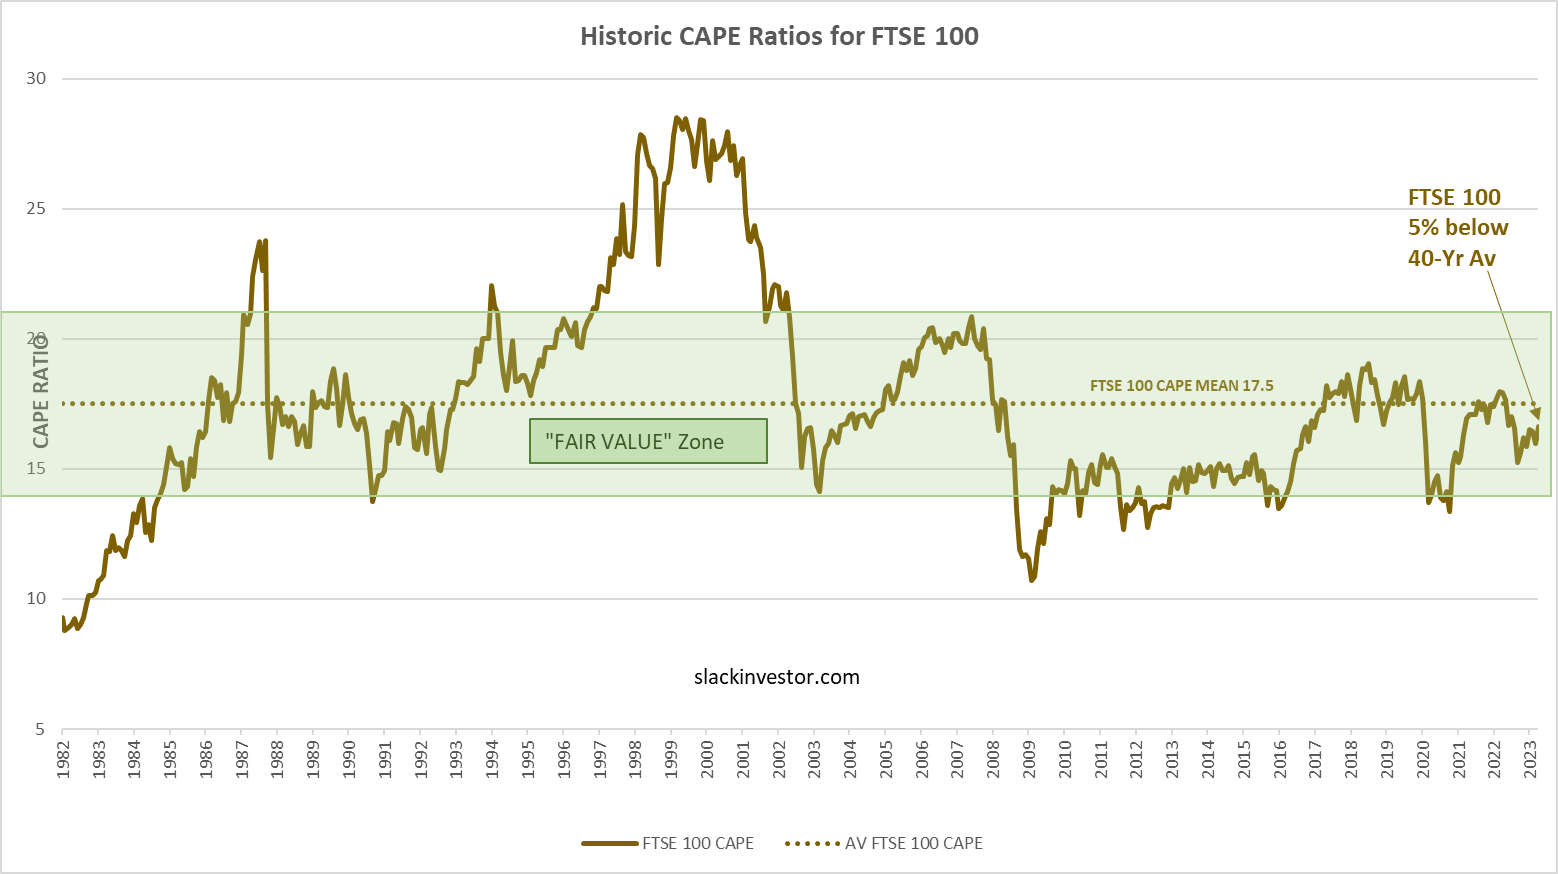
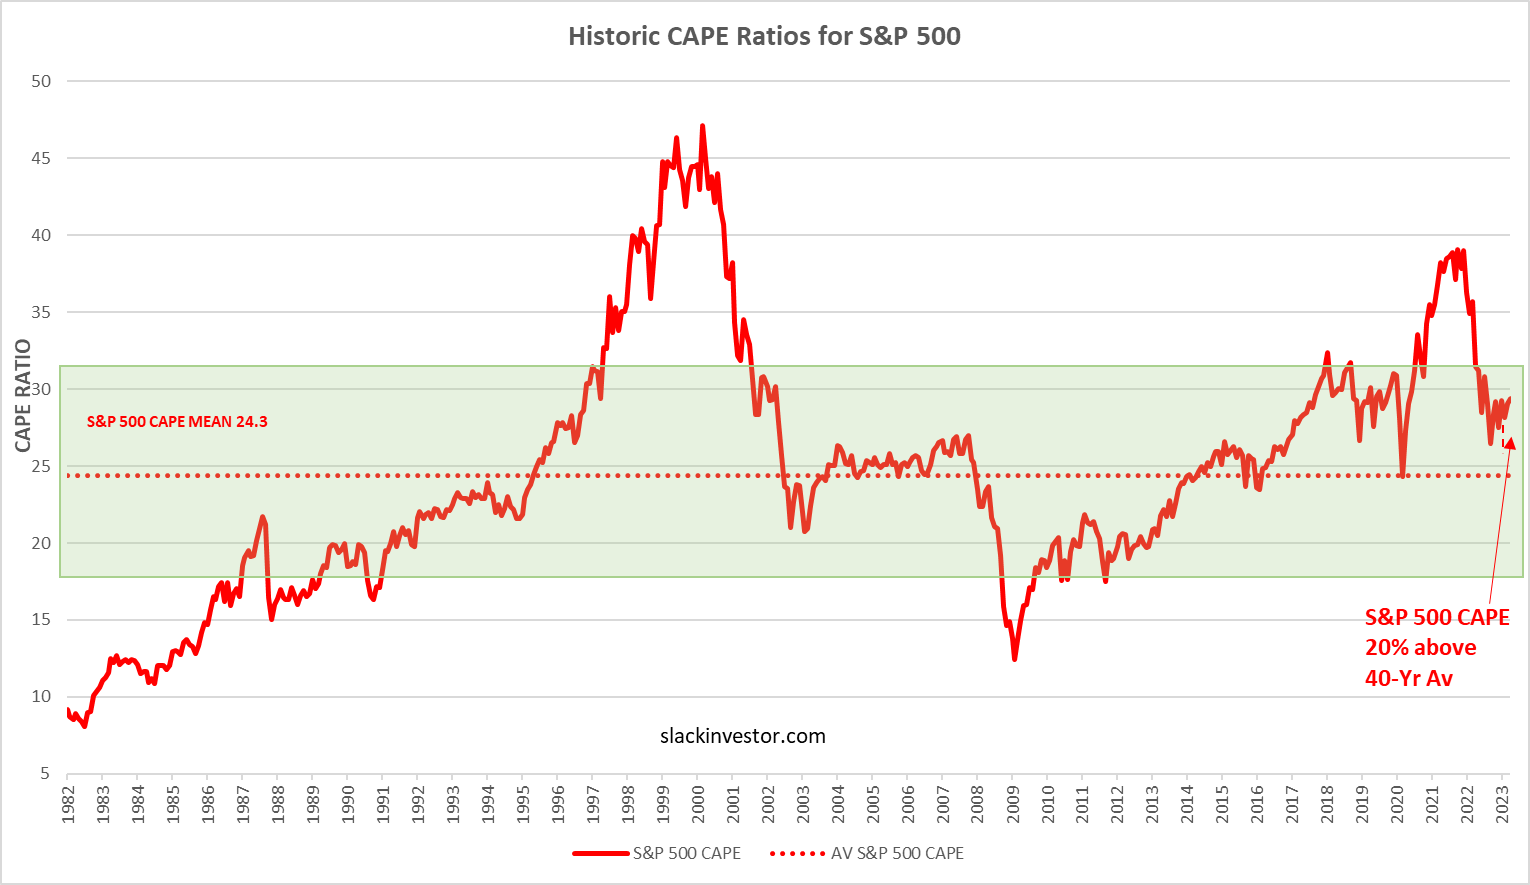
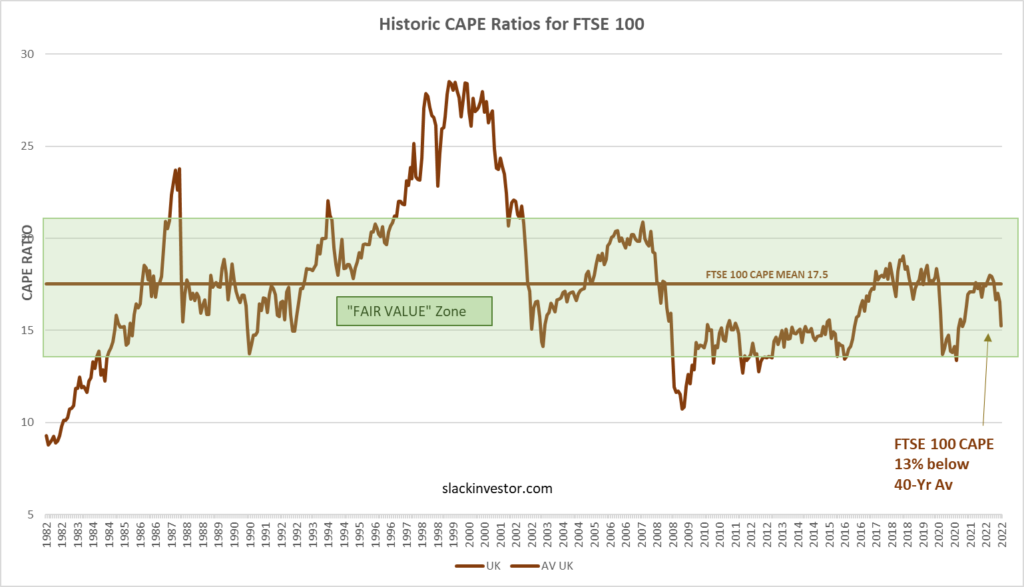
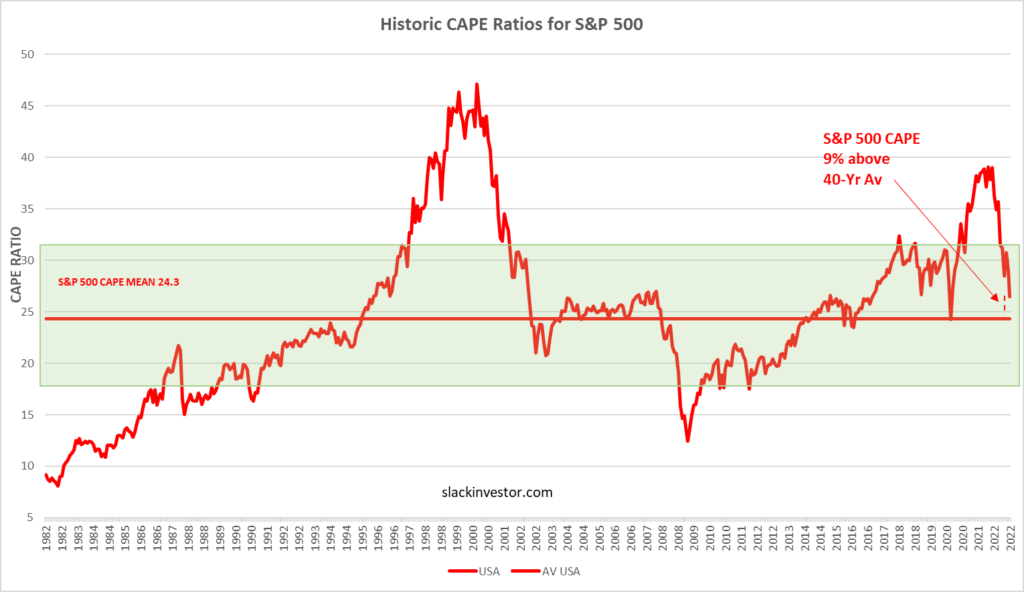
Historic CAPE ratios for the ASX 200 – From 1982 to April 2023– Click the chart for better resolution. Historic CAPE ratios for the FTSE 100 – From 1982 to April 2023– Click the chart for better resolution.Historic CAPE ratios for the S&P 500– From 1982 to April 2023 – Click the chart for better resolution.
From the above, The ASX 200 is right on fair value (1% above av.) and the FTSE 100 is cheap (5% below av.). Both are worth looking at for the moment as their CAPE values are at, or below their long-term averages. The S&P500, is still in the “Fair value” range, but at 20% above the long term average – so, no bargain here.
Momentum
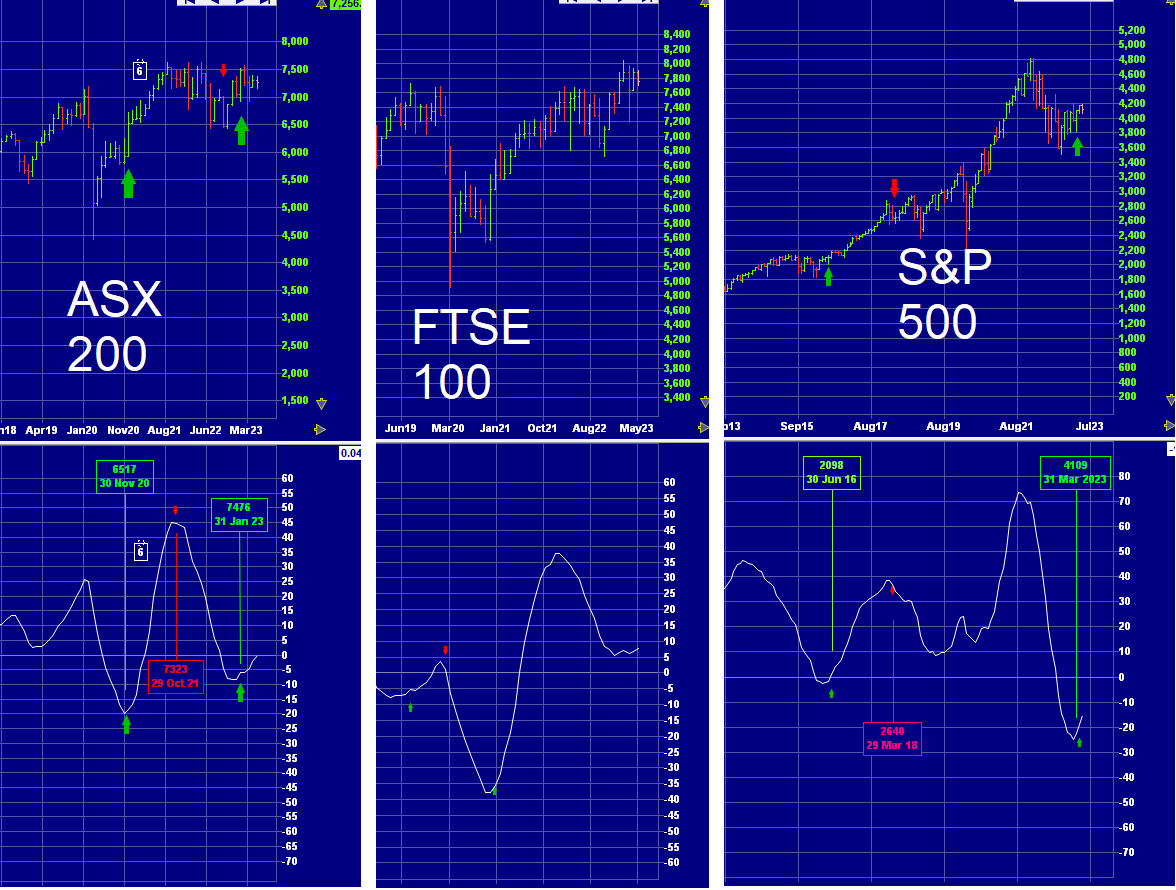
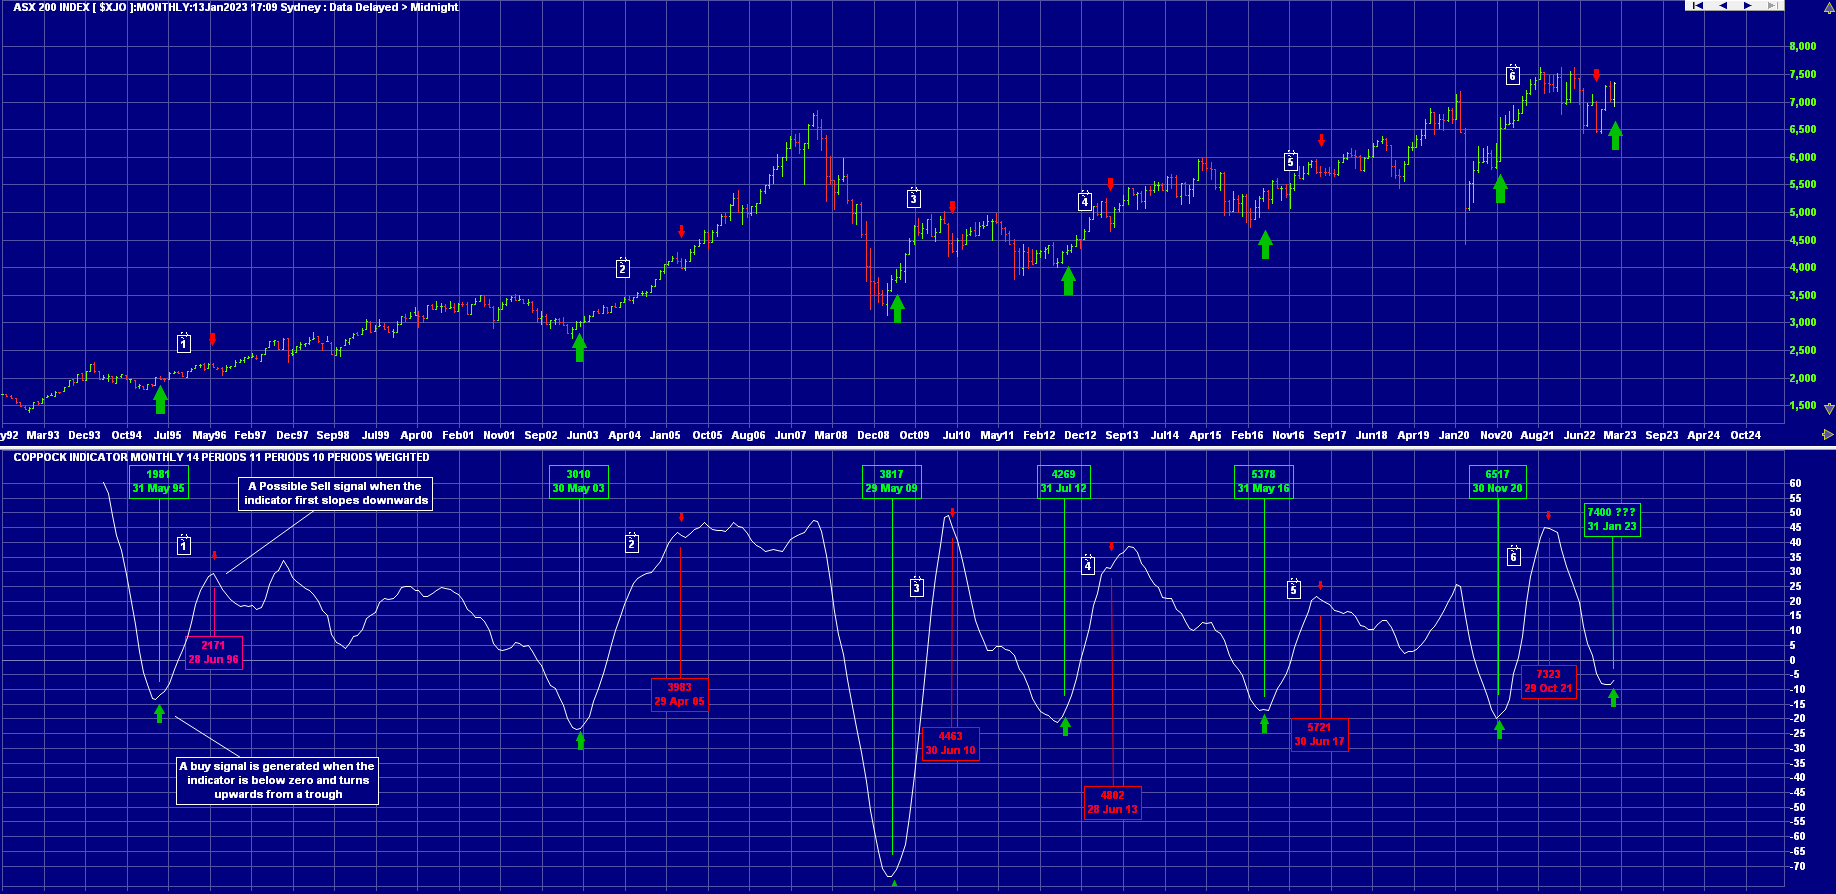
There are lots of stock indicators that track momentum. Slack Investor has blogged about The Coppock Indicator before. It has had an incredible track record in signalling the end of a “bear market”. The signal (Green Arrow) is triggered when the indicator (shown in the lower screens below as a white line) bottoms from under the zero line and then slopes upwards.
Monthly charts of the ASX 200, FTSE100 and S&P500 together with the Coppock Indicator (White Line) in the lower section of each chart. The green arrows show the “bottom of the market” predictions using the Coppock Indicator. The red arrows show a possible time to sell – Click the chart for better resolution – Incrediblecharts.com
The ASX 200 (Since 31 Jan 2023) and the S&P 500 (Since 31 Mar 2023) are showing signs of recovery from the bear market with the is well into the Coppock recovery cycle. The FTSE 100 is also showing signs of recovery, but as the Coppock indicator did not get below the zero line, this is not a proper Coppock reversal.
However, the Coppock Indicator has been reliable so far in predicting stock gains. This is not advice, but the ASX 200 currently has the alignment of both value and momentum indicators. Alignment is good … If I wasn’t already fully invested, I would have a crack!
Slack Investor loves a good story – whether its true or not! I like the owning of stocks and I also admire anyone who can stick to their vows. All of this seems to intersect with the story of the Coppock Curve – a technical indicator that can be mapped on stock price charts that has a great track record for showing when the market has reached the “bottom” of a cycle.
When I first started to think a bit more seriously about financial things, I was going to an evening investment class in Townsville. The class was held by a personal Slack Investor Hero, Robbie Fuller, who put on these classes for no personal gain … he just wanted to educate people about the opportunities that lay waiting in the stock market. Robbie would teach us about fundamental analysis (trying to measure the intrinsic value of a stock) and technical analysis (charts and trends). There was always a particular beauty when fundamental and technical information aligned about a company.
The class was usually a lot of fun, but I remember a time around 2011 when the markets were going through a bit of a lacklustre period and we had all had a few recent losing trades – there was just not much excitement about stocks.
Robbie came bounding in one evening after 31 July 2012 with the news that the Coppock Indicator had just turned … it was a sign that “good things will happen”- He was right – It was the start of a 3-yr period where the Australian market was mostly rising. It is much easier to trade when the “tide is coming in”.
The Coppock Curve is a “smoothed” momentum indicator developed by the economist Edwin “Sedge” Coppock and published in in a 1962 issue of Barron’s. It all started when he was commissioned by the Episcopal Church to find long-term investment opportunities for the Church fund.
According to the legend, he asked a group of nuns (or bishops!) how long it took the bereaved to “recover” from their grief. The answer was 11 to 14 months. He took the radical step of thinking that something similar might happen in stock markets after a market high and subsequent downtrend. He assumed that because markets are motivated by emotion, they might be ready to “move on” after a period of 11-14 months of “grief”.
“Crowds do too much too soon”, he wrote. “They overdo. When they get an urge to speculate, their concerted demand forces prices up at a rate far greater than the growth of the company into which they are buying. Likewise, when they liquidate holdings or make short sales during a panicky decline, they ignore basic economic facts. They overdo because they are motivated by emotion rather than reason.”
The Coppock Indicator has had an incredible track record in signalling the end of a “bear market”. The signal (Green Arrow) is triggered when the indicator (shown in the lower screen below) bottoms from under the zero line and then slopes upwards.
Monthly chart of the ASX 200 together with the Coppock Indicator below. The green arrows show the “bottom of the market” predictions using the Coppock Indicator. The red arrows show a possible time to sell – Click the chart for better resolution – Incrediblecharts.com
The indicator gives buy signals very rarely, only 6 times in the past 30 years for the ASX 200. But it has just given another one, signalling a buy for the ASX 200. The maths of the curve is a little complex, but it looks for the next uptrend after the market establishes a high and then goes through a 11-14-month “greiving” period.
Is Coppock’s Bollocks?
There is no perfect trading indicator. Coppock designed his indicator to try to establish a “bottom of the market” buy signal to identify long term investment opportunities. He didn’t try to use it as a selling tool. However, there is a trading strategy that uses this indicator after a BUY signal.
SELL when the Coppock Curve takes its first downwards trajectory OR,
SELL when the Coppock Curve falls below zero
I have trialled both methods and the strongest gain (p.a) results were with the first method. I have marked these sell signals on the chart above with red arrows and tabulated the gain results below.
COPPOCK CYCLE
BUY DATE
ASX200
SELL DATE
ASX200
GAIN
PERIOD(yr)
GAIN (p.a.)
1
31-May-95
1981
28-Jan-96
2171
10%
0.66
14.5%
2
30-May-03
3010
29-Apr-05
3983
32%
1.91
16.9%
3
29-May-09
3817
30-Jun-10
4493
18%
1.09
16.3%
4
31-Jul-12
4269
28-Jun-13
4802
12%
0.91
13.7%
5
31-May-16
5378
30-Jun-17
5721
6%
1.08
5.9%
6
30-Nov-20
6517
29-Oct-21
7323
12%
0.91
13.5%
31-Jan-23
7400?
?
?
?
?
?
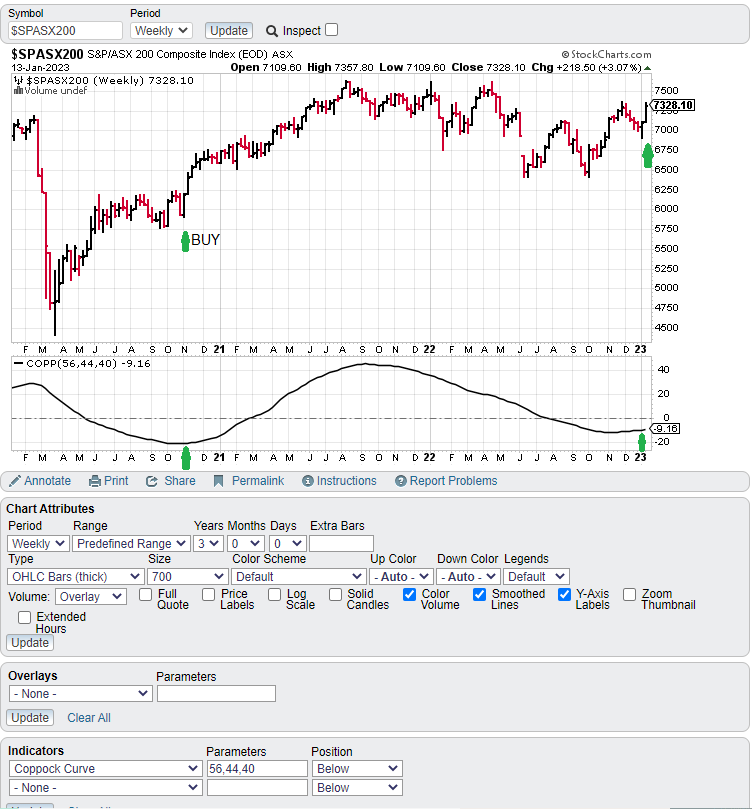
Slack Investor uses Incredible Charts to do all his charting … but their indicator screen can get complicated. To easily follow the Coppock Indicator on any stock, just use the free, but great, StockCharts and put in the same chart attributes below.
ASX 200 Chart from StockCharts – showing stock price on top and the Coppock Curve below.
However, looking at the chart history of this indicator … and the GAIN results in the above table, this is not advice, but now looks like a good time to get into the Australian market. Although, officially, the Coppock results are based on the end of month data. In addition, using Slack Investor’s CAPE valuation method, at the end of December 2022 the ASX 200 was “fairly valued”.
Cathie Wood is the CEO of Ark Innovation and is best known for her NASDAQ based flagship fund ETF (ARKK). She has been concentrating her bets on the “disruptive technologies,” such as artificial intelligence, genomics, blockchain and cryptocurrency, and clean energy. She is a big fan of Tesla and has made the prediction
Slack Investor is no seer … but at the October 14, 2022 price of 16240 USD, Bitcoin has quite a way to go to reach that mark. In the words of the great BBC TV character Sir Humphrey, this looks like a “very courageous” prediction Cathie!
The ARK Innovation ETF (Nasdaq: ARKK)
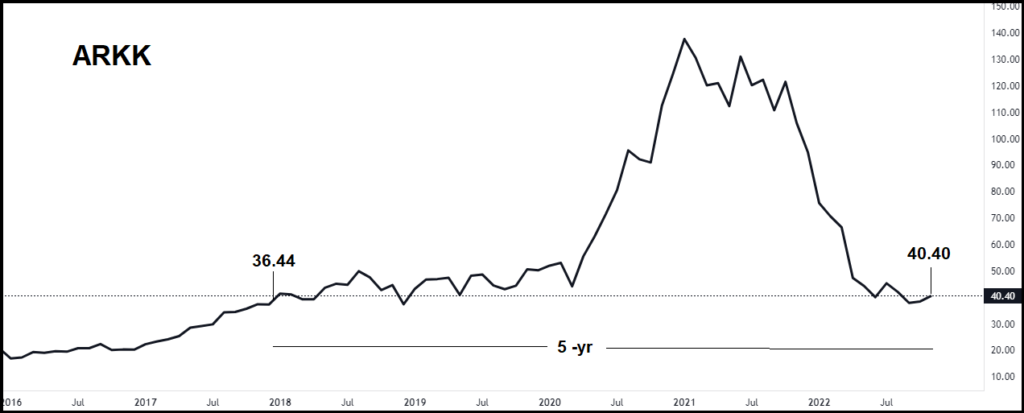
Wood, is a devout Christian, and has named her company after the sacred Ark of the Covenent. Cathie Wood is a household name in the US and has a huge number of loyal fans. Her funds had 60 billion USD under management at their peak. She was named by Bloomberg as Stock Picker of the Year in 2020 . The flagship ARKK fund gained a remarkable 152% in 2020, but since then, the performance has not been so stellar – ARKK is down 65% so far this year. In interviews, she often refers to her past success, and insists, over and over again, her performance should be judged over a five-year time horizon.
The Price chart of the ARKK ETF since 2017 –
Wood is nothing but confident. She hosts a monthly finance video – delightfully called “In the Know” and is a great defender of her fund. She sees “spectacular returns” for Ark Invest over the next five years. According to a recent article by New York magazine, her initial predictions for ARK Invest were annualized returns of 15 percent, “Now we think 50 percent.”
Slack Investor would agree that a 5-yr holding period is a good minimum to judge how a fund is performing – to allow for volatility and to allow growth stocks to grow. She might be right that tech stocks are undervalued at the moment. But let’s have a look at her results as a fund manager over the last 5 years. The total return of ARKK expressed as a compound annual growth rate (CAGR) since November 2017 was a not so impressive 3.5% when compared with other “no stock picking” index funds.
Instrument
Value Nov 2017
Value Nov 2022
5-yrCAGR
ARKK
36.44
43.31
3.5%
NASDAQ 100 TR
7159
13881
14.2%
S&P 500 TR
5212
8407
10.0%
FTSE 100 TR
6510
7564
3.1%
ASX 200 TR
56486
81102
7.5%
Based upon the 5 years preceding November 2022, the compound annual growth rate (CAGR) of various Total Return (TR) index values compared with the ARKK ETF (including dividends since Nov 2017 of $2.91 USD). These TR calculations include dividends. Data from Yahoo Finance and CAGR calculations from CAGRCalulator
Cathie Wood conducted a recent session at a Morgan Stanley event in Sydney. where she maintained her bullish outlook. According to the Financial Review, the fund manager essentially argued it’s the market that’s got it wrong, not her!
Slack Investor is far more humble … he “takes his licks” when times are bad – doesn’t “crow” when times are good – and is mostly wary when a new “stock guru” emerges.
In the stock market, volatility is the price he has to pay for being involved with long-term asset growth.
November 2022 – Mid-Month Update
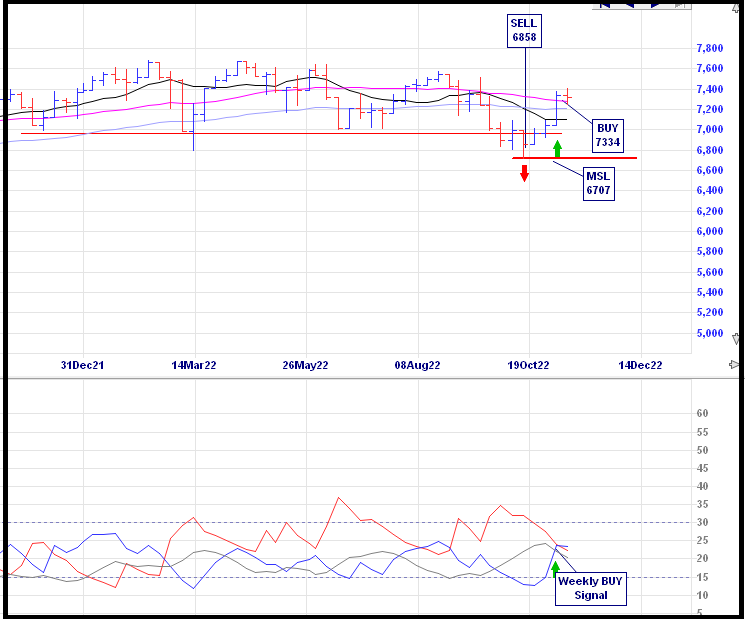
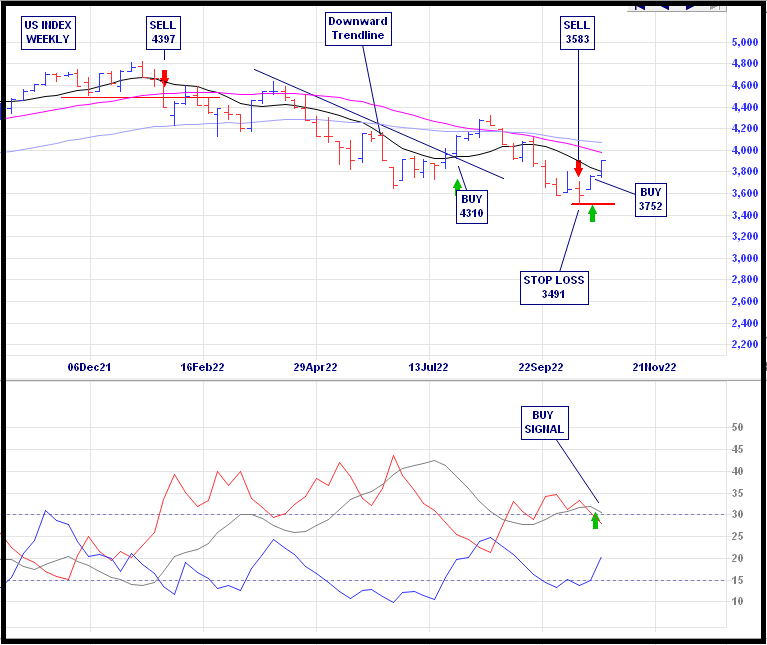
My small-scale, and often very frustrating, market timing experiment continues until its projected end in 2024. On a weekly signal for the FTSE 100 from the momentum following Directional Movement system. I have bought back into the UK index. I am back now to fully invested in the ASX Index, UK Index, US Index.
The buy signal can show itself as a downward dip in the trend strength indicator ADX (grey line) of the lower panel below. There are many ways of setting up this Directional Movement system. Slack Investor likes the “smoothing” that is enabled by a system that looks back over the previous 11 periods – but the complexities are best left for the Resources page.
In amongst the general carnage of the market, Slack Investor has been doing a little buying. An opportunity came up with an existing holding. Dicker Data (DDR). DDR is an Australian-based technology hardware, software and cloud distributor.
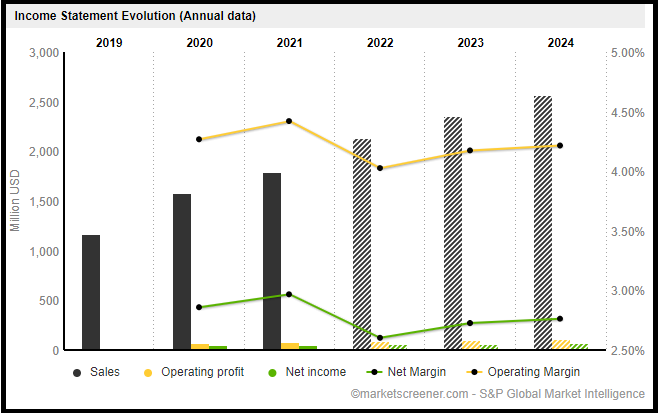
From time to time, a company will go to institutions and shareholders to raise a bit of working capital using a Share Purchase Plan (SPP). Dicker Data (DDR) needed to expand its warehouse facilities. Fair enough – but does Slack Investor want to part with more cash to invest in this company? Lets take a fresh look using the excellent Market Screener Financials Page. The Slack “basics” of a high return on equity (38.7% in 2022) and projected growth – on top of an established period of growth – are still intact – Tick
DDR – Historical (Black)and analyst projected income growth (grey) till 2024 – Market Screener
The price of DDR has been generally “beaten up” in the last 6 months as interest rates have risen and growth stocks have suffered. There are probably some more tough times ahead … but Slack Investor likes to take the “long view”. This business has a long term growth strategy and will probably persevere despite current headwinds – Tick.
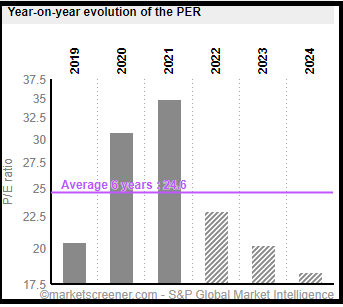
DDR – Analyst projected PE ratio till 2024 – Market Screener
The current DDR Price/Earnings ratio is 22.9 – below recent values and projected to reduce further as income increases. – Tick.
Although analyst predictions can be wrong, on balance, the miserly Slack Investor was happy to part with a few dollars in this Share Purchase Plan as he could find some value in this business. There is every prospect that the DDR share price will increase in the next few years.
Finding Index value using CAPE
As with individual companies, the whole share market will oscillate betwee overvalued and undervalued. Slack Investor has written about the Cyclically Adjusted Price to Earnings ratios (CAPE) which use ten-year average inflation-adjusted earnings to take out some of some of the volatility of annual earnings. By plotting this CAPE over a period of time, we can look at how the whole sharemarket is currently valued in terms of historical data.
Using monthly CAPE data from Barclays, the 40-yr mean is calculated and plotted together with the CAPE values. A “fair value” zone is created in green where the CAPE is within one standard deviation of the mean.
Historic CAPE ratios for ASX 200 – From 1982 to September 2022Historic CAPE ratios for FTSE 100 – From 1982 to September 2022Historic CAPE ratios for S&P 500 – From 1982 to September 2022
From the above, The ASX 200 (7% below av.) and the FTSE 100 (13% below av.) are “On Special” at the moment as their CAPE values are below their long-term averages. Even the S&P500, after a long 2-yr period of being “Over valued”, is now getting close to being “Fair valued”.
October 2022 – End of Month Update
Slack Investor remains IN for Australian index shares though it is still on watch after breaching its stop loss at the end of September 2022.
My last post described how I had left the UK and US Index in the middle of October 2022. I am now back IN to the US Index – and, for the moment, OUT of the UK Index. Although, I am keeping a weekly watch on the FTSE 100 in case there is a signal to return to the market.
This month illustrates why I feel glad that my 20-yr index timing experiment is coming to an end in 2024. After exiting the US and UK markets only 2 weeks ago, there has been a rally in both the US Index S&P 500 and (to a lesser extent) the FTSE 100. The momentum has been sufficient for Slack Investor to be “whip-sawed” back into the US Index on a weekly buy signal – I am starting to get “really over” this timing the market experiment.
For the experiment, Slack Investor uses a trend following (or momentum) system called the Directional Movement Index. The buy signal shows itself as a downward dip in the ADX (grey line) of the lower panel below. There are many ways of setting up this system. Slack Investor likes the “smoothing” that is enabled by a system that looks back over the previous 11 periods – but the complexities are best left for the Resources page.
“So the last shall be first, and the first last: for many be called, but few chosen“
Matthew 20:16 – King James Version of the Christian Bible
Slack Investor is not a very religious person – but he is a numbers man and 84% of the global population identifies with a religious group – so I have to go with the flow here. This sort of majority demands respect. The Christian disciple Matthew was reporting on one of Jesus’s teachings. Biblical scholars think that Jesus was trying to point out that Heaven’s value system is far different from earth’s value system.
The “Last first and First last” might also be applied to how some of the Slack Portfolio stocks have been going over consecutive years. There seems to by a cycle of last years Nuggets … might end on the Stinker pile the year after – and vice-versa. Growth stocks have many virtues … but they are not immune to the cycles of price – bouts of overvaluation followed by a period of undervaluation.
The percentage yearly returns quoted in this post include costs (brokerage) but, the returns are before tax. This raw figure can then be compared with other investment returns. I use Market Screener to analyze the financial data from each company and extract the predicted 2024/2o25 Return on Equity (ROE), Dividend Yield and Price/Earnings (PE) Ratio on the companies below. This excellent site allows free access (up to a daily limit) to their analysts data once you register with an email address.
Slack Investor Stinkers – FY 2022
Financial year 2022 was the Pepé Le Pew of all of Stinktown for Slack Investor.I hold mostly growth shares in the technology and healthcare sectors. These sectors have been heavily punished across the world so far in 2022.
This is the first time I have had a negative result for my investments over a financial year since 2009. Slack Investor is a great believer in long term investing returns – usually evaluated over a 5-year period – so this year’s result, while painful, does not change my overall strategy.
Three of my “stinkers” this year were actually “nuggets” from last year. For FY 2020, Codan +161%, REA +59% and IDX +37%. Such is the cyclic nature of some growth stocks.
Codan (CDA) -58% (Still held)
(CDA – 2025: PE 14, Yield 3.8%, ROE 25%) Codan is a technology company that specializes in communications and metal detecting. This company was one of my big nuggets last year (+161%) – so I should not have been really surprised that there could have a bit of a pullback. The decline hurt, but the fundamentals of the company remain sound. Holding on.
Xero (XRO) -41% (Sold)
(XRO– 2025: PE 81, Yield 0.3%, ROE 15%) Xero is an innovative cloud -based accounting provider for small business. Every business owner that Slack Investor talks to say that Xero is a boon to their business. This sort of “word of mouth” got me over-excited this year and I just held my nose and jumped in – against all my rules of avoiding the excessively high forward PE ratios of over 50! It is these high PE companies that are usually punished first in a downturn – and that’s exactly what happened. I still look at it and think its a decent growing business – but I can feel the recent bite!
Integral Diagnostics (IDX) – 39% (Still held)
(IDX – 2024: PE 16, Yield 4.5%, ROE 12%) This medical image company provides diagnostic image services to GP’s and specialists. IDX was another of my nuggets from last year (+37%) that has just shed all of last years gains. The Return on Equity of this company is starting to get a bit low (<15%) – But the PE and yield seem OK. Will keep this company on watch for the moment.
BetaShares Asia Technology Tigers ETF -33% (Still held)
(ASIA – 2022: PE 14, Yield 0.7%,) Growth in Asia … What could go wrong! Plenty it seems.
These “technology tigers” that make up this ETF have been part of a global selloff of tech-related shares this year.
A lot of the Chinese companies (such as Alibaba) have been marked down because the Chinese government imposed its will on a few industries. Also the US government has hinted at action on Chinese companies that have listed on American market. However, the ASIA ETF has large holdings in such monsters as Taiwan Semiconductors, Samsung and Tencent Holdings – so I will accept the current pain and stick with this as a long-term holding
REA Group (REA) -33% (Still held)
(REA – 2024: PE 29, Yield 1.8%, ROE 32%) The owners of RealEstate.com.au. which is the go to portal for house selling and buying. 65% of Australia’s adult population are checking the site every month looking at property listings and home prices. Another long-term holding.
I have only listed the stinkers that lost over 30% this year … sadly, there were many more rogues that lost over 15% for the Slack Fund. They include PPK Group (PPK) -28%; Altium (ALU) -25%; Nick Scali (NCK)-20%; Pushpay Holdings (PPH)-16%; and A2 Milk (A2M)-15%.
Slack Investor Nuggets – FY 2021
Nuggets were few and far between this year. A great benefit of investing in companies that have a high Return on Equity (ROE), and with a track record of increasing earnings, is that they sometimes behave as “golden nuggets”.
Technology One(TNE) +17%
(TNE – 2025: PE 34, Yield 1.7%, ROE 36%) This Software as a Service (SaaS) and consulting company continues to be profitable. This year is the 13th year in a row of record half-yearly profits. A high 2025 PE of 34 (Expensive) is a little scary but, if the high Returns on Equity (36%) remain, on balance, this is OK.
Macquarie Group (MQG) +10%
(MQG – 2025: PE 25, Yield 4.0%, ROE 13%) Macquarie is a complex business with a range of banking and financial services, and plays in global markets and asset management. Once again, the management seem to know what they are doing – Slack Investor remains a fan.
Honourable mention to the only other company that ended in the black – Coles (COL) a decent +8% in these troubled times.
Slack Investor Total SMSF performance – FY 2022 and July 2022 end of Month Update
In a year that Chant West describes as “a rough year for markets”. Following FY2021, which was one of the strongest years for Super funds (+18% for FY21), things have now lurched south with the median growth fund (61 to 80% in growth assets) returning -3.3% for FY22.
The FY 2022 Slack Investor preliminary total SMSF performance looks like coming in at around -14%. However, the 5-yr performance is a more useful benchmark to me – as it takes out the bouncing around of yearly returns. At the end of FY 2022, the Slack Portfolio has a compounding 5-yr annual return of over 13%.
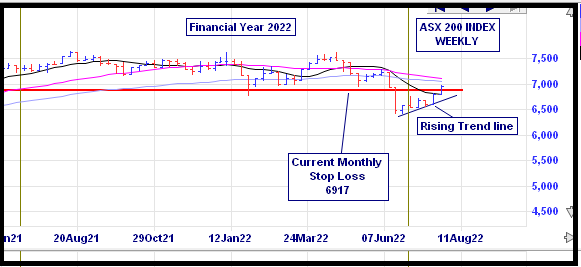
Despite a breach of the stop loss for the ASX 200 last month, Slack Investor remains tentatively IN for Australian index shares on a dramatic rise of 5.7% this month. The FTSE 100 also had a good month (+3.5%)and I remain IN. The US Index S&P 500 eclipsed them all with a remarkable 9.1% gain – and I am now a BUY back IN.
Last month the ASX 200 price went below its stop loss. Slack Investor tries not to exit a stock against the momentum of the market, so I have been off the couch and closely watching the ASX 200. It has remained above the rising trend line and emerged above the monthly stop loss. I am tentatively still IN.
After a sell, it is important to have a notion when to get back IN to an Index or a stock. When trend trading, my main tool for finding a buy signal is a trend following (or momentum) system called the Directional Movement Index. There are many ways of setting up this system. Slack Investor likes the “smoothing” that is enabled by a system that looks back over the previous 11 periods – but the complexities are best left for the Resources page.
In addition to the BUY signal from the Directional Movement Index for the S&P 500, the charts show a triggering of the “Wedgie” pattern where the stock price breaks through a long term down-trend. This reinforces the BUY.
All Index pages and charts have been updated to reflect the monthly changes – (ASX Index, UK Index, US Index).
In addition to the trading … and mostly holding onto individual companies, Slack Investor has been running an experiment on market timing for Index funds in the Australian, UK and US markets. The Index funds have been doing OK .. but Slack Investor is generally just finding that timing markets is just too hard and is hinting at an end to the timing experiment in 2024.
As a recap on the experiment so far, I am still outperforming the “Buy and Hold” investor in all followed markets – but the advantage is slim. Per annum outperformance is 1.4%, 1.9% and 0.6% for the ASX, UK and US markets respectively. Not really fantastic results when you consider that I am missing out on the dividends that “buy and holder’s” receive when I am “timed” out of the markets.
The Slack Index “timing the market” method was devised with a lot of back-testing on 30-years of market performances and does really well when sustained bear markets occur as it gets out of the market at a hopefully early stage in the price downturn. Ideally, the Slack method should stay in the market for the smaller fluctuations (corrections <~10%) and get out of stocks before it becomes a full bear market. The problem with my current strategy is that I am getting “whipsawed” out of the market in these smaller downturns – and the big swings seem to happen so quickly that the damage is done before I can get off the couch.
Things were much easier in the accumulation stage – I had set amounts of money coming out of my pay each month that would be automatically invested into my trading account. With dollar cost averaging, if the market went down, it would just mean that I would be able to buy a greater number of shares – all good.
It is different in retirement mode … as, I am not a net buyer of shares now and, as I am usually am fully invested, it is difficult to take advantage of a lower-priced market. These days, the stock market downturns are just something to be endured.
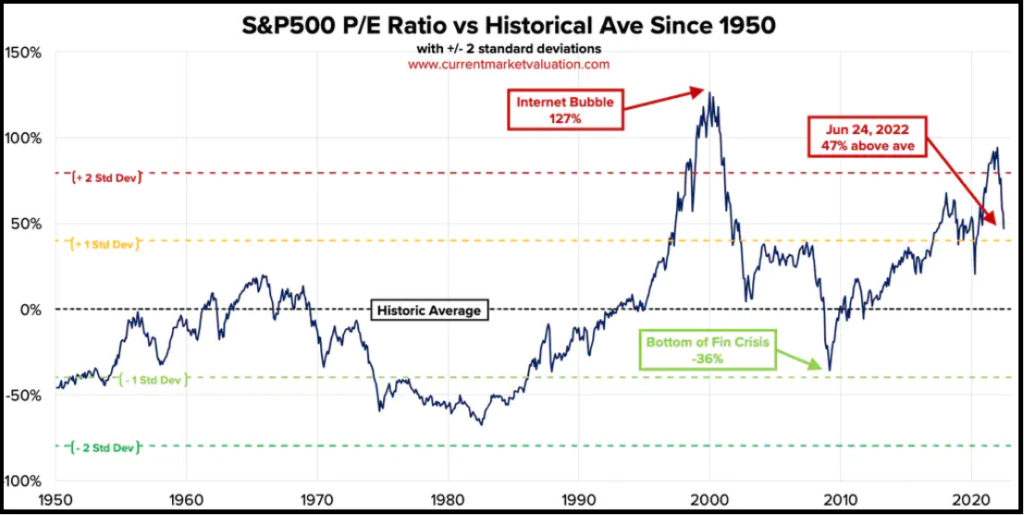
S&P CAPE data showing the 1950-2022 average (mean) P/E value of 19.8 (baselined as 0%), as well as horizontal bands showing standard deviation bands. As of June 24, 2022, the S&P500 P/E ratio is 47% higher than the 1950-2022 average – From Current Market Evaluation.
Current Market Valuation define the market as “Fairly Valued” if the CAPE Ratio is between between -1 and 1 standard deviation from the “average”. If the CAPE distribution is “Normal”, then the CAPE should be ranked as “Fairly Valued” about 70% of the time.
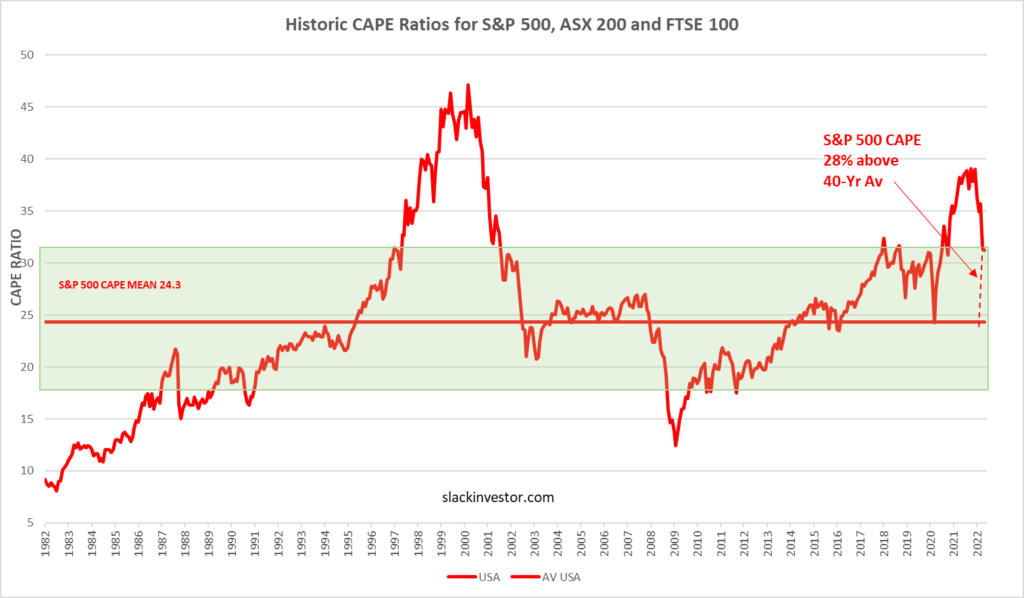
Slack Investor has developed similar charts – but only since 1982. I have used only a short time frame for this analysis as there are good arguments as to why the CAPE should actually rise over time – and a small time range will tend to stop this distortion. The Green shaded areas correspond to the limits of one standard deviation of the CAPE from the 40-yr average values.
Slack Investor S&P 500 CAPE data showing the 1982-2022 average (arithmetic mean) P/E value of 24.3 at the end of May 2022 -“Fair Value” is represented by the green shaded area. Despite recent price drops, the S&P 500 CAPE is still well above average (28%) but at least in the broad “Fairly Valued” range now- Data from Barclays Slack Investor FTSE 100 CAPE data showing the 1982-2022 average (arithmetic mean) P/E value of 17.5 at the end of May 2022 -“Fair Value” is represented by the green shaded area. The FTSE 100 CAPE is close to its 40-yr mean and well into the “Fairly Valued “range – Data from Barclays Slack Investor ASX 200 CAPE data showing the 1982-2022 average (arithmetic mean) P/E value of 20.4 at the end of May 2022 -“Fair Value “is represented by the green shaded area – Data from Barclays
Slack Investor gets very nervous when the CAPE charts are well above the green “Fair Value” range. and would love to be a buyer when any of these markets show CAPE values below their 40-year averages.
However, as my “time the market” skills are limited, and my Stable Income pile is still producing, I am prepared to strap in and “enjoy”(not really!) the ride.
June 2022 – End of Month Update
The financial year closes and looking at the 12-month charts for FY 2022 – An official “Bear Market” for the US (>20% fall from a recent high) and big drops in the UK and Australian markets. The “blood in the streets” trend in world index prices have moved the ASX 200 below my stop loss of 6917 – This triggers a sell response.
However, I will not sell against the overall trend. Given that the ASX 200 is bouncing up a little today (01 Jul 2022), this means that I will go to a weekly watch on the ASX 200 – I will now wait till the end of next week to see if the ASX 200 continues to drop – or recovers. I have developed this “soft sell” approach when I gauge that the market is not too overvalued (see above ASX 200 CAPE chart).
Slack Investor remains IN the FTSE 100, TENTATIVELY OUT for the ASX 200, but OUT for the US Index S&P 500 due to a sell in January 2022.
All markets down for the month. The FTSE 100 (-5.8%), the S&P 500 (-8.4%) and the ASX 200 (-8.9%).
All Index pages and charts have been updated to reflect the monthly changes – (ASX Index, UK Index, US Index). The quarterly updates to the Slack Portfolio have also been completed.
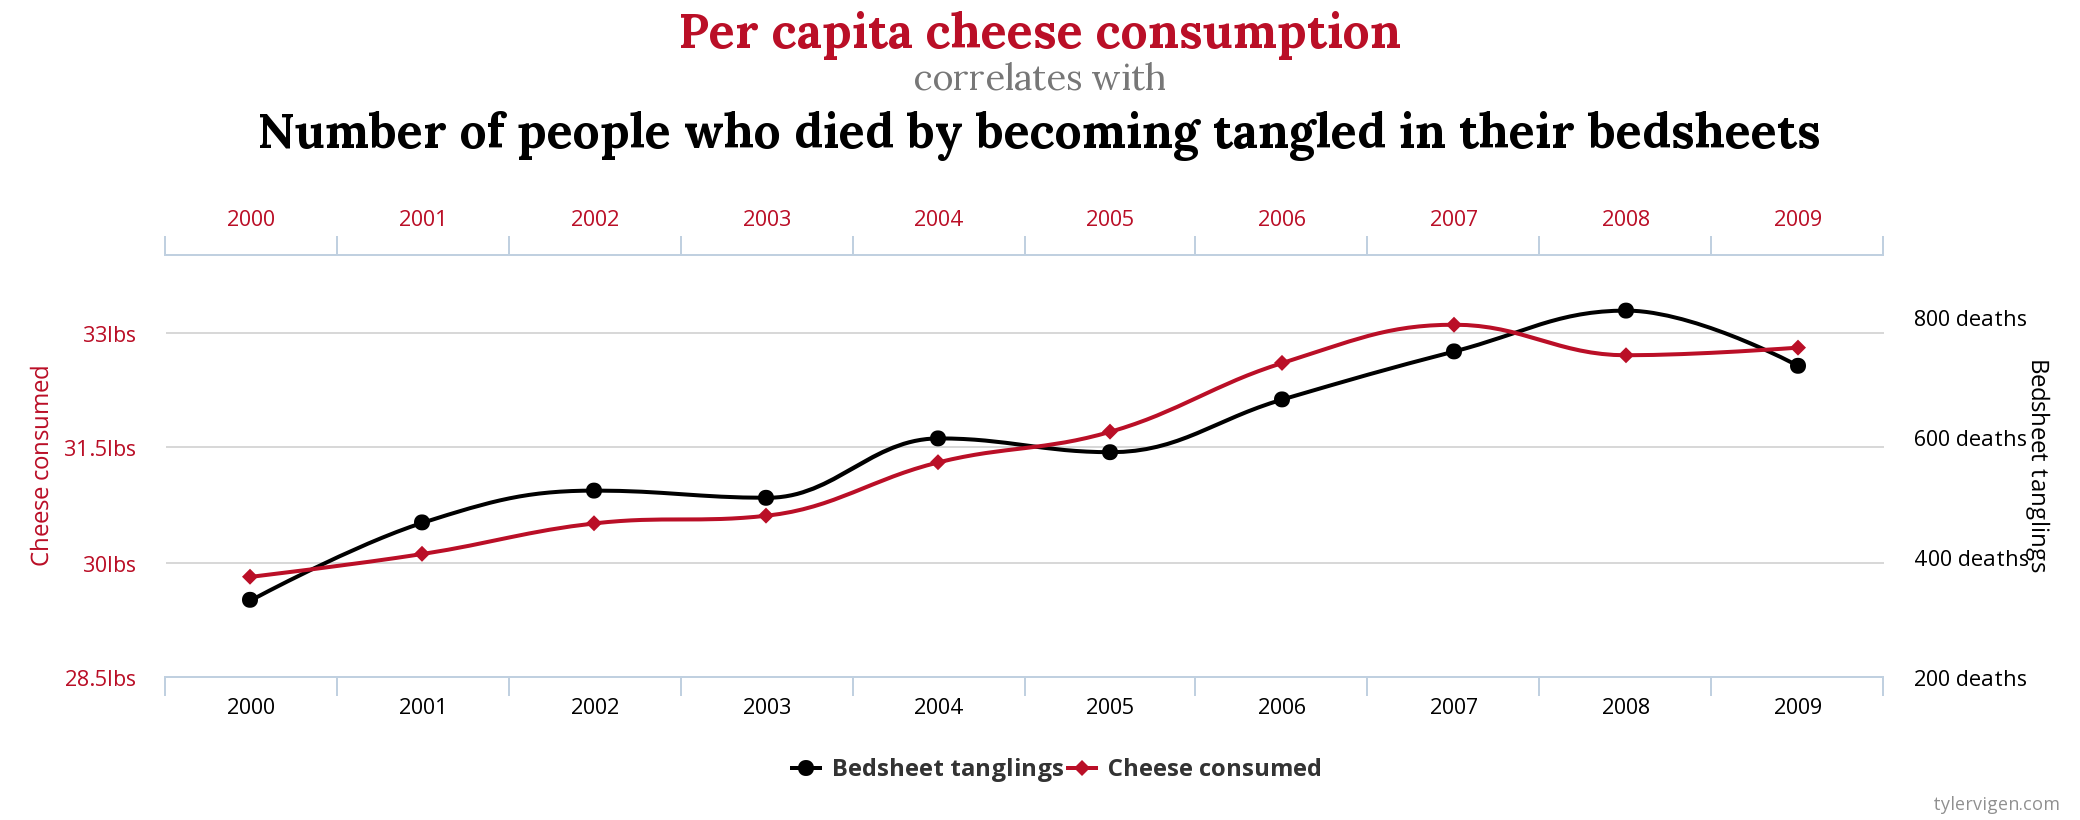
Slack Investor is a lover … of cheese. He follows all cheese related literature and was shocked by the revelation that “Death by Bedsheet Entanglement” is highly correlated (0.95 Pearson R correlation) with cheese consumption. The thought that over 800 people died in the US in 2008 at the hand of their sleeping equipment is terrifying.
A quick explainer on the correlation coefficient, it is just a way to measure how strong the relationship is between two variables. The correlation coefficient ranges between +1.00 (perfect positive correlation) through zero (no correlation) to -1.00 (negative corrrelation)
Slack Investor salutes Tyler Vigen here – a bloke who wrote a program that crawls through unrelated government data sets to find spurious correlations. The above chart is one of these random pairs of data that were thrown together by his program. Almost 50 000 of these graphs that show unlikely correlations have been found so far – and one more is produce every minute! Hats Off Tyler.
Correlation does not mean causation
First lecture in Statistics 101
In the cheese consumption case, it is hard to think that eating cheese actually causes bedsheet entanglement. The first step when trying to establish a link between two variables is correlation. Then, most importantly, experiments must be done to show that A actually causes B – Is there a reason that makes sense? Some people link cheese to nightmares, but there is no scientific evidence linking cheese to death by bedsheet … so, this high correlation is probably just due to chance and a limited data set (10-yr). There is likely to be a missing other variable that’s the true driver that causes the correlation. I would speculate that both variables might be linked to general population trends – but this would have to be tested.
Using Sector Correlations in Investing
Slack Investor has been banging on a bit about “Sectors” lately. and despite not feeling the need to match his portfolio with the sectors of the S&P 500 (Or ASX 200), sector analysis can be useful.
My Investments portfolio consists mostly of “growth stocks” in the Technology and Healthcare sectors. The table below shows a high correlation of these sectors with the total market – they will tend to move with the general market during an occasional downturn. The Nasdaq Composite is down about 23% from its November 2021 high – the Slack growth portfolio is down about 7 % so far this financial year – Not fun, but I do expect the occasional down year.
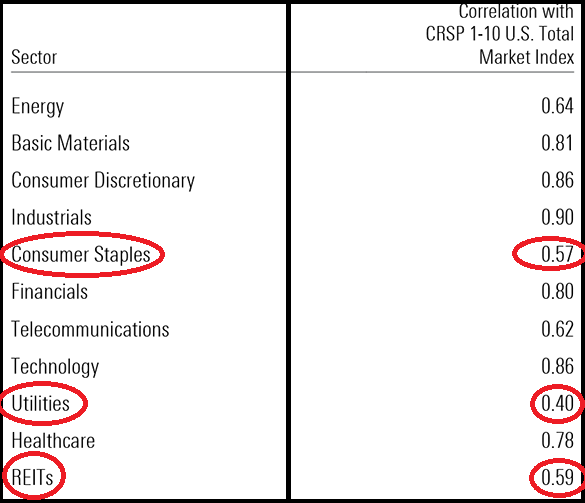
Sector correlations with the US stock Market – A Sector that would exactly move up and down with the US stocks would have a correlation of 1.00. Low scores ie Utilities do not move up and down the same way as stocks. – From Morningstar 2000-2018 data
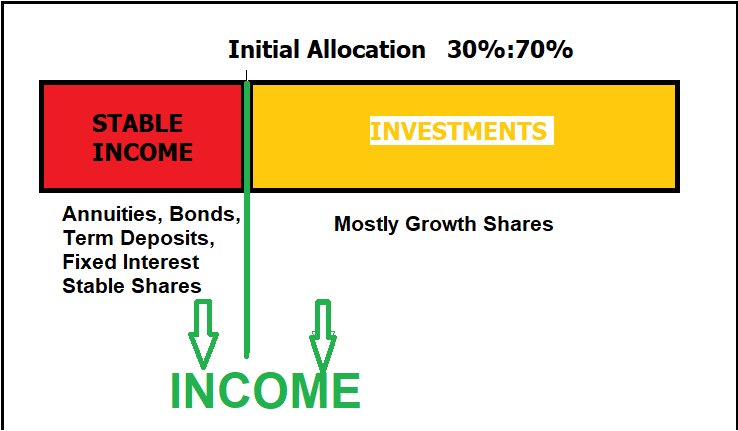
However, I want my Stable Income pile, 30% of non-house wealth, to be much more conservative. It holds annuities, fixed interest products and some shares. The shares in the Stable pile need to have a low correlation with the general stock market – as, when the stock market does poorly, I want this pile to be OK.
For my Stable pile, I choose stock sectors that are not highly correlated with stock market fluctuations (circled in red below). I already have some REITS (Listed Real Estate – Correlation 0.59), and some Consumer Staples (Correlation 0.57) which Perhaps I should buy some more Utilities and REITS (real estate). When I get an opportunity, I would like to buy some Utilities (Correlation 0.40) for the Stable pile.
I am always on the lookout for spurious correlations and the 19-year data set, in the above table seems sufficient (would like longer!). Do the correlations make sense? For example, it seems reasonable that Utilities would have a low correlation with the general market. It is a sector that would be able to keep its earnings and maintain its stock price – even during a market downturn.
An asset that has an even lower correlation to the S&P 500 is Gold – and is often seen as a “hedge” to to the stock market. Over a 20-yr period (2000-2020), Gold has a correlation of -0.28 with Australian Equities and -0.12 with Global Equities
Gold has a low (and at times, negative) correlation to other assets
Smarter people than Slack Investor provide compelling reasons for including Gold in your portfolio – to improve long term returns. But the pig-headed Slack Investor has not yet overcome his old fashioned view that Gold is a speculative investment that does not earn a dividend or interest.
April 2022 – End of Month Update
Slack Investor remains IN for Australian index shares and the FTSE 100 but OUT for the US Index S&P 500 due to a sell – back in January 2022.
Despite some big daily fluctuations, the FTSE 100 (+0.4%) and The ASX 200 (-0.9%) ended relatively flat this month. All is not well in the USA where inflation fears and some mixed results from the Tech sector allowed the S&P 500 to fall -8.8%.
All Index pages and charts have been updated to reflect the monthly changes – (ASX Index, UK Index, US Index).
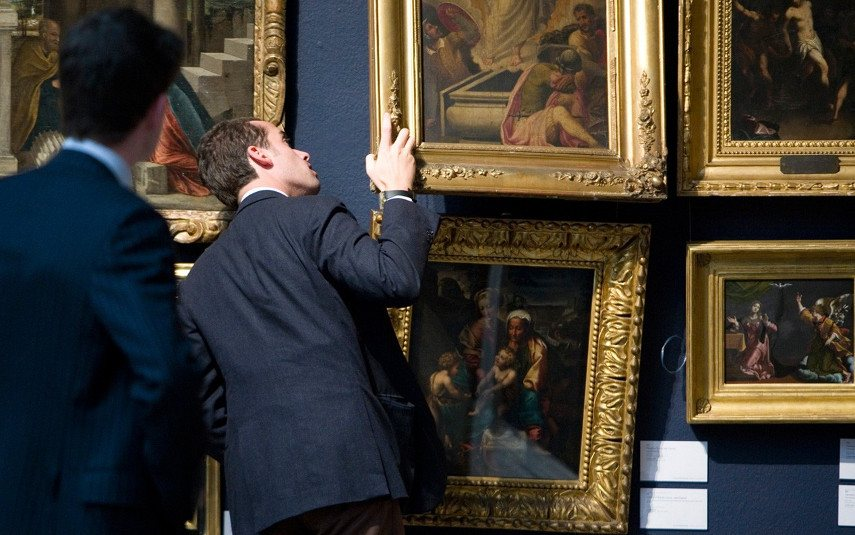
Slack Investor doesn’t face such vexed issues as this poor young woman. In this sad, but beautifully painted, scene from the 16th Century there are two suitors – the old bearded one offering wealth in a jewellery box, while the young musician offers only love. Her gaze is turned away from both men and she has a despondent expression that suggests that the decision may not be hers alone.
My decisions seem feeble in comparison to the young girl depicted by Bouguereau. Looking at this painting just reinforces to me that men must do a better job of recognizing some of the often horrible decisions that women have to make. Sure, things have improved for women since the 16th Century – but there is still plenty of inequalities. It is the duty of all men to “lean in” and try to make things better.
Asset Allocation Decisions before the end of the financial year
Slack Investor likes to have a look at my income producing piles at this time of year – The Stable Income pile and the Investments pile. I have to decide how to allocate money for living expenses and how to allocate the amounts in my investment asset mix before financial year end to get it ready for next year.
Lets just back track a bit here and remember that Slack Investor finances were thrown into three piles before retirement– a House, Stable Income, and Investments. Now that I am retired and fortunately have my house paid off, there are only two piles that really concern me – The Stable Income pile (30 %) consists of Annuities, Bonds, Term Deposits and Fixed Interest. I have recently added some shares to this pile that I think won’t be too affected by a share market downturn. This share tranche consisting of a small amount of property trusts, consumer staples and infrastructure shares.
The other pile is Investments (70%)- consists of mostly growth shares (high Return on Equity, historical and forward earnings growth).
Despite the tough recent times for growth shares, after extracting living expenses, the total of the piles has grown slightly so far this financial year (0.2%). With 70% growth shares, positive pile growth will not always be the case. But my asset allocation strategy should help be ride out the bad times.
Dividend season is almost over and throughout the financial year I have taken out most of my living expenses from both piles using income from annuities, interest payments, distributions and dividends. At this stage, my current allocation is 29% Stable Income and 71% Investments. In order to maintain my 30%:70% asset allocation, if I need anymore living expenses I will take it out of my over-allocated Investments pile. I will make final adjustments at the end of the financial year – so that the initial allocations are roughly intact (30%:70%) – ready for the next year.
The decisions I make on asset allocation are to keep my nest egg in good shape – so that it continues to provide income. In a good year for investments most of my living expenses can be withdrawn from the Investments pile. In a bad year for investments, then I dip more into the Stable Income pile. Also, in a bad investments year, I might cut back on my discretionary expenses eg. Travel.
March 2022 – End of Month Update
Slack Investor remains IN for Australian index shares and the FTSE 100 but OUT for the US Index S&P 500 due to a sell in January 2022.
The FTSE 100 was flat this month (+0.4%). There were substantial rises for the ASX 200 (+6.4%) and the S&P 500 (+3.6%).
All Index pages and charts have been updated to reflect the monthly changes – (ASX Index, UK Index, US Index). The quarterly updates to the Slack Portfolio have also been completed.
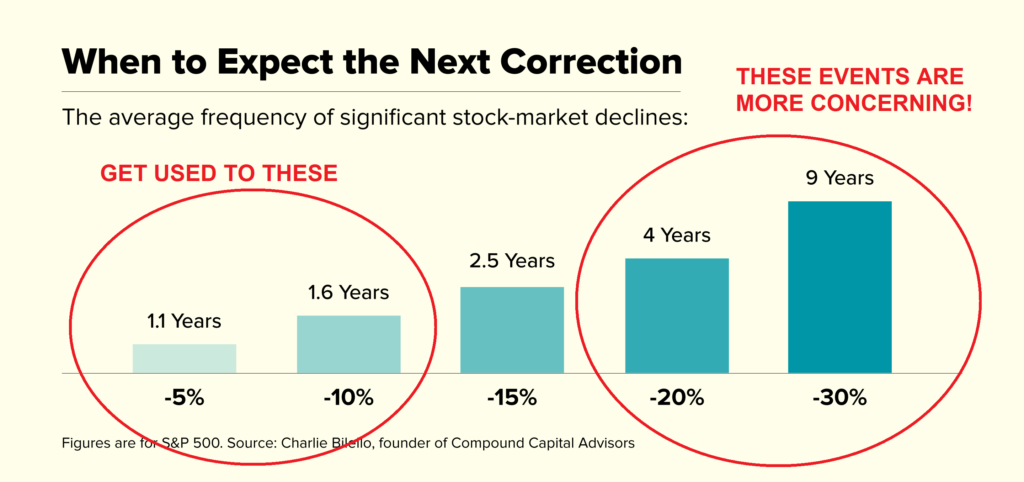
It is worth revisiting corrections, these annoying dips in the market are testing – even for experienced investors.
A correction is a 10% or greater decline in the stock market in a short period of time. The average rally period without a correction is 357 trading days, according to a Deutsche Bank analysis of stock market moves since the 1950’s.
As there are about 250 trading days in a year and Slack Investor is hoping for a 50-year investing career (50 x 250 / 357 )= 35 . That’s a lot of corrections … so I had better have a plan on how to handle them.
Despite recent rallies in the last few trading days – In January 2022, there was a technical “correction” in both the US and Australian markets.
The S&P 500 index dipped into “correction” territory on Monday for the first time since March 2020. The benchmark fell 10% or more from its recent high in early January, before a late-day rally.
Most corrections solve themselves. A 2018 Goldman Sachs report found that the average correction for the S&P 500 lasted only four months. In the 40 years prior to 2020, the S&P 500 experienced 17 corrections – only a third of them resulted in the larger falls associated with bear markets.
This is not an exact science – but when a correction occurs, I try to think about the scenario where a correction will turn into something worse.
As most bear markets are associated with a recession – Are the economic conditions are such that a recession is likely? – Is this current correction likely to lead to a “bear market”?
The Omicron COVID-19 variant has showed that it is difficult to project into the future. However, even though some industries are suffering, while interest rates remain low and there seems to be some signs of economic recovery. I will try to shut out the “noise” this time.
Index stocks – S&P 500, ASX 200, FTSE 100
I am running a personal 20-yr experiment using “stop losses” to try to time the market for index funds, rather than “buy and hold”. The results so far can be found on the index pages of this blog (ASX Index, UK Index, US Index). The annual gains using this timing method have been modest so far with outperformance of +1.5%, +1.9% and -0.3% , respectively. The jury is still out on this experiment and a full report will be given in 2024.
For the bulk of my holdings – do nothing
For most of my stocks, I take no action during these corrections. Most of my portfolio contains individual companies that I have built up a history with, and I am mostly convinced of their viability and growth outlook for the next 5-10 years. For these companies, I am comfortable to ride the stock price up … and down – this is something I accept about owning stocks. For example, although getting out of the US Index last week, I am happy to keep my holding of US Alphabet stock (GOOGL) – for many reasons.
Tinker with the stocks that you are not so sure about
There is a second-tier in my stock portfolio that includes my theme ETF’s and other companies that I am not so totally convinced about – or, I have changed my mind about their growth prospects. A correction is a good time to review these stocks.
With shares, the market decides what “it thinks” that your stock is worth on a minute by minute basis. This stock price can vary a lot on a daily basis – but over a longer period, the stock price should be decided by more fundamental levers such as earnings, amount of debt, quality of management, and growth potential.
January 2022 – End of Month Update
Slack Investor is off the couch and sold his US Index shares. He remains IN for Australian index shares (only just!) and the FTSE 100.
A bit of turbulence in the markets this month. The ASX 200 and S&P 500 dipped into correction territory briefly. At the end of the month, the Australian Index had a monthly fall of 6.4% and the US Index, down 5.3%. The FTSE 100 was a relative star +1.1%. Slack Investor remains watchful.
On Monday 24 January, (New York time) I sold my US Index shares at the S&P equivalent of 4332. This was below the previous days closing price (4397) … but I have to accept the possibility of a bit of “sell shrinkage” on the next day – in this case 1.5%. However, for consistency. I have used the closing price on the previous week for my calculations.
Despite the end of month rally in S&P 500 price (Jan 31 4515) – I am glad to out of the US Index as I have been troubled by the high valuations for some time. Slack Investor would not have the foresight to get out right at the top of the market. In the spirit of “trying to get things mostly right” I am happy with the US Index trade – a gain of 55.4% over 19 months.
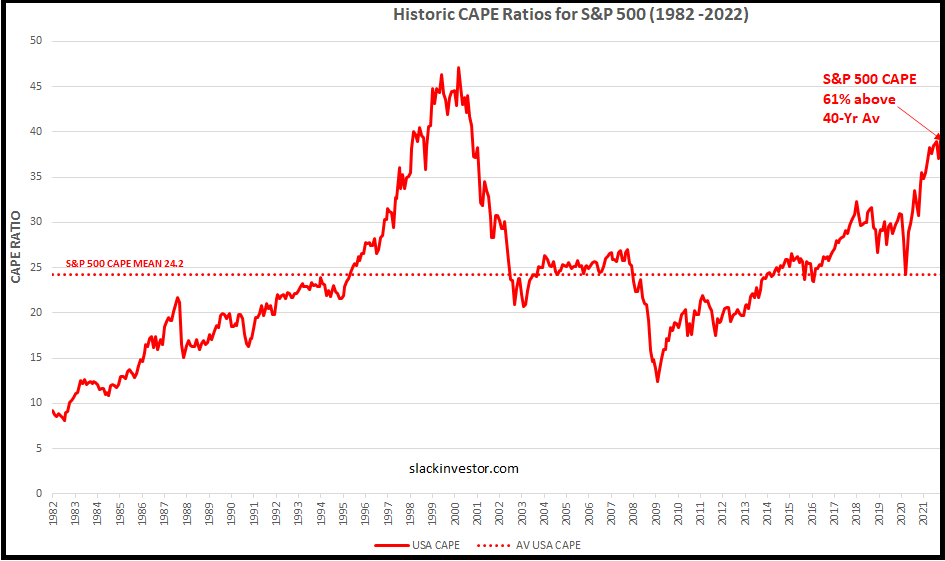
As a way of “zooming out” to get an idea of how current prices are in relation to long term trends – I have updated my Cyclically Adjusted Price to Earnings ratios (CAPE) to include December 2021 data for the S&P 500. Despite it’s limitations, CAPE is still Slack Investor’s best way of assessing quickly whether a market index is under or over-valued compared to its long term average.
At the end of 2021, the S&P 500 was still 61% above its 40-yr average! This is in contrast to the ASX 200 (14% above average) and the FTSE 100 (about average). When valuations get this far out of kilter, for the US Index, my assessment is that there is much more downside risk than upside. The recent breach of the stop loss on a weekly basis gave me an excuse to get out of this broad index.
CAPE ratios for the S&P 500 from January 1982 till December 2021
All Index pages and charts have been updated to reflect the monthly changes – (ASX Index, UK Index, US Index).
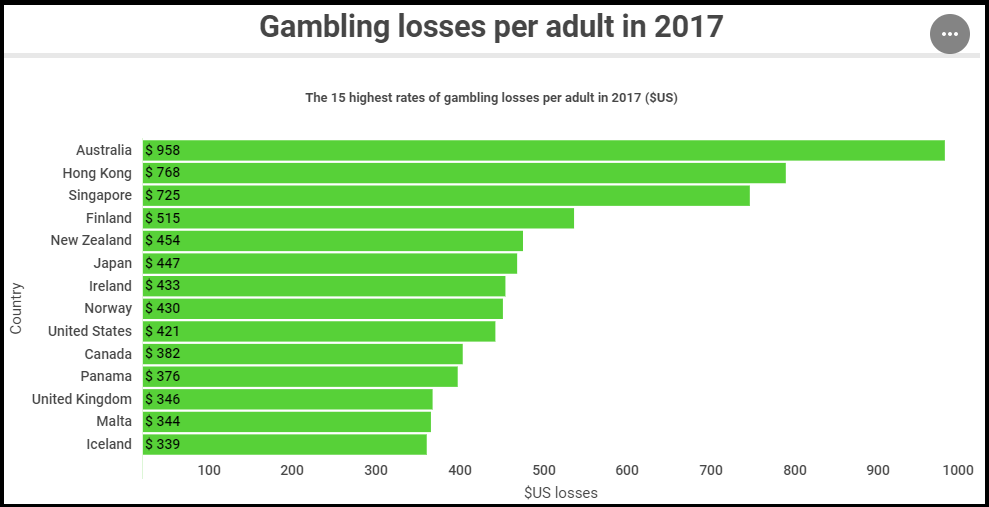
Slack Investor has long been appalled at the prevalence of gaming machines “pokies” in pubs in Australia. These “pokie rooms” are full of sad faces. With a machine “return-to-player percentage” of 85 -90%each gambler is methodically destroying any chance of achieving financial independence.
Australia is actually home to 20 per cent of the world’s pokie machines, because it is one of the few countries that allows machines outside of casinos.
In 2019, NSW and Victorian poker machine gamblers lose an average of about $3500 a year in pubs and clubs – three times the average $1245 spent annually on electricity and gas. There are countless stories of the tragic consequences of poker machine addiction. Poker machines are concentrated in Australia’s poorest suburbs. The state governments are, in turn, addicted to the revenue from these gaming machines. However, this situation can’t be good for the community and it can be turned around. Western Australia has banned poker machines in Pubs and Clubs. If you want to ban these machines or reduce their harm in your state – Let your state representative know.
Gambling Losses in $USD – Australia are the biggest gambling losers, per capita, in the world! Not anything to be proud of- From savings.com.au
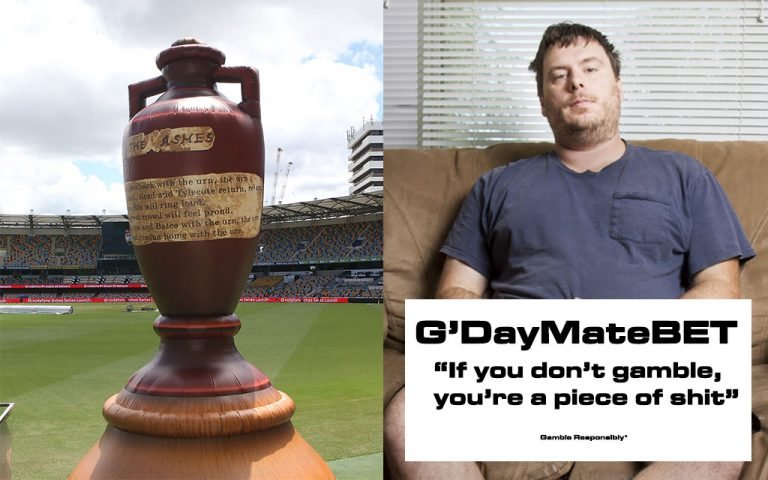
Since March 2020, the stock markets have been quietly accumulating and Slack Investor has spent some quality time on the couch – Sometimes watching sport. Hitting me in the face have been an avalanche of betting advertisements enticing me to get an app, to lay down some hard-earned cash on a match outcome, identify a “first try scorer” or a “multi” (???). Always, I am advised to “gamble responsibly” but this guidance is always accompanied with a wry grin as they collect my credit card details.
Commercial TV networks all seem to have an overlay of gambling ads as they cling to this growing industry – as their other advertisers are looking elsewhere. One of Australia’s largest advertisers is Sportsbet, they spent $AUD 139 million on ads in 2020. It is all about “Brand awareness”. In 2021, US Sports betting companies have spent a staggering $USD 1.2 billion on acquiring new customers. This will only increase as more US states legalize sports betting. With brand awareness comes a desire to download an app, promotional codes are given for gambling credits, you give your own bank details, place a bet … and suddenly you are a customer, and subject to further online conversion.
Slack Investor can see that gambling can introduce a bit of excitement to a life, but I would always take the long view. What are the chances that I would succeed in any form of gambling with repeated trials – where the odds are set by hardened professional compilers. Rather than gambling, I would much rather invest in a growing companies that produces useful things. That’s enough excitement for me.
Three-quarters of 8 to 16-year-olds interviewed could name at least one gambling brand, and one-quarter could name four or more.
Based on a 2016 survey of Australian children in NSW and Victoria
If you would like tougher rules to stop the saturation of prime-time television with gambling ads in Australia, you can put the commercial TV Networks on Notice and register a complaint with the Free TV umbrella organization. It seems to be that the language they understand is the threat to move your viewing to the streaming services that don’t show harmful and repetitive gambling ads (Netflix, ABC iview etc.). Slack Investor is not sure how effective this is – but it made me feel better.
December 2021 – End of Month Update
Slack Investor remains IN for Australian index shares, the US Index S&P 500 and the FTSE 100. All Slack Investor followed markets this month had substantial rises (ASX 200 +2.6%; FTSE 100 +4.6%; S&P 500 +4.4%).
Well, Santa did come to most index holders. The theory is that, in the US market, there is a lot of spending at this time of year (good for retail) and pay bonuses are also awarded at this time. The “Santa Claus Rally” has occurred 76% of the time between 1950 to 2019. Although this seems to be a regular calendar event, Slack Investor would not bet on it – as there also have been some sharp declines in December – particularly in the last ten years. Long-term accumulation for me – but it is a delight to see Santa when he comes.
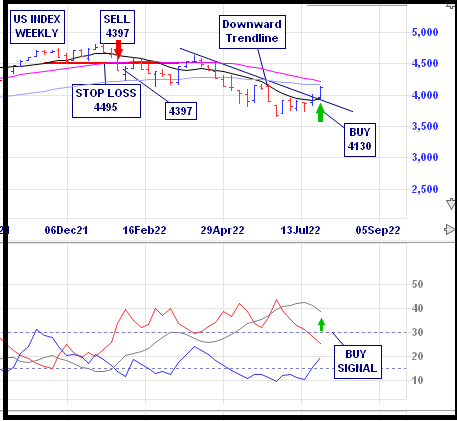
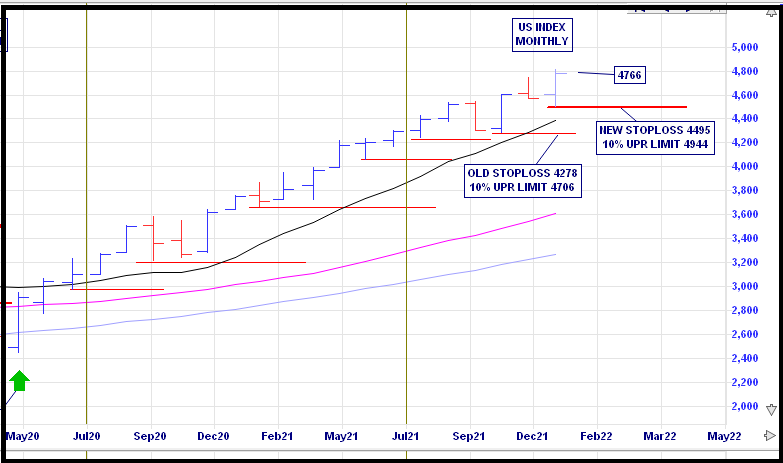
Slack Investor has been busy with adjusting stop losses upwards again for the US Index. In these over-valued times for the US Index, and to a much lesser extent the Australian Index, I am keeping my stop loss within 10% of the end of month price. See the US Index page for details.
Monthly chart for the US Index (S&P 500) showing upward movement of the Slack stop loss from 4278 to 4495 – from Incredible charts
All Index pages and charts have been updated to reflect the monthly changes – (ASX Index, UK Index, US Index). The quarterly updates to the Slack Portfolio have also been completed.