Where to go fishing? – Part 1 – Profitablity and Growth

A Day’s Fishing (circa 1923)Edward Henry Potthast

The obvious answer is … where there are fish.

Slack Investor is always on the lookout for growth companies … particularly when he is on the BUY! Since retirement, I haven’t had much chance to be on the Buy side of a transaction lately – as there isn’t that flow of fresh new money coming into the coffers from employment. Pre-retirement, any new money would flow into the cash reserves of my Super (SMSF -Self Managed Super Fund). When a sufficient amount of cash had built up, I would look around for some company shares to buy.

However, with the expected inflow of a bit of cash with the impending sale of Altium, I am starting to look around for suitable receivers of Slack Investor loot. Slack Investor is “Going Fishing”. The first thing I want in my pond is profitable companies – but I also want them to have a record of growth. In the second part of this fishing series, I will try to narrow things down to companies that I would actually like to buy.

Measures of Profitability

Slack Investor likes a company, that he invests in, to not only make a profit – but to use its shareholder funds in the best way to make a profit. There are many ways to look at profitability, but Slack Investor is pretty lazy in this regard and you won’t find him forensically gazing over profit and loss statements from a company report. I prefer couple of simple ratios to get an overview – I am no expert accountant.

Return on Equity (ROE)

ROE = Net Income/Shareholder Equity

I have always used Return on Equity (ROE) as a simple measure to give an idea on how a company is growing. Strictly speaking, the ROE is more a measure of profitability and how well it grows each dollar of company funds.

The higher the ROE, the more efficient a company’s management is at generating income and growth from its equity financing.

Investopedia

This metric is very easy to find in market aggregator sites such as Yahoo.com, Morningstar, or Investing.com. For a deep dive, I prefer Marketscreener.com – which has the advantage of showing Predicted ROE for the next few years on each companies financial page. One of the problems with ROE is that, companies with debt can present an inflated ROE.

Return on Invested Capital (ROIC)

ROIC = Net Profit (After Tax)/Average Invested Capital

The purest way of looking at how good a company is in converting shareholders money into profit is the ROIC. Unfortunately, this figure is harder to come by on the generic financial aggregator sites. This ratio is superior to the ROE as it accounts for the debt levels of a company – as the Average Invested Capital is the Average Equity – Average Debt.

Measure of Growth

Compound annual growth rate (CAGR)

A quick way of determining if a company is growing is the CAGR. It is often constructed from past , data. The “Compound Annual Growth Rate”—is the annualized rate of growth in the value of the Earnings, or Revenue, over a stated period. The maths is a bit complicated and best done on a spreadsheet or a search around the financial sites. I found limited CAGR data for stocks at Morningstar and finbox.com

CAGR is defined as the annualized growth rate in the value of a financial metric – such as revenue and EBITDA – or an investment across a specified period.

Wall Street Prep

Putting together Profitability and Growth

Fortunately there are some really nice blokes in the financial world that share the burden of responsibility to educate people about the share market as well as operating a profitable business. A shout out to Owen Raszkiewicz of the RASK Group. A great place to start your financial education with Owen is his Australian Finance podcast that he co-hosts with Kate Campbell. Slack Investor will often tune in to their discussions.

Below is a table Owen prepared in August 2023 that ranks Australian stocks in terms of their profitability (ROIC – Return on Invested Capital – Column F). He also shows, in the last column, the stock’s historical growth rate for the 5 years 2017-2022.

From Rask Media – ASX’s best companies published August 2023 – ranked in order of ROIC- Click on image to enlarge

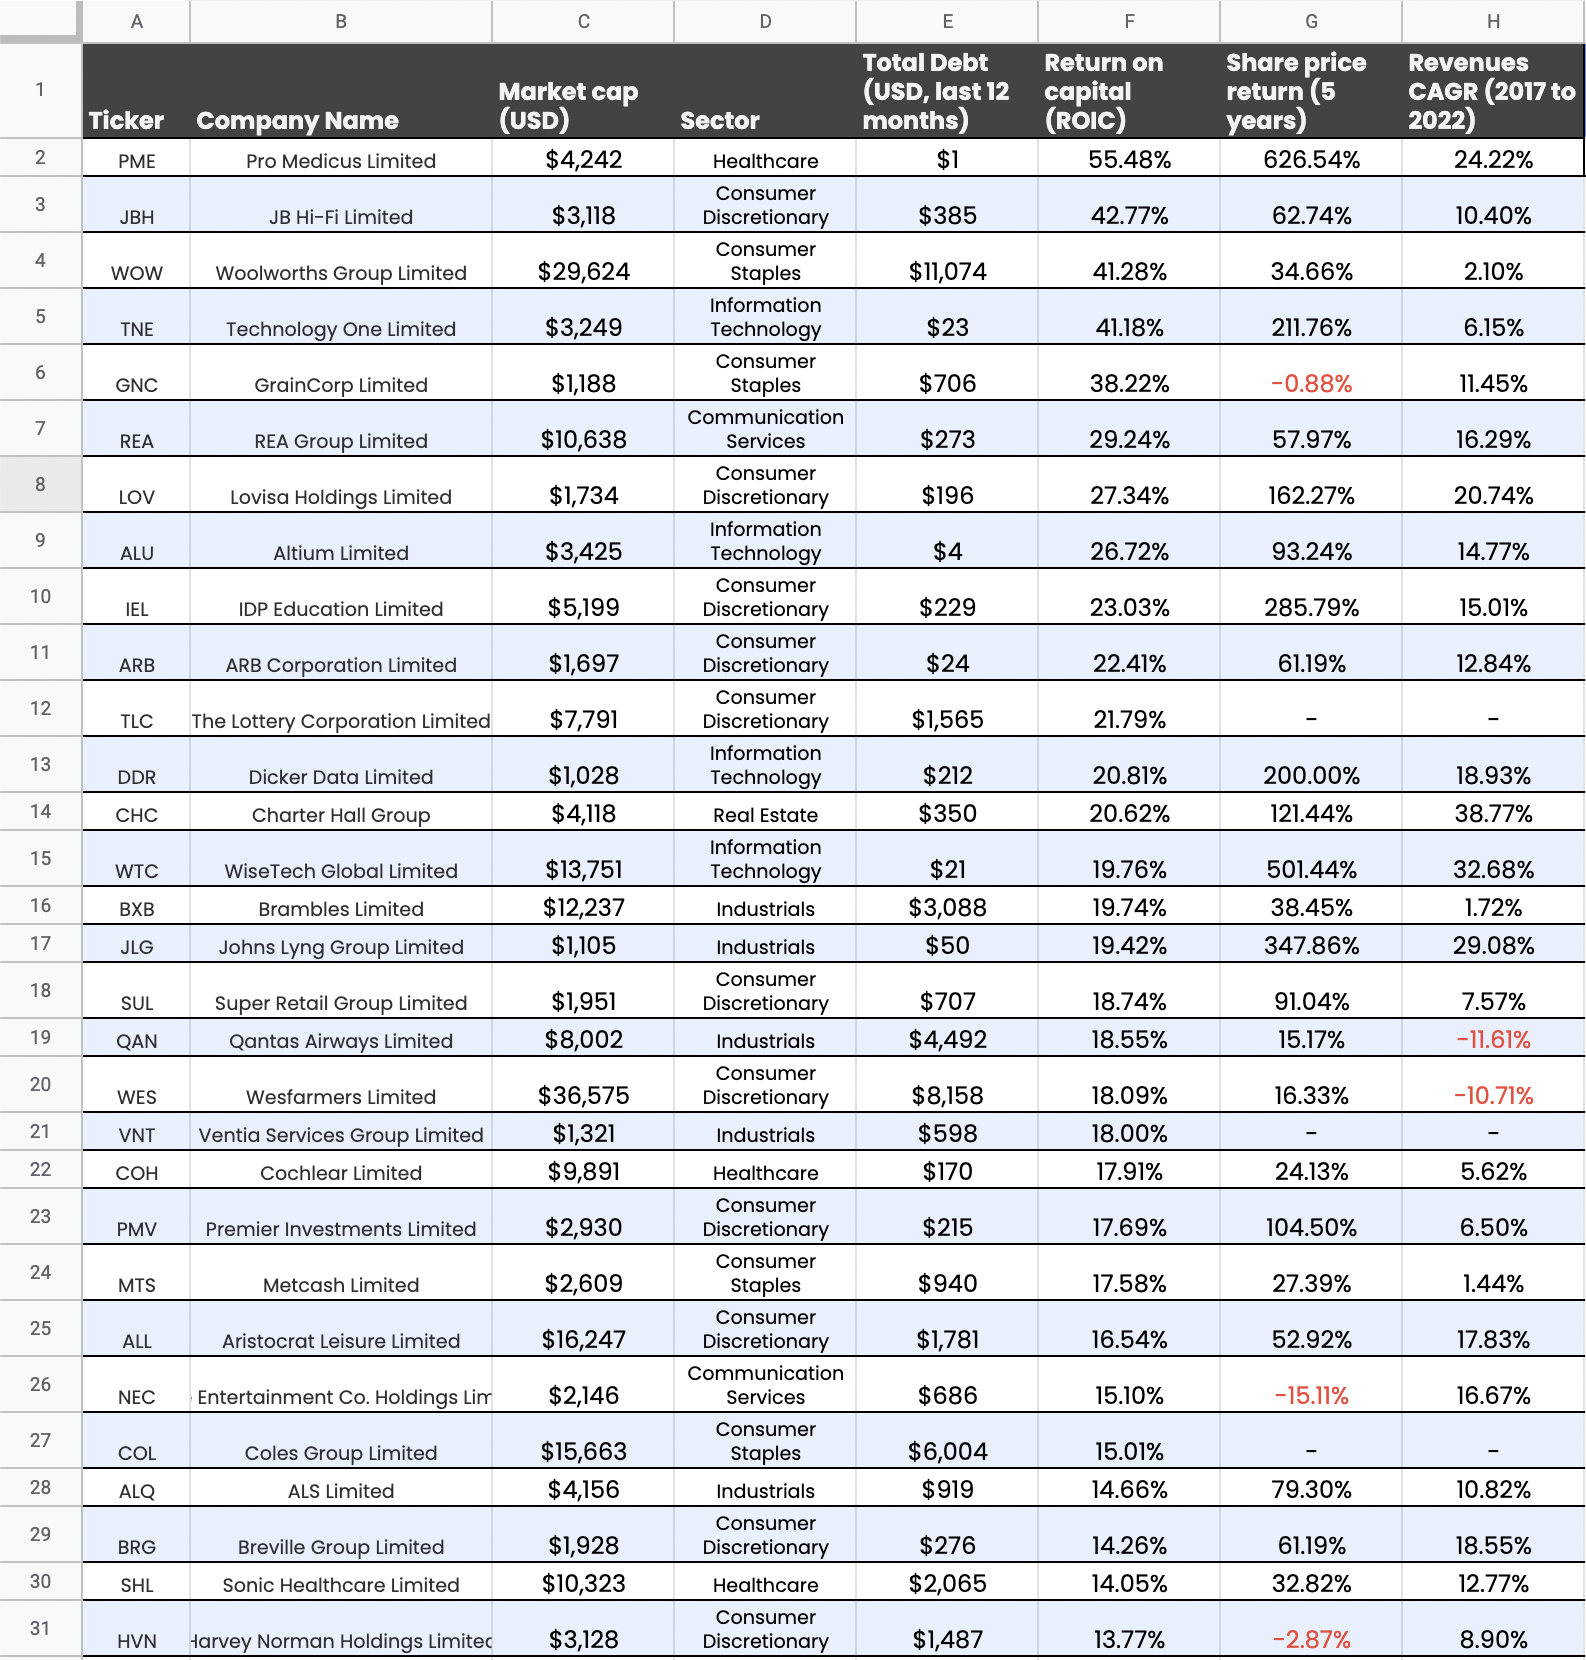
This is a great place to start fishing, metrics for profitability and growth in one place. Pro Medicus is standing out here – High profitability (ROIC 55.48%) and high historical growth (5-yr CAGR 24.22%). A complete picture needs both of these metrics. For example, Woolworths has a high profitability (ROIC 41.28%) but is laggard in historical growth (5-yr CAGR 2.10%).

The next article in this series will look at how Slack Investor narrows these stocks down and then screens them further with the P/E Ratio to try to make sure that each potential buying stock is not overpriced.

Altium (ALU)- Thanks, so sad to see you go … and March 2024 – End of Month Update

Renesas CEO Hidetoshi Shibata (left) and Altium CEO Aram Mirkazemi (right) firming up the takeover deal – From Business News Australia.

It is with very mixed feelings that Slack investor reports on the likely takeover of Altium (ALU) – one of his major holdings (16.6% of total Portfolio) – by the Japanese Renesas Electronics Corporation.

Renesas will acquire all outstanding shares of Altium for a cash price of A$68.50 per share, representing a total equity value of approximately A$9.1 billion

Altium Press Release – February 15, 2024

Although this represents a tidy profit, as I first bought into Altium about 10 years ago when they were trading at $3.30, I will be genuinely sad to stop being a shareholder of this wonderful company. I envisaged holding Altium shares for a very, very, long time!

Slack Investor’s 10-yr journey as an Altium shareholder – Monthly price chart from incrediblecharts.com – click chart for better resolution

Why I originally bought into Altium?

Let’s get this straight, Slack Investor is no stock picking genius. My portion of profitable sold shares is only about 55%. That is, I have made losses on 45% of them – it is not that impressive! – but my overall performance results are good.  This is because I follow the Peter Lynch philosophy – where you try to stay in the stocks that are performing well and “weed out” the stocks that are not doing well.

“Some stocks go up 20-30 percent – and they get rid of it and hold onto the dogs. And it’s sort of like watering the weeds and cutting out the flowers. You want to let the winners run.”

Peter Lynch – Legendary Investor and Fund Manager. From 1977 until 1990, he ran the Magellan fund where he averaged a 29.2% annual return for those years.

Slack Investor is always on the lookout for growth companies … and Altium poked up its head and looked at me in 2014 from one of the financial sites that I read. The next step is a bit of independent research. My “go to” here is the most excellent Market Screener site. I went through my usual process for buying and checked the Market Screener/Financials tab for a reasonable projected Price/Earnings ratio, an established record of improvement in earnings, and a forecast Return on Equity (ROE) above 15%. Altium stood out here with no debt and a ROE of between 35 and 50. This company was growing!

After my initial purchase, I bought more parcels of ALU over the next two years as the shares continued to grow and their outlook projections were confirmed.

The Altium Story

Altium is an Australian-based software company that provides electronics design software to circuit-board engineers. These circuit boards are in every bit of technology that we own.

By the time Slack Investor had woken up to the Altium story, Aram Mirkazemi was the established CEO of Altium Limited. He came to Australia from Iran as a refugee in the 1980’s after a 6-month stint in a refugee camp in Pakistan. He did not speak English. After gaining qualifications in IT and engineering, he met Nick Martin, the founder of Altium, at a soccer game and Nick offered him a job. After an eventual falling out, Aram left to start his own software company. When Nick steeped down as CEO, Aram returned to Altium with a vision to make Altium a world player in printed circuit board design.

… in order to be able to change the way the electronics industry works you need to be able to standardise on one platform, like the graphics industry did with Photoshop or Microsoft’s dominance of the operating system and productivity tools market.

After several years of growth and gaining market share. The Altium board rejected an offer of $38.50 per share from Autodesk Inc back in June 2021 as they thought that the offer ‘significantly undervalues’ the companies prospects. The 2024 Renesas offer is yet to be approved by shareholders, but it seems that all the significant players are already “on board”. The offer A$68.50 per share in cash. represents a premium of approximately 34% to the pre-offer price.

All I can say is, it has been an honour to be part-owner (shareholder) of this great company – Thank you Aram and his team. I will be selling part of my holding this tax year (to spread the capital gain over two tax years) and wait for the cash offer to come through in 2025 for the remainder.

March 2024 – End of Month Update

More Happy Days in the stock market. As the troubled world marches on, all Slack Investor followed markets rose this month. The ASX 200 up 2.6%, the FTSE 100 up 4.2%, and the S&P 500 up 3.1%,

Slack Investor remains IN for the FTSE 100, the ASX 200, and the US Index S&P 500.

All Index pages and charts  have been updated to reflect the monthly changes – (ASX IndexUK IndexUS Index). The quarterly updates to the Slack Portfolio have also been completed.

Market Value – February 2024

The Jeweller’s Bounty (1918)Daniel Cortes

A few times a year, Slack Investor likes to take a snapshot of the markets using the Cyclically Adjusted Price to Earnings ratios (CAPE) which use ten-year average inflation-adjusted earnings. I first started using CAPE as a “value” tool in September 2021 and, my most recent look was in mid-November 2023. I have decided to do this CAPE market value analysis every 3 months – as I like to keep a feel of where we are – as the market cycles. The next update will be in mid-May 2024.

By plotting this CAPE over a period of time, we can look at how the whole sharemarket is currently valued in terms of historical data – this way we can track the whole share market as it oscillates between overvalued and undervalued.

Using monthly CAPE data from Barclays, the 40-yr mean is calculated and plotted together with the CAPE values. A “fair value” zone is created in green where the CAPE is within one standard deviation of the mean (average).

ASX 200 Value

Historic CAPE ratios for the ASX 200 – From 1982 to end of January 2024 – Click the chart for better resolution.

FTSE 100 Value

Historic CAPE ratios for the FTSE 100 – From 1982 to end of January 2024– Click the chart for better resolution.

S&P 500 Value

Historic CAPE ratios for the S&P 500 – From 1982 to end of January 2024 – Click the chart for better resolution.

At the end of January 2023, the FTSE 100 (11% below the 40-yr average) is the only followed market “ON SALE”. I love a price reduction!

The ASX 100 (4% above the 40-yr average) is in the “Fair Value” zone. However, the S&P 500 still looks well overvalued at 32% above the 40-yr average – and has just moved above the “Fair Value” zone.

Market Value

The Jeweller’s Bounty (1918)Daniel Cortes

A few times a year, Slack Investor likes to take a snapshot of the markets using the Cyclically Adjusted Price to Earnings ratios (CAPE) which use ten-year average inflation-adjusted earnings. I first started using CAPE as a “value” tool in September 2021, and my most recent look was in May 2023.

By plotting this CAPE over a period of time, we can look at how the whole sharemarket is currently valued in terms of historical data – this way we can track the whole share market as it oscillates between overvalued and undervalued.

Using monthly CAPE data from Barclays, the 40-yr mean is calculated and plotted together with the CAPE values. A “fair value” zone is created in green where the CAPE is within one standard deviation of the mean (average).

ASX 200 Value

Historic CAPE ratios for the ASX 200 – From 1982 to end of October 2023– Click the chart for better resolution.

FTSE 100 Value

Historic CAPE ratios for the FTSE 100 – From 1982 to end of October 2023– Click the chart for better resolution.

S&P 500 Value

Historic CAPE ratios for the S&P 500 – From 1982 to end of October 2023– Click the chart for better resolution.

At the end of October 2023, both the ASX 100 (8% below the 40-yr average) and the FTSE 100 (15% below the 40-yr average) are “ON SALE”. If I have a choice, I will always look to buy in the sale period.

The S&P 500 still looks a little overvalued at 16% above the 40-yr average – but at least it has slipped back into the “Fair Value” zone.

Financial Year 2023 Slack Results

“I believe in evidence. I believe in observation, measurement, and reasoning, confirmed by independent observers. I’ll believe anything, no matter how wild and ridiculous, if there is evidence for it.

Isaac Asimov – US Author and Biochemist

Good fortune has prevailed in FY 2023. After the tough investing year of FY2022, Slack Investor has stuck to his strategy of investing with growing companies that have an established earnings record and forward P/E ratios <50 (Mostly!). As always, there have been a few lapses, but that’s just part of being an investor.

I expect a bit of volatility in my (mostly “growth”) investment portfolio and I try to reassure myself that, despite the odd negative year in the Slack Investment Portfolio the Stable Income portfolio is doing its job and keeping Slack Investor with enough cash to keep things running. In the world markets, the FTSE 100 Total Return Index was up 7.8% (last FY up 5.7%). Dividends helped the Australian Accumulation Index to be up 10.6% for the financial year (last FY -7.5%). The S&P 500 Total Return Index is again full of optimism – and was up 19.7% (last FY -10.7%) for the same period. All of these Total Return Indicies include any accumulated dividends.

Slack Portfolio Results FY 2023

All Performance results are before tax. The Slack Portfolio is Slack Investor’s investment portfolio and, after the first negative year since starting this portfolio in 2010, I am delighted to be “Back in the Black” – with an annual FY 2023 performance of +17.9%. Full yearly results with benchmarks are shown in the table below.

FY2022 was another bumper year in real estate – particularly Brisbane -but there has been a welcome pause in housing prices for FY2023. For property, the actual falls in asset values is greater than that shown as Slack Investor is using the Total Return values supplied by CoreLogic. The Total Return is calculated from value change as well as the gross rental yield. I would have preferred calculations that include the net rental yield, but this will have to do. The Total Return is a more realistic figure when comparing real estate returns to stock market total returns, as it treats both asset classes as investments.

The share market was the place to be for FY 2023, with the Australian Share market Total Return Index (ASX200 Acc) up 10.6% and the Vanguard Diversified Growth ETF (VDGR), comprising mostly (68%) of International and Australian Shares, increasing by 11.2%. Inflation is again coming in big – with the CPI at +6.0% – reinforcing the need to have exposure to “growth assets” such as shares or property.

Yearly Performance (%) results since 2010

YEAR SLACK FUND MEDIAN BAL VGARD GROWTH ASX200Acc RES BRIS RES MELB CASH CPI
2010 6.6 9.8 12.3 13.1 10.8 26.9 4.2 3.1
2011 2.5 8.7 9.1 11.7 -2.4 0.9 4.4 3.7
2012 8.3 0.4 1.3 -6.7 1.3 -0.9 4.3 1.2
2013 26.5 14.7 18.6 22.8 7.7 8.3 3.2 2.4
2014 23.6 12.7 14.5 17.4 11.5 12.8 2.6 3.0
2015 2.4 9.6 11.8 5.7 7.7 15.6 2.5 1.5
2016 14.2 3.1 4.2 0.6 8.4 9.5 2.2 1.3
2017 19.5 8.1 8.8 14.1 6.5 17.7 1.9 1.9
2018 37.6 7.2 10.0 13.0 5.2 3.9 3.9 2.1
2019 19.7 6.2 9.8 11.5 1.7 -6.0 2.0 1.3
2020 9.4 0.3 0.6 -7.7 8.4 13.8 1.1 -0.3
2021 21.7 13.0 20.3 27.8 17.9 10.7 0.2 3.8
2022 -14.3 -2.5 -13.0 -6.5 25.6 3.1 0.3 6.1
2023 17.9 6.9 11.2 10.6 -4.1 -2.6 2.6 6.0

The Slack Fund yearly progress vs BENCHMARKS. The Median Balanced Fund (41-60% Growth Assets)Vanguard Growth FundASX 200 Accumulation IndexCorelogic Residential Property Home Value (Total Return) Index in both Brisbane and Melbourne, and Cash (Australian Super Cash Fund) and Consumer Price Index (CPI)

Although I collect yearly figures, the 5 and 10-year compound annual performance gives me a much better idea about how things are going and will smooth out any dud (or remarkable!) results. The Slack Fund is still ahead of Benchmarks – but currently being challenged by Brisbane Residential real estate over a five-year period.

5-yr Average Annual Performance
Slack Investor 5-year compound annual rate of return – compared to benchmarks – Click for better resolution.

The beauty of compounding with a succession of good performance results can be seen in the chart below showing the growth of an initial investment in June 2009 of $10000.

Growth of a $10000 Investment Since 2009
The rate of growth of $10000 invested by Slack Investor in FY 2009 – compared to benchmarks – Click for better resolution.

10-year compound annual rate of return

The Slack Fund has been around a while and, at last, I am generating some long term data (10-year compound “rolling” annual rate of return). Over this time frame, the Slack Fund has been performing very well. A 10-year annual rate of return of over 14% – Go Slack Fund!

However, the 10-yr rates of return of the Median Balanced Fund, Vanguard Growth fund, ASX200, and residential property in Brisbane and Melbourne are also great long term investments, generating a 10-year compound annual rate of return of 6-9% p.a. From the figures below, although it can add stability to a portfolio, Cash as a long term investment, is a poor choice.

Average 10-yr compound yearly return

YEARSLACK FUNDMEDIAN BALVGARD GROWTHASX200AccRES BRISRES MELBCASH
2019 15.6 8.0  10.0 5.8 8.5 2.9
2020 15.9 7.0  7.8 5.5 7.3 2.6
2021 17.9 7.4  9.3 7.5 8.3 2.2
2022 15.2 7.1 8.1 9.3 9.9 8.7 1.8
202314.4 6.4 7.4 8.2 8.6 7.6 1.7

The Slack Fund average 10-yr compound yearly return vs BENCHMARKS. The Median Balanced Fund (41-60% Growth Assets)Vanguard Growth FundASX 200 Accumulation IndexCorelogic Residential Property Home Value (Total Return) Index in both Brisbane and Melbourne, and Cash (Australian Super Cash Fund) and Consumer Price Index (CPI)

Gold Digger … and January 2023 – End of Month Update

The 2019 BBC TVseries Gold Digger delves into the messy world of a wealthy older woman who is swept off her feet by a younger man. Are his intentions honourable?

The term “gold digger” has been around for a while and is not a nice label to have. Usually defined as people who are in, or are pursuing, romantic relationships primarily for financial gain. However, Slack Investor is resolved to start digging for gold himself. Not just now, but whenever the stock market gets a bit over-valued again.

She take my money when I’m in need

Yeah, she’s a triflin’ friend indeed

Oh, she’s a gold digger

Gold Digger – Kanye West and Jamie Foxx

What turned my attention to gold, and the need to start digging, was this remarkable table put out by Stockspot. Over the past 5 calendar years, when comparing Global Shares, Australian Shares, Emerging Share markets, Gold, and Bonds. Gold has topped the Investment performance table in 3 of the past 5 years! Diversification, it seems, is important.

Yearly returns comparison of Global Shares, Australian Shares, Emerging Share markets, Gold, and bonds – Stockspot – Indices used: S&P/ASX 300, MSCI World ex Australia, LBMA Gold AM Price AUD, MSCI Emerging Markets, and Bloomberg AusBond Composite 0+ Year – Click Image for enlargement

In their usual thorough way, Stockspot has investigated the best way to own gold as an investor. Rather than getting a few nuggets or gold bars,  they like to use ETF’s to gain exposure to gold. They analysed three ETF’s

  • Global X Physical Gold (GOLD)
  • Perth Mint Gold (PMGOLD)
  • BetaShares Gold Bullion ETF – Currency Hedged (QAU)

Weighing up costs, buy/sell spreads, liquidity, size and the type of gold assets held they decided that Global X Physical Gold (GOLD) was the best Gold ETF to hold. The liquidity (the ability to quickly buy and sell your gold using an ETF) is a huge factor. The management costs of 0.4% p.a. sounded a bit steep to Slack Investor but, I suppose, there are costs in having to house and secure these gold bars somewhere in a vault in London.

Slack Investor has no financial relationship with Stockspot but thinks they offer excellent low-cost, automaticilly re-balanced investing portfolios. Some of Stockspot’s portfolios hold, at times, up to 15% gold!

Slack Investor will start out small and just dip his toe into the water as there is the general Slack reluctance to hold a non-income producing asset. However, I can’t argue with the results of having gold in your portfolio during times of crisis.

From Stockspot
89-year-old oil billionaire J. Howard Marshall II and 27-yr-old Anna Nicole Smith. They married in 1994. Following Marshall’s death after 13 months of marriage, Anna Nicole Smith unsuccessfully battled his son over her husband’s estate – From Interview Magazine

The tragic life, of Anna Nicole Smith is an eventful tale of a woman often labelled as a modern-day gold digger. Slack Investor hopes his gold digging will end more fortunately. Hopefully at some time in the future, during the delightful times when the markets are considered overvalued, Slack Investor has made “a note to self” – start digging for gold – and buy some gold ETF as insurance.

January 2023 – End of Month Update

Slack Investor remains IN for Australian index shares, the US Index S&P 500 and the FTSE 100.  The Slack Investor followed overseas markets have had a bumper month to welcome the new year ( ASX 200 +6.2%; FTSE100 +4.3%;  S&P500 +6.2%).

There was some adjusting upwards of the stop losses for the FTSE100 and the S&P500, with details on the UK Index, and US Index pages.

As indicated in the last post, the ASX market has reached a significant point at the end of the month. Shown in the bottom part of the chart, the Coppock indicator is moving upwards after a journey below the zero line. This is a prediction that the “bottom of the market” has passed and it might be a good time to buy (not advice). Also, the FTSE100 is moving upwards after a minimum – a good sign, but not a true Coppock prediction as the curve had not spent time below the zero line. The S&P500 Coppock curve has yet to turn upwards.

Monthly charts of the ASX 200, FTSE100 and S&P500 together with the Coppock Indicator in the lower section of each chart. The green arrows show the “bottom of the market” predictions using the Coppock Indicator. The red arrows show a possible time to sell – Click the chart for better resolution – Incrediblecharts.com

All Index pages and charts  have been updated to reflect the monthly changes – (ASX IndexUK IndexUS Index).

Let’s Lay a Few Bricks … and Mid-Month Update

A 1999 extract from The Sydney Morning Herald showing a 13-yr old Chris Brycki – smartcompany.com.au

Slack Investor will admit to being less than young … but I am still capable of being a “Fan boy” when I see something impressive happening in the financial world.

After a series of schoolboy stock picking successes – winning the ASX’s Share Game a remarkable 3 times and, at university, he entered the JP Morgan Trading Competition, which he also won several times. The talented Chris “the Brick” Brycki, launched into a career with stockbrokers and financial houses. After a while, he started to question the long term performance of fund managers.

“… The problem is that over time, even by being right, the value added is not big enough to counteract the 1% fee that a lot of these fund managers charge.”

Chris Brycki – Stockspot – Livewire

Chris founded Stockspot in 2013 as an alternative way to invest. Their Robo Advice model offers a low-cost automated alternative to traditional fund managers and advisors. After a simple online survey to determine your investing stage and risk tolerance, an investment portfolio type is recommended to you.

Stockspot Building Blocks

Chris, founder and CEO of Stockspot, in 2020 – From smartcompany.com.au

Chris (and Stockspot) have come up with the breathtakingly simple, yet genius (Both Slack Investor and Donald Trump have a loose definition of genius), strategy. After researching thousands of ETF’s and, based on exposure, performance and low fee costs – Stockspot has selected just 5 of them as the building blocks for a range of different portfolios. The portfolios are based on risk tolerance, financial situation and the investor’s appetite for volatility. The five component ETF’s are in Australian Shares (VAS), Global Shares (IOO), Emerging Global Markets(IEM), Australian Fixed Income (IAF), and Physical Gold (GOLD).

ETFSymbol (ASX)1-yr PerformanceGrowth since InceptionManagement Fee
Vanguard Australian Shares IndexVAS-7.92%8.25%p.a (13+ years)0.10%p.a.
iShares Global 100 IOO-4.43%7.37%p.a. (15+yearsr)0.40%p.a.
iShares MSCI Emerging MarketsIEM-20.59%7.18%p.a.(19+ years)0.69%p.a.
iShares Core Composite BondIAF-11.42%2.73%p.a.(10+ years)0.15%p.a.
ETFS Physical GoldGOLD+7.34%7.75%p.a.(19+ years)0.40%p.a.
The five ETF’s that Stockspot use to build their portfolios (1-yr Performance is to 13Oct 2022) – most of these ETF’s have a $500 minimum if you are investing directly.

It is best to disregard the above 1-yr performance – It has just been a bad year for most assets. The ETF management fees are low (depending on ETF complexity), there is good long term performance (Growth since Inception) and they have selected Physical Gold for inclusion.

Slack Investor does not naturally lean into Gold as it is a speculative, non-income producing asset. However, I might have to change my mind here. The reason Stockspot include Gold in all their portfolios is based upon historical data and the way gold tends to outperform in times of crisis. The results in this last year performance of +7.34% for Gold, speak for itself – as other asset classes flounder.

Mixing it all up

Slack Investor has written about Stockspot before in terms of Robo Advice and their valuable Superannuation reports. By using these 5 ETF’s in various combinations, Stockspot is able to give their customers a combination of returns and risk at a relatively low cost. There are even sustainable versions of each of the below portfolios available. As an example, the moderately conservative Sapphire portfolio is constructed with the following portions.

VAS: 27.2%
IAF: 35.2%
IEM: 14.4%
IOO: 7.9%
GOLD: 14.8%

A chart showing relative risk and return (grey line) of a portfolio varying between 100% Australian Bonds and 100% Australian Shares. The Stockspot portfolios have historically yielded lower returns than 100% Australian Shares) – but only slightly in their most aggressive Topaz portfolio. Overall, through their diversification, the portfolios represent much lower risk.

After fees, over a 5-yr period, Stockspot has outperformed 99% of similar funds over 5 years.

AMETHYST
Conservative
SAPPHIRE
Moderately conservative
TURQUOISE
Balanced
EMERALD
Growth
TOPAZ
High growth
3.1% p.a4.8% p.a5.3% p.a6.1% p.a6.8% p.a
5-yr annual performance (After Fees) – to 30 September 2022 – From Stockspot

There are fees involved for Stockspot to manage your money. For a balance of $200000, they amount to 0.66%. At first blush, these fees (on top of the ETF fees) sound a bit steep to Slack Investor. However, for all types of investors, with a time horizon of at least 3-5 years, for a stress-free place to put your money, this might be exactly what they are looking for. Stockspot do a tailor-made portfolio construction, all the re-balancing of assets and, they take care of all brokerage costs – Not Bad! They even have zero management fees for children accounts up to $10,000 (for under 18s) and the ability to dollar cost average with regular top-ups.

Stockspot does not earn fees from or have a commercial relationship with the ETFs we recommend. We don’t pay professionals for recommending our service to their clients.

Stockspot

Slack Investor can think of lots of situations where people would like a decision-free, low-fee, diverse investment that is designed to grow in the long term. Well done Chris Brycki (and Stockspot), for advancing the investing cause with particular attention to keeping the fees down … you are a Slack Investor Hero.

October 2022 – Mid-Month Update

This image has an empty alt attribute; its file name is trend-1445464__180.jpg

Despite the above discussion, my small-scale market timing experiment continues until its projected end in 2024. My frustration with this experiment continues – as it often goes against one of Slack Investors firm beliefs. If you can avoid it – Do not sell an asset when it is undervalued. Using historical CAPE values, at the end of September 2022, the UK Index (FTSE 100) was 13% below its long term mean, the US Index (S&P 500) was 9% above its long term mean, and the Australian Index (S&P 500) was 7% below its long term mean.

At the end of September 2022, Slack Investor was on SELL ALERT for Australian index shares (ASX 200), the US Index (S&P 500) and the UK Index (FTSE 100). Each of them had broken through their monthly stop loss.

 I have a “soft sell” approach when I gauge that the market is not too overvalued. I generally will not sell against the overall trend but monitor my index funds on a weekly basis once the monthly stop loss has been triggered.

Well … I can see no obvious up-trend at the end of the week for the US and UK markets and will exit at the end of week price of 3583 for the S&P 500 and 6858 for the FTSE 100. I am still just hanging in with the ASX 200 as they had a strong finish to the week.

The Index pages and charts  have been updated for the  UK Index and US Index. 

Keep On Course … and September 2022 – End of Month Update

Randall Reeves encounters a storm in the Indian Ocean in 2017 – Is this what the current stock market turmoil feels like?

Slack Investor loves finding out about remarkable achievements. He came across the inspiring story of Randall Reeves who set himself the task of doing a solo “figure of 8” circumnavigation around the Americas and the Antarctic. This 64 400 km trip encompassed both polar regions and was achieved solo, in the 14m boat “Moli”, in 384 days.

… he (Randall) hit a severe storm in the Indian Ocean. Waves were breaking 200’ (61m) to 300’ (91m) in each direction, and his boat got knocked down so intensely his mast was fully submerged, breaking a window in the pilot house and flooding his electronics.

Extract from The Figure 8 Voyage – Randall Reeves
Randall Reeves during his adventure, after his circuit of the Antarctic and back to Cape Horn for the second time!.

I mention Randall Reeves achievements as he set himself a difficult challenge, that no one had achieved before, and succeeded on his second attempt. All we investors have to do, is pick a course to financial independence – and just keep going. Our boat might suffer a few perils along the way …. but we trust that it is a sound vessel – and it will get us home.

Bear Markets

The 9 MSCI “All Country” World Index Bear markets in the 42 years since 1980 and January 2022 With an overlay in grey of the actual MSCI AC Index. – Vanguard

Downturns aren’t rare events: Typical investors, in all markets, will endure many of them during their lifetime.

Vanguard, 2022

Slack Investor can speak with some experience here, as I have been an investor through all of the above bear markets … and they are never any fun! But, I have learned that … they all pass – and the stock market recovers, and always reaches new highs. The sometimes frustration of just “holding on” to your shares in a falling market must be weighed against the stresses of trying to time the market.

Keep on Course

Slack Investor has had mixed success in his timing the market experiment. The experiment is limited to index funds (Less than 3% of my Portfolio) and will run for another 2 years to make it a 20-year trial.

At the end of September 2022, my Index Timing strategy has outperformed the Australian Index (+1.4% p.a.) and the UK Index(+1.9% p.a.), but underperformed the US Index (-0.3% p.a.). My current feeling is that when considering that “time out of the market” means a loss of dividends, it is not worth the stress and effort and I will probably abandon the experiment in 2024 – after a 20-yr trial. The bulk (97%) of my Investments portfolio is run with the strategy of trying to buy good companies that are growing, tinkering a little, but generally just holding on!

The world MCSI AC Index is dominated by US companies (61.3%). The current 2022 World MCSI ACWI bear market is not shown in the above chart. Also, there is some argument whether the 2020 “Covid Crash” qualifies under the generally accepted definition of a Bear Market – a decline of 20%, or over, that lasts at least 2 months.

We humans naturally feel the need to do something when we see our investments fall in value. Slack Investor does not know if the worst is over, probably not! Slack Investor does know that, if you can avoid it, it is generally not a good idea to get rid of your risk-exposed assets during times of downturns – you are selling your assets cheaply in these times.

Vanguard have (below) kindly extracted the Bull markets (shaded in green) from the Bear markets (shaded in brown) for the MSCI All Country World Index since 1980 prior to January 2022. The Bull’s prevail and these pesky Bear markets will eventually pass – This chart is reassuring.

The Bull (shaded in green) and the Bear markets (shaded in brown) for the MSCI AC World Index since 1980. The gains/losses are expressed in percentage terms. – Vanguard

The World Index (MSCI AC), the S&P 500, the Dow Jones Industrial Average, and the Nasdaq are now in a bear market, and the S&P 500 has closed at a new 2022 low. 

We might not be on a solo circumnavigation through dangerous waters … but the lesson here is to prevail. Tighten the belt if you have to, you have a plan! Endure the situation and try to distract yourself from the stock market with life’s enjoyable things.

The stock markets will do what they always have done, oscillate between over-priced to under-priced. The long-term gains provided by holding shares are well established. If you are still working, your regular saving and investing will be buying lots of shares through dollar-cost-averaging.

If you are retired, in these tough times, you have your stable income pile to help with your living expenses. There will be better times.

September 2022 – End of Month Update

This image has an empty alt attribute; its file name is trend-1445464__180.jpg

Despite the above discussion, my small scale market timing experiment continues. Slack Investor is on SELL ALERT for Australian index shares (ASX 200), the US Index (S&P 500) and the UK Index (FTSE 100).

 I have a “soft sell” approach when I gauge that the market is not too overvalued. I will not sell against the overall trend but monitor my index funds on a weekly basis once the monthly stop loss has been triggered.

All my followed Index funds have fallen below their stop loss values. Big monthly falls for the ASX 200 (-7.3%), S&P 500 (-9.4%), and the FTSE 100 (-4.1)%. Time for some distraction from the market carnage. There will be better times.

All Index pages and charts  have been updated to reflect the monthly changes – ASX IndexUK IndexUS Index. The quarterly updates to the Slack Portfolio have also been recalculated.

Retirement Income

The Art Institute of Chicago

I am hoping that your retirement does not upset as many people as in this James Gillray (1756-1815) painting of “Integrity Retiring From Office”. You can hopefully avoid this by leading a good life and providing yourself with income for this wonderful stage of your life.

There are lots of ways to do this – Slack Investor likes to separate his non-house assets into a Stable Pile and an Investment Pile in his Self Managed Super Fund (SMSF). Most of the commentary on this website has been about the Investment pile as this is the most exciting – and produces the most gains – and lately, the most losses. My Investment pile is volatile as there is greater risk (and opportunity for growth) in this part of the portfolio.

The Stable Pile is mostly to supply me with guaranteed income during the market downturns. Slack Investor’s Stable pile consists of Cash, Term Deposits, An Annuity, Fixed Interest, Real Estate and Bond ETF’s, and some dividend-producing consumer-staple shares.

If the previous financial year has been a good year for investments, my next years annual income requirements can be withdrawn from the investments pile. If you get a bad year for investments, then, I dip into the stable income pile. I try to keep my ratio of Investment Pile to Stable Pile at about 70%:30% and I roughly rebalance at about this time of year (July/August/September).

Using this method, you are always selling from your investments pile when the market is high and buying when the market is low

Slack Investor – A Further look at three pile theory

This method suits Slack Investor, but there are other ways to provide yourself with income in retirement.

Dividends

The well known Australian investor Peter Thornhill, is a great proponent of using dividends to provide retirement income. His MySay articles are well worth a read. Peter maintains that dividends supply an inflation-protected, income that doesn’t vary as much as stock prices do. He supports this strategy by keeping sufficient cash in his superannuation account to fund the next 3 years minimum pension withdrawals (For the Australian superannuation system) – this helps avoid forced selling. The rest of his fund is in Industrials and Listed Investment Companies (e.g. Argo (ARG), Whitefield (WHF)). He has tested his strategy through market cycles and his strategy has been vindicated through the Covid-19 downturn with even some LIC’s using maintained profits to keep dividends going.

Whitefield Ltd is a Listed Investment Company (LIC) that has generally maintained its dividend Per Share (DPS – blue columns) for the past 50 years – even during periods of downturns where the Earnings Per Share (EPS – Red line) of its contributing companies were declining. From Peter Thornhill

Lifetime Annuity Payments

There are many different types of annuity. Annuities have not been very popular in Australia due to their pricing, relative complexity and inflexibility. Challenger has a few of these products available in Australia with rates at September 2022 for a lifetime inflation-protected annuity of $5104 for a 65-yr-old male for every $100000 invested. There are other options for payments that can be either deferred or market linked. Although you can access these annuities directly through their website, the current model that Challenger prefers is access through a financial advisor.

Retirement Income Stream products

Way back in the Australian 2016/17 government budget, Treasury proposed a series of reforms that included removing barriers to innovation in retirement income stream products. This tinkering was brought about by the realisation that the Australian Super model was mostly fit for purpose in the “accumulation” stage – but was lacking in retirement income stream products that address Longevity Risk – the risk of outliving your savings.

Hopefully, with the benefit of compulsory superannuation, most people would have a pile of superannuation money when they retire – and a desire to turn that pile into income (after paying off any debts). Everybody wants to maintain their standard of living in retirement and would prefer something to invest in that would give them the peace of mind of having a guaranteed income stream for life.

At last some new products are staring to emerge from the super funds. Slack Investor was excited to come across the MyPension income stream from Equipsuper. It is a “set-and-forget” investment strategy that nicely mixes a bit of risk assets (to keep your pension fund growing) with more conservative elements (to maintain a more steady income). This fund uses a similar method to the Slack Investor strategy of using “piles” or “buckets”.

To use the Equip MyPension, you would have to roll your existing super into their fund on retirement. Your super is separated into three distinct investment ‘buckets’. The automatic rebalancing of this product would suit those who want to be a bit more “hands off”.

Equip MyPension option for maintaining a retirement income stream.
  • Cash – For regular income payments, usually comprised of three years income  – about 20% of investment.
  • Conservative – Investments in low risk categories including cash and bonds  – about 40% of investment.
  • Growth – Investments to grow your savings, subject to short term fluctuations – about 40% of investment.

The clever thing is how these buckets work together over time. When investment markets are good, any earnings in the conservative and growth buckets go into the cash bucket, locking in your gains (Automatically). If markets experience a downturn, we’ll leave any buckets that lose value untouched at the end of year, to allow them to recoup losses in future years.

EquipSuper MyPension

Slack investor has just two piles for his retirement – the Stable Income pile (Cash and Conservative) option and an Investments pile- and I do my own annual rebalancing. My investment pile is a bit more aggressive than the EquipSuper offering – more volatile, but Slack Investor likes to meddle and, is developing a “strong stomach”.

Financial Year 2022 Slack Results

“When you can measure what you are speaking about, and express it in numbers, you know something about it. ”

Lord Kelvin (William Thomson, Mathematician and Physicist, 1824-1907)

Slack Investor reflects on a tough investing year. I have mostly “stuck to my guns”  investing with growing companies that have an established earnings record and forward P/E ratios <50. There have been a few lapses (e.g. XRO) which had a forward PE ratio of about 100 when I bought it last financial year … and, I paid the price when the higher interest rates and threats of inflation caused a rapid change in valuation of most tech stocks.

I expect a bit of volatility in my mostly “growth” investment portfolio and I try to reassure myself that, despite the odd negative year in the Slack Investment Portfolio the Stable Income portfolio is doing its job and keeping Slack Investor with enough cash to keep things running. In the world markets, the FTSE 100 Total Return Index was up 5.7% (last FY down 13.8%). Dividends helped the Australian Accumulation Index to be down 7.5% for the financial year (last FY +27.8%). The S&P 500 Total Return Index took a breather at last – and was down 10.7% (last FY up 36.4%) for the same period. All of these Total Return Indexes include any accumulated dividends, wheras the chart below of the ASX 200 for FY 2022, just shows stock prices.

The ASX 2oo Weekly chart for FY 2022- Dividends helped stem the losses for FY2022, but the ASX Accumulation Index is still down 7.5% for the FY – Incredible Charts – Click for better resolution.

Slack Portfolio Results FY 2022

All Performance results are before tax. The Slack Portfolio is Slack Investor’s investment portfolio and it had its first negative year since its establishment in 2010 – with an annual FY 2022 performance of -14.3%. Full yearly results with benchmarks are shown in the table below. It was a challenging year for all of my benchmarks that were exposed to sharemarkets (Median Balance Fund -2.5%, Vanguard Growth Fund -13.0%, ASX 200 Accumulation -6.5%).

Slack Investor seems to be clueless in real estate predictions … I have thought for some years that there must be a sizable correction soon – as the prices are still stratospheric in Melbourne and Sydney compared to incomes. The correction may still yet happen as interest rate rises are yet to take their toll.

The Brisbane real estate market was the place to be for FY 2022 (+25.6%) on top of a big year last year!) – Inflation was also a suprise for the challenged Slack Investor – with the CPI at +6.1%.

YEAR SLACK FUND MEDIAN BAL VGARD GROWTH ASX200Acc RES BRIS RES MELB CASH CPI
2010 6.6 9.8 12.3 13.1 10.8 26.9 4.2 3.1
2011 2.5 8.7 9.1 11.7 -2.4 0.9 4.4 3.7
2012 8.3 0.4 1.3 -6.7 1.3 -0.9 4.3 1.2
2013 26.5 14.7 18.6 22.8 7.7 8.3 3.2 2.4
2014 23.6 12.7 14.5 17.4 11.5 12.8 2.6 3.0
2015 2.4 9.6 11.8 5.7 7.7 15.6 2.5 1.5
2016 14.2 3.1 4.2 0.6 8.4 9.5 2.2 1.3
2017 19.5 8.1 8.8 14.1 6.5 17.7 1.9 1.9
2018 37.6 7.2 10.0 13.0 5.2 3.9 3.9 2.1
2019 19.7 6.2 9.8 11.5 1.7 -6.0 2.0 1.3
2020 9.4 0.3 0.6 -7.7 8.4 13.8 1.1 -0.3
2021 21.7 13.0 20.3 27.8 17.9 10.7 0.2 3.8
2022 -14.3 -2.5 -13.0 -6.5 25.6 3.1 0.3 6.1

The Slack Fund yearly progress vs BENCHMARKS. The Median Balanced Fund (41-60% Growth Assets)Vanguard Growth FundASX 200 Accumulation IndexCorelogic Residential Property Home Value Index in both Brisbane and Melbourne, and Cash (Australian Super Cash Fund) and Consumer Price Index (CPI)

However, the five-year compound annual performance gives me a much better idea about how things are going and will smooth out any dud (or remarkable!) results. The Slack Fund is still ahead of Benchmarks – but currently being challenged by Brisbane Residential real estate.

Slack Investor 5-year compound annual rate of return – compared to benchmarks – Click for better resolution.

The beauty of compounding with a succession of good performance results can be seen in the chart below showing the growth of an initial investment in June 2009 of $10000.

The rate of growth of $10000 invested by Slack Investor in FY 2009 – compared to benchmarks – Click for better resolution.

10-year compound annual rate of return

The Slack Fund has been around a while and, at last, I am generating some long term data (10-year compound “rolling” annual rate of return). Over this time frame, the Slack Fund has been performing very well. A long-term annual rate of return of over 15% – Go Slack Fund!

However, the 10-yr rates of return of the Median Balanced Fund, Vanguard Growth fund, ASX200, and residential property in Brisbane and Melbourne are also great long term investments, generating a 10-year compound annual rate of return of at least 7% p.a.

YEARSLACK FUNDMEDIAN BALVGARD GROWTHASX200AccRES BRISRES MELBCASH
201915.68.010.05.88.52.9
202015.97.07.85.57.32.6
202117.97.49.37.58.32.2
202215.27.18.19.39.98.71.8
The Slack Fund 10-year compound annual “rolling” rate of return – compared to benchmarks- The Median Balanced Fund (41-60% Growth Assets)Vanguard Growth FundASX 200 Accumulation IndexCorelogic Residential Property Home Value Index in both Brisbane and Melbourne, and Cash (Australian Super Cash Fund). The Vanguard Growth Fund was established in 2012 and has only just been able to generate a 10-yr rate of return.