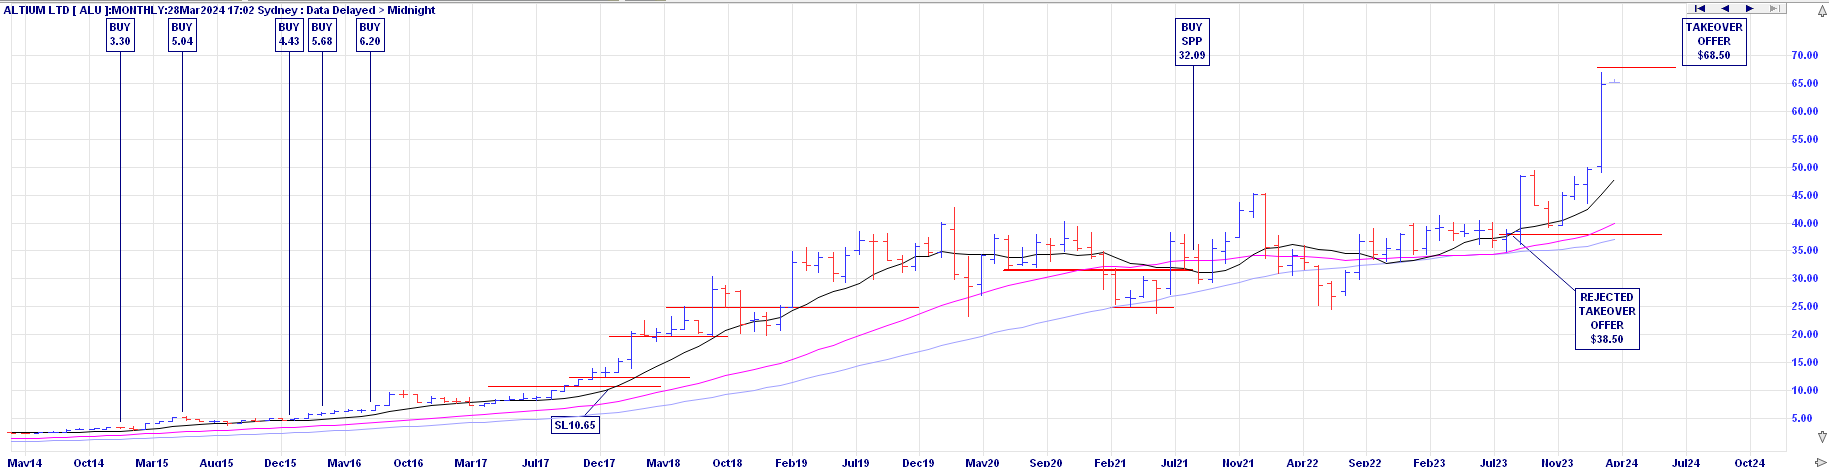
It is with very mixed feelings that Slack investor reports on the likely takeover of Altium (ALU) – one of his major holdings (16.6% of total Portfolio) – by the Japanese Renesas Electronics Corporation.
Renesas will acquire all outstanding shares of Altium for a cash price of A$68.50 per share, representing a total equity value of approximately A$9.1 billion
Altium Press Release – February 15, 2024
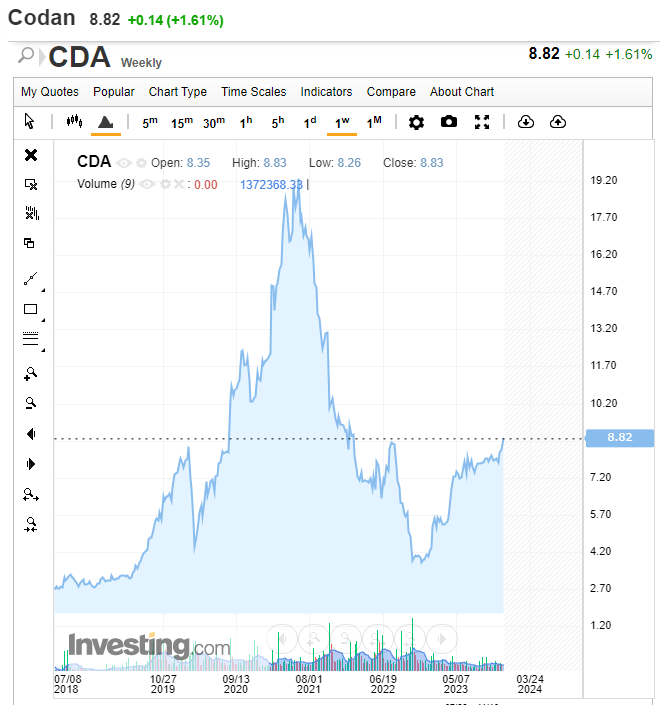
Although this represents a tidy profit, as I first bought into Altium about 10 years ago when they were trading at $3.30, I will be genuinely sad to stop being a shareholder of this wonderful company. I envisaged holding Altium shares for a very, very, long time!
Why I originally bought into Altium?
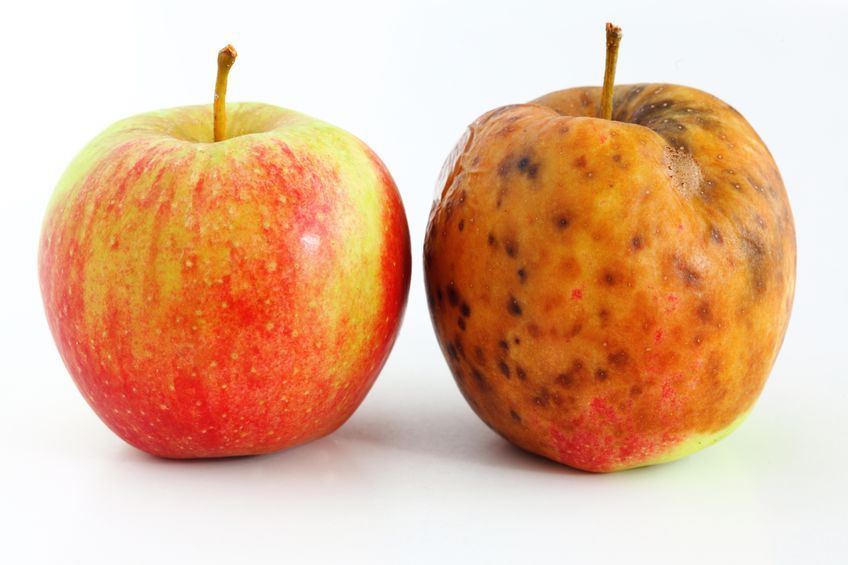
Let’s get this straight, Slack Investor is no stock picking genius. My portion of profitable sold shares is only about 55%. That is, I have made losses on 45% of them – it is not that impressive! – but my overall performance results are good. This is because I follow the Peter Lynch philosophy – where you try to stay in the stocks that are performing well and “weed out” the stocks that are not doing well.
“Some stocks go up 20-30 percent – and they get rid of it and hold onto the dogs. And it’s sort of like watering the weeds and cutting out the flowers. You want to let the winners run.”
Peter Lynch – Legendary Investor and Fund Manager. From 1977 until 1990, he ran the Magellan fund where he averaged a 29.2% annual return for those years.
Slack Investor is always on the lookout for growth companies … and Altium poked up its head and looked at me in 2014 from one of the financial sites that I read. The next step is a bit of independent research. My “go to” here is the most excellent Market Screener site. I went through my usual process for buying and checked the Market Screener/Financials tab for a reasonable projected Price/Earnings ratio, an established record of improvement in earnings, and a forecast Return on Equity (ROE) above 15%. Altium stood out here with no debt and a ROE of between 35 and 50. This company was growing!
After my initial purchase, I bought more parcels of ALU over the next two years as the shares continued to grow and their outlook projections were confirmed.
The Altium Story
Altium is an Australian-based software company that provides electronics design software to circuit-board engineers. These circuit boards are in every bit of technology that we own.

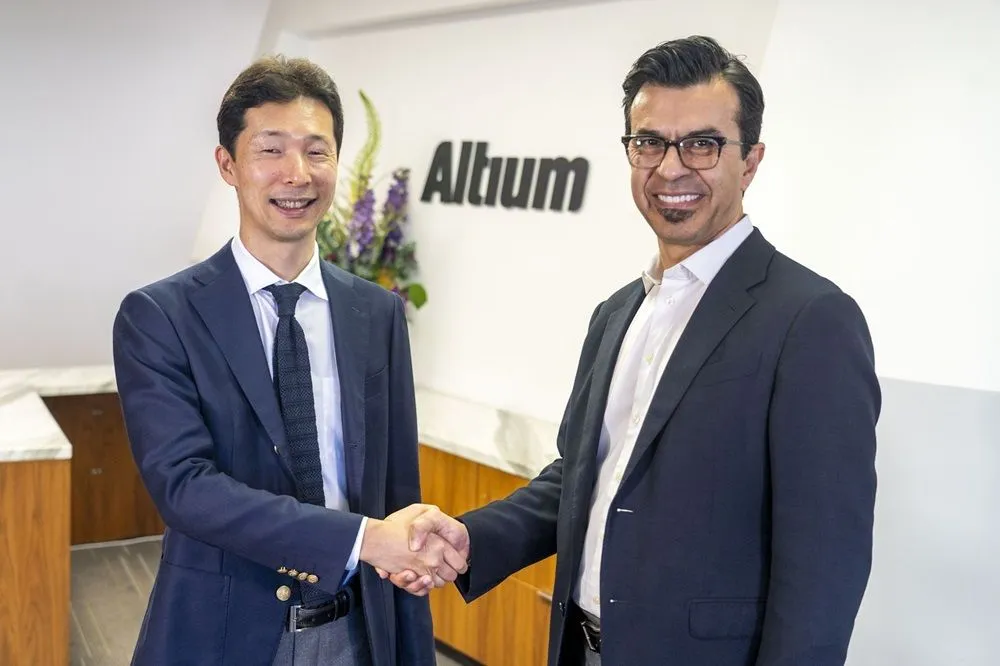
By the time Slack Investor had woken up to the Altium story, Aram Mirkazemi was the established CEO of Altium Limited. He came to Australia from Iran as a refugee in the 1980’s after a 6-month stint in a refugee camp in Pakistan. He did not speak English. After gaining qualifications in IT and engineering, he met Nick Martin, the founder of Altium, at a soccer game and Nick offered him a job. After an eventual falling out, Aram left to start his own software company. When Nick steeped down as CEO, Aram returned to Altium with a vision to make Altium a world player in printed circuit board design.
… in order to be able to change the way the electronics industry works you need to be able to standardise on one platform, like the graphics industry did with Photoshop or Microsoft’s dominance of the operating system and productivity tools market.
After several years of growth and gaining market share. The Altium board rejected an offer of $38.50 per share from Autodesk Inc back in June 2021 as they thought that the offer ‘significantly undervalues’ the companies prospects. The 2024 Renesas offer is yet to be approved by shareholders, but it seems that all the significant players are already “on board”. The offer A$68.50 per share in cash. represents a premium of approximately 34% to the pre-offer price.
All I can say is, it has been an honour to be part-owner (shareholder) of this great company – Thank you Aram and his team. I will be selling part of my holding this tax year (to spread the capital gain over two tax years) and wait for the cash offer to come through in 2025 for the remainder.
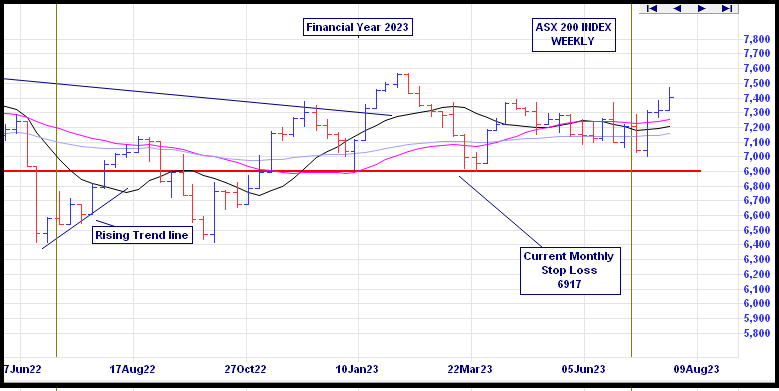
March 2024 – End of Month Update

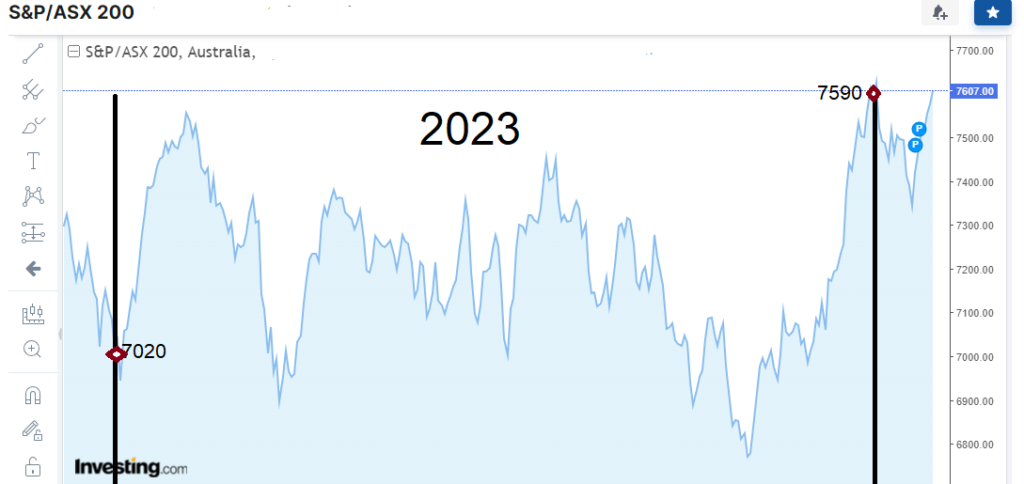
More Happy Days in the stock market. As the troubled world marches on, all Slack Investor followed markets rose this month. The ASX 200 up 2.6%, the FTSE 100 up 4.2%, and the S&P 500 up 3.1%,
Slack Investor remains IN for the FTSE 100, the ASX 200, and the US Index S&P 500.
All Index pages and charts have been updated to reflect the monthly changes – (ASX Index, UK Index, US Index). The quarterly updates to the Slack Portfolio have also been completed.