
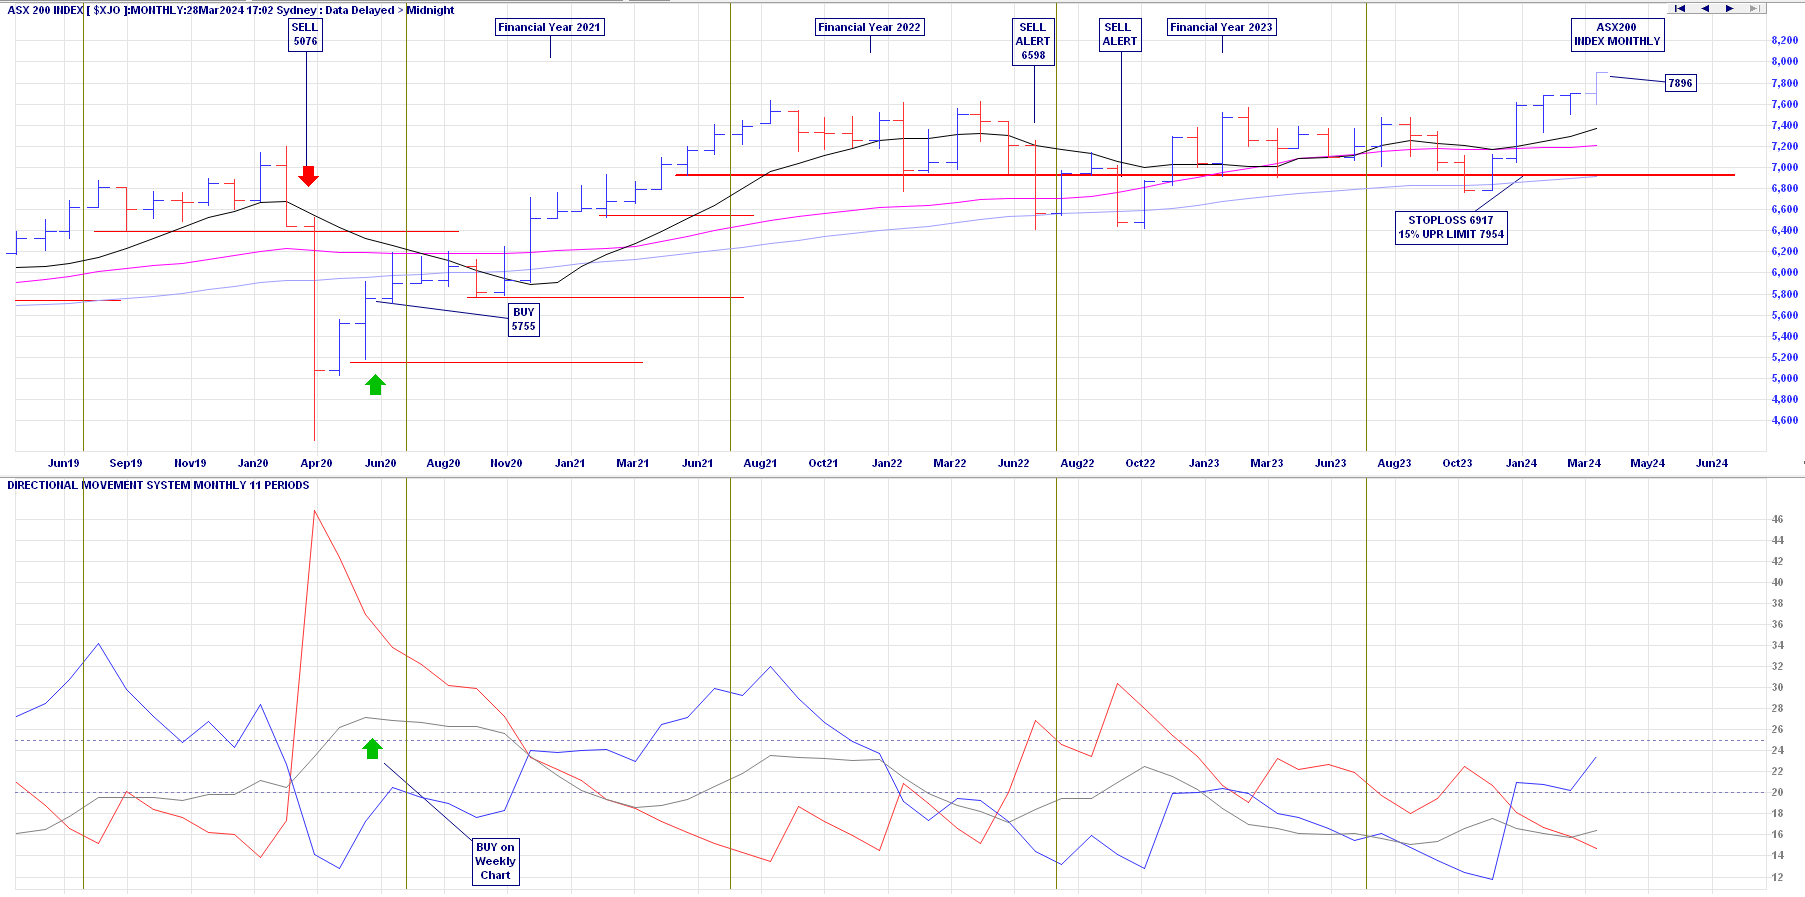
Australian Index funds (ASX 200) … Slack Investor is IN.
Slack investor has a “soft sell” approach when the stop loss is breached and I gauge that the market is not too overvalued. I will not sell against the overall trend but monitor my index funds on a weekly basis after a breach.
Slack Investor has been running his “index-timing” strategy since 2004. Although, till recently, the method has proved to be an improvement on the “buy and hold” strategy, the benefits work out to be a few percent per annum for the Australian Index (i.e. 1.3% p.a outperformance for Slack market timing strategy over ASX200).
These relatively small gains would have been offset by share dividends if I was using the alternative “buy and hold” strategy. Market timing works well when there are sustained periods of bull and bear markets and the changes between the two are not too rapid. The short transitions and the recent speed of market fluctuations has forced a bit of a rethink on Slack Investor’s timing the markets strategy – and have decided to keep the experiment going for 20 years (till 2024) – then probably go for the more appropriate Slack Investor method of doing nothing and adopting a “buy and hold” technique for index funds.
(Click on chart for a much better resolution – from Incredible Charts)
| DATE | ACTION | ASX 200 | MONTHLY STOPLOSS | ASX 200 CYCLE CHANGE | VALUE OF 10K SLACKINV sinceJUN04 | VALUE OF 10K ASX200 sinceJUN04 | SLACK INV OUTPERF | SLACK INV OUTPERF(pa) |
|---|---|---|---|---|---|---|---|---|
| 28-Mar-24 | LATEST | 7896 | 6917 | 37.2% | $32,988 | $26,233 | 26% | 1.3% |
| 29-Feb-24 | LATEST | 7698 | 6917 | 33.8% | $32,160 | $25,575 | 26% | 1.3% |
| 31-Jan-24 | LATEST | 7680 | 6917 | 33.4% | $32,085 | $25,515 | 26% | 1.3% |
| 29-Dec-23 | LATEST | 7590 | 6917 | 31.9% | $31,709 | $25,216 | 26% | 1.3% |
| 30-Nov-23 | LATEST | 7087 | 6917 | 23.1% | $29,608 | $23,545 | 26% | 1.3% |
| 31-Oct-23 | SELL ALERT | 6780 | 6917 | 17.8% | $28,325 | $22,525 | 26% | 1.3% |
| 30-Sep-23 | LATEST | 7048 | 6917 | 22.5% | $29,445 | $23,415 | 26% | 1.3% |
| 31-Aug-23 | LATEST | 7305 | 6917 | 26.9% | $30,519 | $24,269 | 26% | 1.3% |
| 31-Jul-23 | LATEST | 7410 | 6917 | 28.8% | $30,957 | $24,618 | 26% | 1.3% |
| 30-Jun-23 | LATEST | 7203 | 6917 | 25.2% | $30,092 | $23,930 | 26% | 1.4% |
| 31-May-23 | LATEST | 7091 | 6917 | 23.2% | $29,624 | $23,558 | 26% | 1.4% |
| 28-Apr-23 | LATEST | 7309 | 6917 | 27.0% | $30,535 | $24,282 | 26% | 1.4% |
| 31-Mar-23 | LATEST | 7177 | 6917 | 24.7% | $29,984 | $23,844 | 26% | 1.4% |
| 28-Feb-23 | LATEST | 7258 | 6917 | 26.1% | $30,322 | $24,113 | 26% | 1.4% |
| 31-Jan-23 | LATEST | 7476 | 6917 | 29.9% | $31,233 | $24,837 | 26% | 1.4% |
| 30-Dec-22 | LATEST | 7038 | 6917 | 22.3% | $29,403 | $23,382 | 26% | 1.4% |
| 30-Nov-22 | LATEST | 7284 | 6917 | 26.6% | $30,431 | $24,199 | 26% | 1.4% |
| 31-Oct-22 | TENTATIVE SELL | 6863 | 6917 | 19.3% | $28,672 | $22,801 | 26% | 1.4% |
| 30-Sep-22 | TENTATIVE SELL | 6474 | 6917 | 12.5% | $27,047 | $21,508 | 26% | 1.4% |
| 31-Aug-22 | LATEST | 6986 | 6917 | 21.4% | $29,186 | $23,209 | 26% | 1.4% |
| 29-Jul-22 | TENTATIVE REMAIN | 6945 | 6917 | 20.7% | $29,015 | $23,073 | 26% | 1.4% |
| 30-Jun-22 | TENTATIVE SELL | 6568 | 6917 | 14.1% | $27,440 | $21,821 | 26% | 1.4% |
| 31-May-22 | LATEST | 7211 | 6917 | 25.3% | $30,126 | $23,957 | 26% | 1.4% |
| 29-Apr-22 | LATEST | 7435 | 6917 | 29.2% | $31,062 | $24,701 | 26% | 1.4% |
| 31-Mar-22 | LATEST | 7499 | 6917 | 30.3% | $31,329 | $24,914 | 26% | 1.5% |
| 28-Feb-22 | LATEST | 7049 | 6917 | 22.5% | $29,449 | $23,419 | 26% | 1.5% |
| 31-Jan-22 | LATEST | 6971 | 6917 | 21.1% | $29,123 | $23,159 | 26% | 1.5% |
| 31-Dec-21 | LATEST | 7444 | 6917 | 29.3% | $31,099 | $24,731 | 26% | 1.5% |
| 30-Nov-21 | LATEST | 7255 | 6917 | 26.1% | $30,310 | $24,103 | 26% | 1.5% |
| 29-Oct-21 | LATEST | 7323 | 6917 | 27.2% | $30,595 | $24,329 | 26% | 1.5% |
| 30-Sep-21 | LATEST | 7332 | 6917 | 27.4% | $30,631 | $24,359 | 26% | 1.5% |
| 31-Aug-21 | ADJUST SL | 7534 | 6917 | 30.9% | $31,475 | $25,030 | 26% | 1.5% |
| 30-Jul-21 | LATEST | 7392 | 6517 | 28.4% | $30,882 | $24,558 | 26% | 1.5% |
| 30-Jun-21 | LATEST | 7313 | 6517 | 27.1% | $30,522 | $24,296 | 26% | 1.5% |
| 31-May-21 | LATEST | 7161 | 6517 | 24.4% | $29,917 | $23,791 | 26% | 1.5% |
| 30-Apr-21 | LATEST | 7025 | 6517 | 22.1% | $29,349 | $23,339 | 26% | 1.5% |
| 31-Mar-21 | LATEST | 6790 | 6517 | 18.0% | $28,367 | $22,558 | 26% | 1.5% |
| 26-Feb-21 | ADJUST SL | 6673 | 6517 | 16.0% | $27,878 | $22,169 | 26% | 1.5% |
| 29-Jan-21 | LATEST | 6607 | 5763 | 14.8% | $27,602 | $21,950 | 26% | 1.6% |
| 31-Dec-20 | LATEST | 6587 | 5763 | 14.5% | $27,519 | $21,884 | 26% | 1.6% |
| 30-Nov-20 | LATEST | 6517 | 5763 | 13.2% | $27,226 | $21,651 | 26% | 1.6% |
| 30-Oct-20 | ADJUST SL | 5927 | 5763 | 3.0% | $24,762 | $19,691 | 26% | 1.6% |
| 30-Sep-20 | LATEST | 5815 | 5169 | 1.0% | $24,994 | $19,319 | 26% | 1.6% |
| 31-Aug-20 | LATEST | 6060 | 5169 | 5.3% | $25,317 | $20,133 | 26% | 1.6% |
| 31-Jul-20 | LATEST | 5927 | 5169 | 3.0% | $24,762 | $19,691 | 26% | 1.6% |
| 30-Jun-20 | LATEST | 5897 | 5169 | 2.5% | $24,636 | $19,591 | 26% | 1.6% |
| 29-May-20 | BUY | 5755 | 5169 | $24,043 | $19,120 | 26% | 1.6% | |
| 31-Mar-20 | SELL | 5076 | 6396 | -3.4% | $24,043 | $16,864 | 43% | 2.7% |
| 29-Feb-20 | LATEST | 6441 | 6396 | 22.6% | $30,508 | $21,399 | 43% | 2.7% |
| 31-Jan-20 | Adjust SL | 7017 | 6396 | 33.6% | $33,237 | $23,312 | 43% | 2.7% |
| 31-May-18 | Adjust SL | 6011 | 5724 | 14.5% | $28,472 | $19,970 | 43% | 3.1% |
| 31-Jul-17 | Adjust SL | 5720 | 5629 | 8.9% | $27,093 | $19,003 | 43% | 3.3% |
| 31-Oct-16 | Adjust SL | 5317 | 5192 | 1.2% | $25,185 | $17,664 | 43% | 3.5% |
| 29-Jul-16 | Adjust SL | 5562 | 5051 | 5.9% | $26,345 | $18,478 | 43% | 3.5% |
| 29-Apr-16 | BUY | 5252 | 4881 | $24,877 | $17,449 | 43% | 3.6% | |
| 31-Aug-15 | SELL | 5207 | 20.6% | $24,877 | $17,299 | 44% | 3.9% | |
| 31-Aug-12 | BUY | 4316 | 37.41 | $20,620 | $14,339 | 44% | 5.4% | |
| 29-Jul-11 | SELL | 4424 | 15.9% | $20,620 | $14,698 | 40% | 5.7% | |
| 29-May-09 | BUY | 3817 | 29.41 | $17,791 | $12,681 | 40% | 8.2% | |
| 31-Mar-08 | SELL | 5355 | 77.9% | $17,791 | $17,791 | 0% | 0% | |
| 30-Jun-04 | STARTBUY | 3010 | 32.1 | $10,000 | $10,000 |
OLD Charts
Below are the legacy charts – for historical record! – when Slack Investor used the STW.AX ETF to base his buy/sell decisions on the Australian Index … I have now started using the ASX 200 directly (see above).
(Click on chart for better resolution)
| DATE | ACTION | STW | ~ ASX | MONTHLY | STW (CYCLE) | VALUE OF 10K | VALUE OF 10K | SLACK INV | SLACK INV |
|---|---|---|---|---|---|---|---|---|---|
| (AUD) | 100 | STOPLOSS | GAIN/LOSS | SLACK INV sinceJUN04 | INDEX sinceJUN04 | OUTPERF | OUTPERF (pa) | ||
| 30-SEP-17 | LATEST | 53.06 | 47.96 | 6.8% | $21,484 | $14,917 | 44% | 3.3% | |
| 30-Jun-16 | Adjust SL | 47.96 | |||||||
| 29-Apr-16 | BUY | 49.66 | 5252 | 43.89 | |||||
| 31-Aug-15 | SELL | 48.99 | 5207 | 20.0% | $20,108 | $13,773 | 46% | 4.1% | |
| 30-Jan-15 | Adjust SL | 48.78 | |||||||
| 28-Nov-14 | Adjust SL | 48.2 | |||||||
| 31-Mar-14 | Adjust SL | 46.99 | |||||||
| 31-Jul-13 | Adjust SL | 43.33 | |||||||
| 31-Aug-12 | BUY | 40.81 | 4316 | 37.41 | |||||
| 29-Jul-11 | SELL | 41.37 | 4424 | 13.7% | $16,750 | $11,631 | 44% | 6.2% | |
| 29-Apr-11 | Adjust SL | 42.49 | |||||||
| 31-May-10 | Adjust SL | 39.7 | |||||||
| 31-Jul-09 | Adjust SL | 34.59 | |||||||
| 29-May-09 | BUY | 36.37 | 3817 | 29.41 | |||||
| 31-Mar-08 | SELL | 52.38 | 5355 | 47.3% | $14,726 | $14,726 | 0% | 0% | |
| 31-Aug-07 | Adjust SL | 52.9 | |||||||
| 30-Jun-06 | Adjust SL | 47.74 | |||||||
| 30-Jun-04 | STARTBUY | 35.57 | 3010 | 32.1 | $10,000 | $10,000 |
