Measuring your portfolio performance can do your head in … but Slack Investor thinks that it is important that you set aside a time to evaluate your investment performance at least once a year. I choose the end of the financial year in Australia (June 30) as a good time for these calculations … but you can chose your own date … and, if whatever you do, you do it consistently … you are going to be OK.
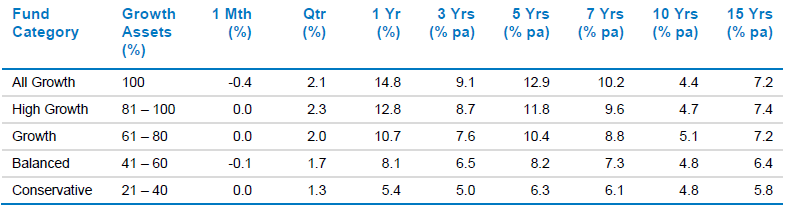
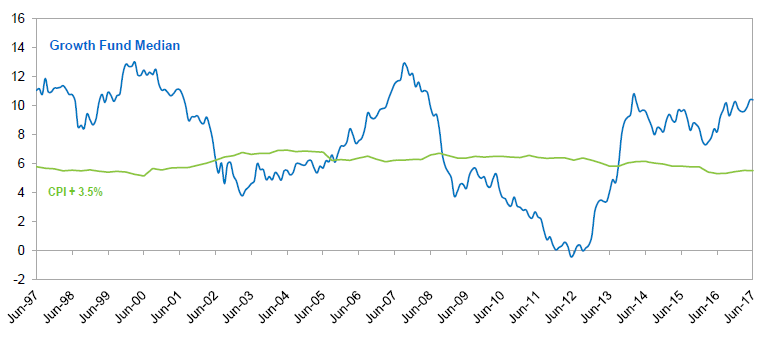
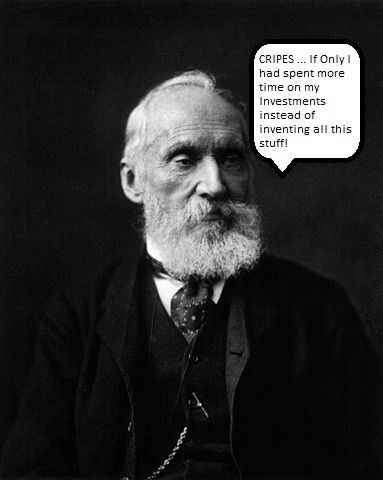
First of all … why measure? Lord Kelvin was a smart bloke – as discussed previously, measurement adds to our knowledge – By measuring your own portfolio performance you get an idea of how you are doing compared to other portfolios, share indicies, or managed funds. If you consistently underperform against other bench marks … then it might be time to become the ultimate Slack Investor and outsource your portfolio to Index funds.
Outsourcing into passive investment is not so bad … if the fees are kept low … “The Buff” , (aka Warren Buffet, the worlds greatest investor!) has promised to give away 99% of his $65 billion fortune when he dies – the remainder of his fortune will be invested in bonds and index funds to support his wife and family.
My advice to the trustee could not be more simple: Put 10% of the cash in short-term government bonds and 90% in a very low-cost S&P 500 index fund. (I suggest Vanguard’s.) I believe the trust’s long-term results from this policy will be superior to those attained by most investors – whether pension funds, institutions or individuals – who employ high-fee managers. from source
- Portfolio with no inflows or outflows
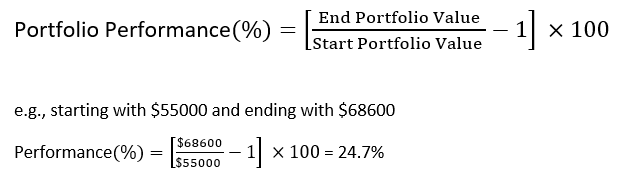
Lets start simply … supposing your have the most basic portfolio that reinvests its earnings with no external inflows (“cash in”, contributions, or transfer) and no external outflows (“cash out”, pension payment, or transfer) from your investment portfolio during the year and you want to do a performance calculation to benchmark yourself with other funds and investments. Most people can come up with a starting value and an ending value of their portfolios at the year (financial year) end – this includes the value of your stocks and any portfolio cash. Slack Investor prefers to calculate his returns before tax. So, tax credits such as franked dividends are included in his portfolio return.
Whatever happens inside this portfolio – buys and sells, dividends, interest, expenses, brokerage and fees – are just part of the portfolio business and will be reflected in its finishing value.
An Excel spreadsheet that will make this job easier is available on the Resources Page.
2. Portfolio with inflows and outflows – Approximation
However, for most real portfolios, there is money transferred into, or out of, your portfolio account during the year. Unlike the Beardstown Ladies, if you want to accurately portray how you are doing, it is imperative that you account for cash flows either in or out of your portfolio. If you want the least amount of work and you are willing to calculate your portfolio return approximately – the way below will work a treat. A net contributions figure is obtained (inflows – outflows) to give an ‘average’ amount of capital invested during the year and by subtracting 50% of net additions from the ending value and adding 50% to the beginning value – we get an approximate percentage return.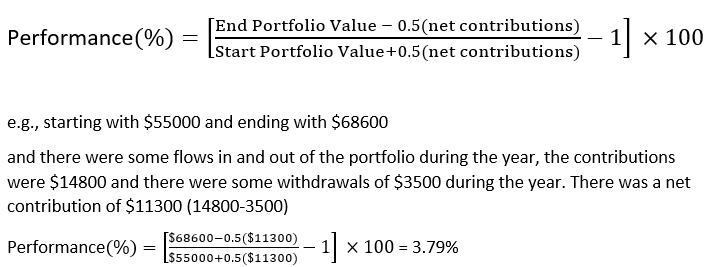
An Excel spreadsheet that that performs these calculations is available on the Resources Page.
Of course, in real life, rather than using averages, portfolio returns depend greatly in the timing of when you had capital available. The above is an approximation. Slack Investor chooses to go into more detail to reflect the time value of money for his portfolio. These intricate ways will be revealed in the last of this measurement series next month.